The radio halo in the merging cluster A3562
We present new VLA observations at 1.4 GHz confirming the presence of a radio halo at the centre of the cluster A3562, in the core of the Shapley Concentration. We also report a detailed multifrequency radio study of the head tail galaxy J1333–3141, which is completely embedded in the halo emission. The radio halo has an irregular shape, and a largest linear size of 620 kpc, which is among the smallest found in the literature. The source has a steep spectrum, i.e. , and its total radio power, P W Hz-1, is the lowest known to date. The radio power of the halo and the X–ray parameters of the cluster, such as LX and kT, nicely fit the correlations found in the literature for the other halo clusters, extending them to low radio powers. We found that the total number of electrons injected in the cluster environment by the head–tail source is enough to feed the halo, if we assume that the galaxy has been radio active over a large fraction of its crossing time. We discuss possible origins of the radio halo in the light of the two–phase model (Brunetti et al. 2001) and propose that the observed scenario is the result of a young source at the beginning of the reacceleration phase.
Key Words.:
Radio continuum: galaxies – Clusters: general – Galaxies: clusters: individual: A3562 – intergalactic medium – galaxies: clusters1 Radio halos and the case of A3562
The existence of cluster radio halos and relics is well established, and their number has considerably increased over the past few years (e.g. Giovannini & Feretti 2000, 2002; Govoni et al. 2001a; Bacchi et al. 2003). At present about 40 objects are known, supporting the evidence that many different components coexist in clusters of galaxies over the whole cluster scale. In particular, beyond the galaxies themselves and the hot thermal gas, visible in the soft X–ray band, halos and relics reveal the existence of cluster scale magnetic fields, with intensity of the order of G, and of relativistic electrons spread over the same large volume.
Both halos and relics are characterised by steep integrated radio spectra ( 1). In few well studied cases, halos show a remarkable steepening of the spectrum going from the centre to the peripheral regions. Halos are located at the centre of the hosting cluster and are unpolarised, while relics are usually found at the cluster outskirts, are more irregular in shape and show high fractional polarisation. The linear size for both types of sources ranges from 0.5 up to more than 1 Mpc (Feretti & Giovannini 1996, Giovannini & Feretti 2002).
The considerable number of radio halos known to date allows us to search for correlations and other statistical properties. It is found that the radio power of halos strongly correlates with the cluster bolometric luminosity LX, the intracluster gas temperature kT (Liang et al. 2000; Colafrancesco 1999; Feretti 2000) and the cluster mass M (Govoni et al. 2001a). In particular, logP increases with increasing LX, T and cluster mass, and the detection rate of radio halos is as high as 30% in clusters with L erg s-1 (Giovannini et al. 1999). Finally, Govoni et al. (2001b) found a spatial correlation between the halo radio brightness and the X–ray brightness of the intracluster gas, suggesting some connection between these two components.
The major energy release ( erg s-1) during cluster mergers has been invoked to explain the formation of halos and relics. Absence of cooling flows, substructure and distortions in the galaxy and gas distribution, galaxy velocity structure, gas temperature gradients are all considered signatures of cluster mergers (see Böhringer & Schuecker 2002 for a review on this topic). All these are known to be common properties of clusters containing radio halos. Based on a quantitative analysis of the cluster dynamical state, Buote (2001) proposed that massive clusters experiencing violent mergers, i.e. those that have seriously disrupted the core, are most likely to host a radio halo. On the other hand, many clusters with clear signs of merger do not possess a halo, suggesting that our understanding of the whole picture is not yet complete. In situ acceleration of relativistic electrons during a merger event, may be due to merger shocks (e.g. Sarazin 1999) or to turbulence (e.g. Schlickeiser et al. 1987; Brunetti et al. 2001; Ohno et al. 2002). Recently, Gabici & Blasi (2002) claimed that shock acceleration provides efficient particle acceleration only in the case of minor mergers.
A3562 (z=0.048, B–M type I and richness class 2) is located in the central region of the Shapley Concentration, where major cluster merging processes and group accretion are known to take place (Ettori et al. 1997; Bardelli et al. 1996 and 1998). The cluster has a temperature of kT = 5.10.2 keV, a bolometric luminosity L erg s-1 and a total mass M M⊙ (Ettori et al. 2000). The core region is characterised by a small cooling flow (Peres et al. 1998). Beyond the central cooling flow, excess X–ray emission over the fitted –model (significant at the 95% confidence level) was detected with Beppo–SAX west of the cluster centre, in the direction of A3558, and at the extreme eastern periphery of the cluster, while no significant excess hard X–ray emission over the thermal Bremsstrahlung component was found (Ettori et al. 2000).
Radio observations at 1.38 GHz and 2.36 GHz (22 cm 13 cm respectively), carried out with the Australia Telescope Compact Array, revealed the presence of a head–tail radio galaxy, J1333–3141, located at a projected distance of from the cluster centre. Furthermore, hints of cluster scale emission were found, on the basis of a MOST 843 MHz image and inspection of the NVSS (Venturi et al. 2000, hereinafter V2000). The radio survey revealed the presence of six more radio galaxies located east of the cluster centre, in the same region where the excess X–ray emission was noted.
In this paper we confirm the presence of a radio halo in the cluster A3562, thanks to new 1.4 GHz Very Large Array (VLA) observations, and perform an analysis of its properties and origin. Furthermore, we carry out a thorough study of the head–tail radio galaxy J1333–3141, embedded in the halo emission, based on the data published in V2000 and on new VLA observations over a wide range of frequencies.
The observations and data analysis are reported in Section 2 and 3; the discussion on the halo origin in the light of the two–phase model (Brunetti et al. 2001), its connection with the head–tail galaxy J1333–3141 and with the cluster merging in A3562 are given in Section 4; conclusions are summarised in Section 5.
We will assume S , Ho = 50 km s-1Mpc-1, qo=0.5. With our cosmology, at the distance of A3562 1′′ corresponds to 1.28 kpc.
2 The head–tail radio galaxy J1333–3141
The radio emission of the halo is blended with that of the head–tail galaxy J1333–3141, both in the 1.4 GHz image presented here and in the 843 MHz image (V2000). For this reason, in order to estimate the integrated spectral index of the halo between 843 MHZ and 1.4 GHZ and to study its properties, a detailed knowledge of the head–tail radio galaxy is also necessary.
J1333–3141 is associated with the cluster galaxy MT 4108 (v=14438 km/s and bJ = 17.25), which is located at a projected distance of from the central cD galaxy (V2000).
| Source & Field | RAJ2000 | DECJ2000 | u–v range | Duration | ||
|---|---|---|---|---|---|---|
| h,m,s | ∘,′,′′ | k | GHz | MHz | hr | |
| A3562 # 1 | 13 33 32.0 | 41 00.0 | 0.15 – 6 | 1.40 | 50 | 1 |
| J1333–3141 | 13 33 31.7 | 31 41 10.0 | 0.2 – 15 | 0.33 | 6.25 | 0.2 |
| J1333–3141 | 13 33 31.7 | 31 41 10.0 | 3 – 250 | 4.86 | 100 | 0.5 |
| J1333–3141 | 13 33 31.7 | 31 41 10.0 | 4 – 400 | 8.46 | 100 | 0.5 |
2.1 Radio Observations
The source was observed at 330 MHz, 4.86 and 8.46 GHz with the VLA in the BnA configuration on 22 May 2002. Details of the observations are given in Table 1.
Standard calibration, imaging and data analysis were carried out with the NRAO AIPS package.
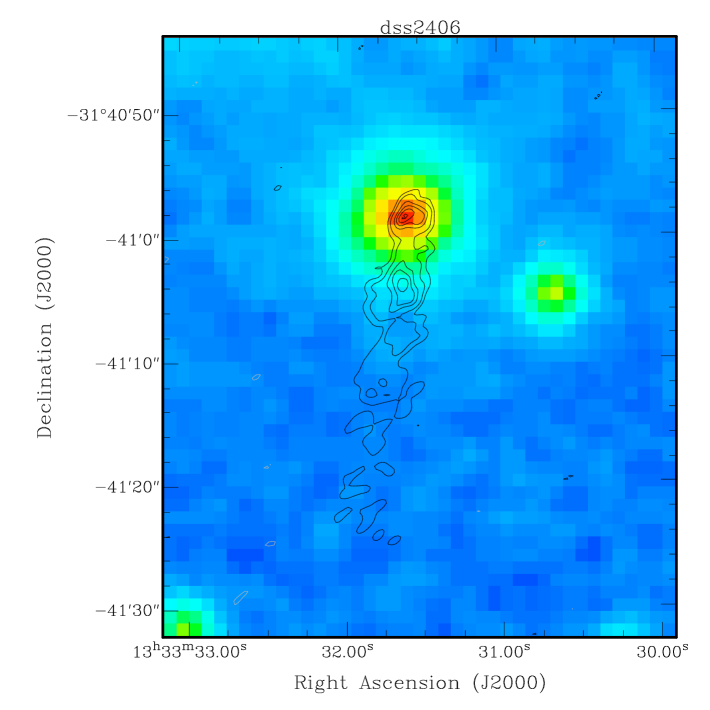
The 330 MHz image and the final full resolution images at 4.86 GHz (overlaid on the DSS–2 red plate) and at 8.46 GHz are given respectively in Figs. 1, 2 and 3. Details of all images are given in Table 2. The error on the total source flux density is 3% at 4.86 GHz and 8.46 GHz, based on gain variations on different scans on the secondary calibrators. This error can be as high as 10% at 330 MHz, due to the shorter duration of the observations and to rapid phase fluctuations introduced by the ionosphere at this low frequency.
A set of images obtained with natural weighting (not shown here) were also produced at 4.86 GHz and 8.46 GHz, in order to derive the integrated spectrum of J1333–3141 (see next subsection). We note that the total flux density in these natural weighted images is % higher than the values given in Table 2.
Finally, for an accurate point–to–point spectrum evaluation, necessary for the study carried out in Sections 2.3 and 4, we used the data presented here and re–analysed the ATCA data published in V2000 to produce various sets of images using the same common portion of the u–v coverage, gridding and restoring beam , as follows (see also Table 3 for a summary):
(a) images at 330 MHz, 1.38 GHz and 2.36 GHz, obtained using the data points in the u–v range 0.5 – 15 k, , p.a. ;
(b) images at 2.36, 4.86 and 8.46 GHz, u–v range = 3 – 50 k, , p.a. 0∘;
(c) images at 4.86 and 8.46 GHz, u–v = range 6 – 250 k , p.a. 1∘.


| Source | RAJ2000 | DECJ2000 | FWHM, P.A. | rms | Speak | Stot | |
|---|---|---|---|---|---|---|---|
| h, m, s | GHz | arcsec, | mJy/beam | mJy/beam | mJy | ||
| Halo | 13 33 32.0 | 41 00 | 1.40 | 41.935.1, 55 | 0.05 | – | 20.0⋆ |
| J1333–3141 | 13 33 31.6 | 31 41 02 | 0.33 | 27.012.5, –52 | 4.04 | 98.9 | 259.0 |
| J1333–3141 | 13 33 31.6 | 31 41 02 | 4.86 | 1.460.84, –57 | 0.05 | 1.25 | 25.1 |
| J1333–3141 | 13 33 31.6 | 31 41 02 | 8.46 | 0.880.51, –53 | 0.04 | 0.64 | 15.6 |
⋆ flux density of the radio halo after subtraction of the point
sources and of the head–tail radio galaxy J1333–3141.
2.2 Morphology and integrated spectrum
The high resolution images at 4.86 and 8.46 GHz (Figs. 2 and 3) suggest that the observed morphology of J1333–3141 is the result of projection effects coupled with strong interaction with the intracluster gas.
The northernmost and most compact knot, visible at both frequencies, is coincident with the nucleus of the host galaxy and has the flattest spectrum (see Section 2.3). Therefore we conclude that it hosts the radio core. In Fig. 3 the nucleus, labelled as component C, clearly shows up because of its flat spectrum and to the higher resolution, and the continuous bend of the northern jet is evident. The northern jet bends by 180∘ within the first kpc from the core, and its tail blends with the southern one. The radio tail bends smoothly eastwards at from the core ( kpc), as first noted in the ATCA 1.38 and 2.36 GHz images (V2000).
We note the similarity between J1333–3141 and the head–tail radio galaxy associated with NGC 4869 at the centre of the Coma cluster, whose jets bend sharply well within the optical counterpart (Feretti et al. 1990).
Using the data presented in this paper (see Section 2.1) and those published in V2000, we derived the total spectrum of the source in the range 330 MHz – 8.46 GHz (see Fig. 4). We note the good consistency between the full resolution 1.38 GHz and the NVSS 1.40 GHz flux density measurements, despite the difference in resolution.
| u–v range | 330 | 1.38 | 2.36 | 4.86 | 8.46 |
|---|---|---|---|---|---|
| k | MHz | GHz | GHz | GHz | GHz |
| 0.5 – 15 | X | X | X | ||
| 3 – 50 | X | X | X | ||
| 6 – 250 | X | X |

The spectrum of J1333–3141 can be considered a power law for GHz, with , and it flattens to .
In order to estimate the flux density of the head–tail at 843 MHz we fitted its total spectrum with a continuum injection model, and obtained S mJy.
2.3 Spectral evolution along the tail
We studied the evolution of the spectrum along the tail of J1333–3141 using the proper set of images (see Section 2.1 and Table 3) and the software Synage (Murgia 2001). The analysis allowed us to identify the nucleus of the radio emission with the northernmost knot, coincident with the central part of the associated galaxy (Fig. 2). The spectral index in the radio core (see Fig. 3), is .
The most important signature in the synchrotron spectrum along the tail is the presence of a frequency break. We could place only a lower limit to the break frequency within the first 8 kpc from the core, i.e. GHz. We considered three more regions along the ridgeline of the jet, chosen to be independent and to have good signal–to–noise ratio on all the images, and found that the break frequency progressively lowers at increasing distance from the nuclear region. Our results are reported in Table 4 and can be interpreted as the combination of electron aging and magnetic field decrement due to the jet expansion.
We note that the spectra were fitted with the model discussed in Jaffe & Perola (1974), thus assuming that there is a redistribution of the electron pitch angles on timescales short compared to their radiative life. In order to avoid the uncertainties in the source volume evaluation and the unknown evolution of the magnetic field with time, we computed the electron radiative age trad along the tail (reported also in Table 4) considering a constant magnetic field, computed over the whole source volume (BG). We note that if we took into account the magnetic field decrement in the calculation of the electron radiative age, the values given in Table 4 would be overestimated by up to a factor of 3, depending on how the magnetic field varies along the tail.
| Dist1 | Dist2 | trad | |
|---|---|---|---|
| arcsec | kpc | GHz | yrs |
| 8 | 10 | ||
| 18 | 23 | 7.4 | 3.4 |
| 23 | 30 | 4.4 | 4.5 |
| 50 | 64 | 2.4 | 6.0 |
Note to Table 4.
In the nuclear region (core and inner jets) the spectrum
is a powerlaw with .
was computed assuming a magnetic field B = 5 G
(see Section 2.3).
3 The radio halo
3.1 Radio Observations
We observed A3562 at 1.4 GHz with the VLA in the DnC configuration on 10 July 2000, as part of a larger project whose aim is the study of the merging region between the centres of A3558 and A3562 at sub–mJy flux density levels. In order to obtain uniform sensitivity, the observations were carried out in mosaic mode, covering the region of interest with four fields. The total length of the observations was 4 hours, and we switched among the four fields every 4.5 minutes. In Table 1 we report the coordinates and observing parameters only for the field relevant for the present paper.
The data reduction was carried out with the NRAO Astronomical Imaging Package System (AIPS). Each field was calibrated and imaged separately, then the four images were combined together with the task LTESS. The rms in the final mosaic image is Jy/beam, and the resolution is FWHM , in p.a. .
Further details concerning the observations and data reduction will be presented in Venturi et al. (2003).
3.2 The morphology
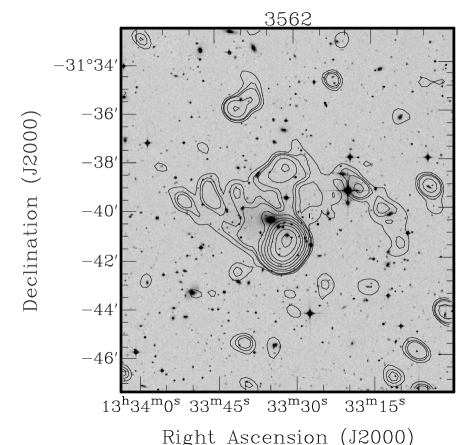
The portion of our final mosaic image including the halo emission at the centre of A3562 is shown in Fig. 5, overlaid on the optical red frame taken from the Digitised Sky Survey DSS–2. Details of the image are given in Table 2.
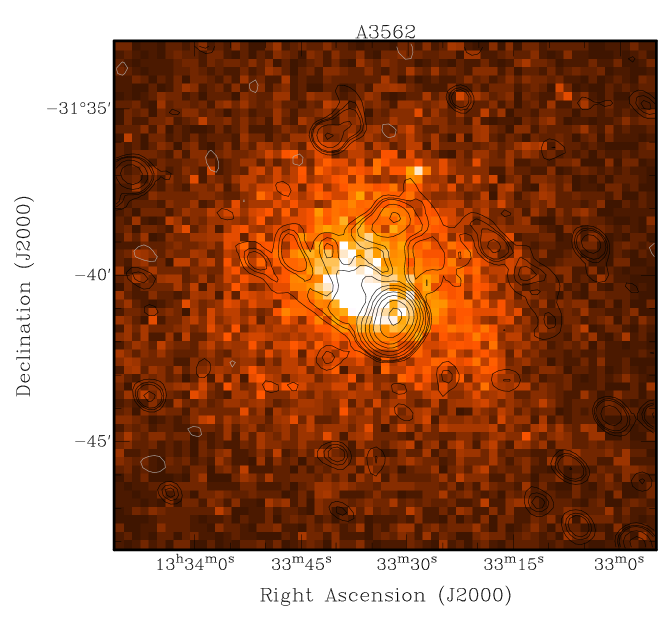
The radio halo at the centre of A3562 has low surface brightness ( mJy/beam, i.e. mJy/arcsec2) and irregular shape, and encompasses the head–tail radio galaxy J1333–3141, as clear from Fig. 6. The overall morphology recorded in our images is in very good agreement with the NVSS image. The largest angular size is , corresponding to 620 kpc. The extension of the radio halo is smaller than that of the X–ray emission, imaged by ROSAT, however it is coincident with its brightest part, as clearly visible from Fig. 7. Together with those found in A1300 and A2218 (Feretti 2000), it is one of the smallest and faintest radio halos known to date.
We note that the observed size of halos depends both on the sensitivity of the observations and on the intrinsic brightness distribution. As a consequence, it is possible that we are underestimating the size of our halo, as the presence of positive residuals south of the halo and of J1333–3141 may suggest (see Fig. 5). A tool to estimate the intrinsic size of the radio halo in A3562 is the radio and X–brightness relation (Govoni et al. 2001b). However, our attempt in this direction was unfruitful since this relation shows broad dispersion at low brightness levels, and its slope is not unique.

In order to estimate the flux density of the halo, we subtracted the point–like components from the u–v data, and obtained a value S 2 mJy. Given the source extension, the flux density error is dominated by the thermal noise rather than by the calibration uncertainties. The radio power is P W Hz-1.
We note that the western part of the halo has a filamentary shape, which might be suggestive of a faint relic. It contributes with mJy to the total flux density of the halo. However, from the present radio observations and from the X–ray information available in the literature (Ettori et al. 2000), it is impossible to test if the imaged radio emission is the result of a radio halo and a relic. Awarded high resolution Chandra X–ray observations and low frequency radio observations will provide the critical information necessary to interpret the observed radio features.
3.3 The radio spectrum
We estimated the spectral index of the radio halo in the frequency range 843 MHz – 1.4 GHz using its flux density at 1.4 GHz reported in Table 2, the radio spectrum of J1333–3141 and the MOST 843 MHz image shown in V2000. After subtracting the contribution of J1333–3141 to the 843 MHz image, we obtain S mJy. We note that the extension of the radio halo at 1.4 GHz (Fig. 5) is larger than at 843 MHz, due to its low surface brightness and to the better sensitivity of the 1.4 GHz data. Considering all the uncertainties, we conclude that is in the range 1.9 – 2.3.
4 Discussion
4.1 The radio halo and the cluster properties
The total power and linear size of the halo are respectively P W/Hz and 620 kpc. These values are smaller than those found for the other halos known in the literature. For comparison, the cluster radio core and the cooling flow region are both of the order of 1.2 arcmin, i.e. kpc (Peres et al. 1998; Ettori et al. 2000).
Assuming that standard equipartition conditions hold in the source (, k=1, = 10 MHz, =100 GHz), the magnetic field in the halo is BG, and the internal energy u erg cm-3. These values are in the range found for the halos known to date (Feretti 2000).
In Fig. 8, left and right panel respectively, we show the logLX (bolometric) – logP1.4GHz relation and the Temperature – logP1.4GHz relation for the halos in the literature (note that the plot shows only halos, i.e. relics and mini–halos were not included) and for A3562, whose X–ray data were derived from Beppo-SAX observations (see Section 1, Ettori et al. 2000). The figure indicates that the halo in A3562 fills a new region of the two diagrams, and nicely fits the extension of the correlation found by Bacchi et al. (2003) for large size halos. In particular, we note that the inclusion of A3562 in their correlation is consistent, within the errors, with their fit. This result suggests that radio halos exist and can be detected also in clusters with L erg s-1, and that the correlation linking the X–ray properties and the radio power holds over three orders of magnitude in logP1.4GHz and one order of magnitude in temperature and X–ray bolometric luminosity. We note that many faint radio halos with surface brightness lower than in A3562 are expected according to the the radio halo luminosity function study of Enßlin & Röttgering (2002), which was based on an extrapolation of the observed LX – P1.4GHz relation. Our measurements seem to support the validity of this extrapolation.

4.2 Origin of the halo
The radio power and size of the halo in A3562 lead to a fundamental question: has the source already fully developed or is it still growing at the present time?
The region of the logP – logLX correlation where A3562 is located, is of crucial importance for testing current models of the halo formation, in particular the two–phase model (Brunetti et al. 2001), which includes an initial injection of relativistic particles (phase 1), and subsequent reacceleration due to turbulence powered by cluster merger (phase 2). In the framework of this model, A3562 may be interpreted either as (a) the result of a modest reacceleration phase, or as (b) a radio halo at the beginning of an energetic reacceleration process. In both cases, A3562–like halos are crucial to our understanding of the merger–halo connection. In particular, radio halos in the logP – logLX region occupied by A3562 are predicted to have a spectrum in the range 1.5 – 2 at frequencies lower than 1.4 GHz. The spectral index of A3562 in the range 1.9 – 2.3 (Section 3.3). However this frequency range is not wide enough to discriminate between the two possibilities (a) and (b). In Fig. 9 synchrotron radio spectra from a reaccelerated electron population are shown. The plot shows that the spectra flatten with increasing duration of the reacceleration phase, going from 0.1 Gyr (solid line) to 0.4 Gyr (dashed line). For a given duration of the reacceleration phase a qualitatively similar trend is also obtained increasing the acceleration efficiency. From Fig. 9 it is clear that additional observations at very low frequency (few hundreds of MHz) will be of crucial importance to confirm this.

4.3 Electron injection in the halo
The head–tail radio galaxy J1333–3141 is completely embedded in the halo emission (see Fig. 6), and it is the best candidate for the replenishment of the electron population in the central part of the cluster. We computed the number of electrons N the radio galaxy injected in the intracluster medium in order to see if it is high enough to feed the halo. We carried out our calculation considering the formulae for the equipartition magnetic field given in Brunetti (2002), where low energy electrons are also taken into account (Beq(J1333–3141) G).
We derived N (J1333–3141) , where is the minimum Lorentz factor of the radiating electrons.
Based on the two–phase models used to reproduce the spectrum shown in Fig. 9 we estimated the minimum number of relic electrons necessary to obtain the observed radio halo, i.e. N. Assuming that the tail is the only source of electrons injected in the halo, it should be N(halo) t N(J1333–3141)/ tdyn, where tdyn is the time the galaxy needed to cross the length of the radio tail. We thus derive that the minimum injection time tmin is:
| (1) |
where , and v is the velocity of the tail (km s-1).
This value of tmin should be compared with the time required for the host galaxy to cross the radio halo region ( 600 kpc), i.e. t yrs. If we assume that v is of the order of the dispersion velocity in the cluster ( = 987 km s-1, Bardelli et al. 1998), equipartition conditions ( = 1), , and a typical value for , we conclude that the tail must be active for a considerable fraction of the crossing time.
If the above scenario is correct, the reacceleration phase started less than few yrs ago, leading us to the conclusion that this radio halo is young and at the beginning of a reacceleration.
5 Conclusions
In this paper we present a thorough multifrequency study of the radio halo, located at the centre of the merging cluster of galaxies A3562, and of the head–tail radio galaxy J1333–3141. Our results can be summarised as follows:
– the halo has a steep spectrum, with , an equipartition magnetic field BG and internal energy u erg cm-3;
– its size and radio power at 1.4 GHz are amongst the lowest found for this class of sources and they nicely fit the correlations with other cluster parameters (such as bolometric X–ray luminosity and temperature) found in the literature, extending them to lower values for all quantities involved (Feretti 2000; Govoni et al. 2001a);
– the total number of electrons injected in the central region of the cluster by the head–tail radio galaxy J1333–3141 are enough to feed the radio halo if we assume that the galaxy has been radio active over a considerable fraction of its crossing time (t yrs);
– in the framework of the reacceleration models, the scenario in A3562 could be due either to a modest reacceleration phase, or to an initial stage of an energetic reacceleration process. The connection between the radio halo and J1333–3141 might suggest that this second possibility is best matched to the observations. However very low frequency radio observations are necessary to discriminate between the two possibilities.
Acknowledgements.
The authors wish to thank the referee, Dr. T. Enßlin, for fruitful comments. Thanks are due to Dr. M. Murgia for insightful discussion and help in running the program Synage. G.B. acknowledges financial support by CNR, under grant CNRG00CF0A. This work has been partially supported by the Italian Space Agency grants ASI-I-R-105-00 and ASI-I-R-037-01, and by the Italian Ministery (MIUR) grant COFIN2001 “Clusters and groups of galaxies: the interplay between dark and baryonic matter”. NRAO is a facility of the National Science Foundation, operated under cooperative agreement by Associated Universities, Inc. This work has made use of the NASA/IPAC Extragalactic Database NED which is operated by the JPL, California Institute of Technology, under contract with the National Aeronautics and Space Administration.References
- (1) Bardelli, S., Zucca, e., Malizia, A., Zamorani, G., Vettolani, G., Scaramella, R., 1996, A&A, 305, 435
- (2) Bardelli, S., Zucca, E., Zamorani, G., Vettolani, G., Scaramella, R., 1998, MNRAS, 296, 599
- (3) Bacchi, M., Feretti, L., Giovannini, G., Govoni, F., 2003, A&A, in press (astro–ph/0301206)
- (4) Böhringer, H., Schuecker, P., 2002, in Merging Processes in Galaxy Clusters, Eds. L. Feretti, I.M. Gioia & G. Giovannini, ASSL Serie, Kluwer Acad. Publ., 133
- (5) Brunetti, G., in The Role of VLBI in Astrophysics, Astrometry and Geodesy, NATO–ASI Ser., Ed. F. Mantovani, 2002, in press (astro–ph/0207671)
- (6) Brunetti, G., Setti, G., Feretti, L., Giovannini, G., 2001, MNRAS, 320, 365
- (7) Buote, D.A., 2001, ApJ, 553, L15
- (8) Colafrancesco, S., 1999, in Diffuse Thermal and Relativistic Plasma in Galaxy Clusters, Eds. H. Böhringer, L. Feretti & P. Schuecker, MPE Report 271, p. 269
- (9) Enßlin, T.A., Röttgering, H., 2002, A&A, 396, 83
- (10) Ettori, S., Fabian, A.C., White, D.A., 1997, MNRAS, 289, 787
- (11) Ettori, S., Bardelli, S., De Grandi, S., Molendi, S., Zamorani, G., Zucca, E., 2000, MNRAS, 318, 239
- (12) Feretti, L., 2000, in The Universe at Low Radio Frequencies, IAU Symp. 199, Eds. P. Rao, in press (astro–ph/0006379)
- (13) Feretti, L., Dallacasa D., Giovannini, G., Venturi, T., 1990, A&A, 232, 337
- (14) Feretti, L., Giovannini, G., 1996, in Extragalactic Radio Sources, IAU Symp. 175, Eds. R.D. Ekers, C. Fanti & L. Padrielli, Kluwer Academic Publ., p. 333
- (15) Gabici, S., Blasi, P., 2002, ApJ, in press, ApJ preprint doi:10.1086/345429
- (16) Giovannini, G., Tordi, M., Feretti, L., 1999, New Astr., 4, 141
- (17) Giovannini, G., Feretti, L., 2000, New Astron., 5, 335
- (18) Giovannini, G., Feretti, L., 2002, in Merging Processes in Galaxy Clusters, Eds. L. Feretti, I.M. Gioia & G. Giovannini, ASSL Serie, Kluwer Acad. Publ., p. 197
- (19) Govoni, F., Feretti, L., Giovannini, G., Böhringer, H., Reiprich, T.H., Murgia, M., 2001a, A&A, 376, 803
- (20) Govoni, F., Enßlin, T.A., Feretti, L., Giovannini, G., 2001b, A&A 369, 441
- (21) Jaffe, W.J., Perola, G.C., 1974, A&A 31, 223
- (22) Liang, H., Hunstead, R.W., Birkinshaw, M., Andreani, P., 2000, ApJ, 544, 686
- (23) Murgia, M., 2001, PhD Thesis, University of Bologna
- (24) Ohno, H., Takizawa, M., Shibata, S., 2002, ApJ, 577, 658
- (25) Peres, C.B. Fabian, A.C., Edge, A.C., Allen, S.W., Johnstone, R.M., White, D.A., 1998, MNRAS, 298, 416
- (26) Sarazin, C.L., 1999, ApJ, 520, 529
- (27) Schlickeiser, R., Sievers, A., Thiemann, H., 1987, A&A, 182, 21
- (28) Venturi, T., Bardelli, S., Morganti, R., Hunstead, R.W., 2000, MNRAS, 314, 594 (V2000)
- (29) Venturi, T., Bardelli, S., Dallacasa, D., Giacintucci, S., Hunstead, R.W., Morganti, R., 2003, A&A, to be submitted