Hard X-ray Observations of Magnetic Cataclysmic Variables
Abstract
Hard X-ray light curves and spectral parameters from our analysis of X-ray data of five AM Her type systems – V2301 Oph, V1432 Aql, EP Draconis, GG Leonis, & V834 Cen, and one intermediate polar – TV Col, observed using the satellite are presented. A new improved ephemeris has been derived for V2301 Oph using the mid-eclipse timings. Average intensity variations, without any change of shape of the light curve or hardness ratio, are observed on timescales of a few days to a few months in V2301 Oph. V1432 Aql shows erratic variations on a timescale of a day, at least 2 sharp dips near orbital phases 0.35 and 0.5, and a total eclipse. Hard X-ray eclipses are also reported in EP Dra and GG Leo. V834 Cen shows intensity variations on yearly timescale and is found to be in a low state in 2002. In TV Col, a binary orbital modulation at 5.5h, in addition to the spin period of 1910s, is reported for the first time. Maximum spectral temperatures in Polars have been determined and used to estimate the masses of the white dwarfs.
Tata Institute of Fundamental Research, Homi Bhabha Road, Colaba, Mumbai 400005, INDIA
Space Telescope Science Institute, ESS/Science Software Group, Baltimore, MD 21218, U.S.A.
Harvard-Smithsonian Center for Astrophysics, 60 Garden Street, Cambridge, MA 02138, U.S.A.
1. Introduction
Hard X-ray ( 2 keV) emission from polars is believed to originate from the post-shock region at the base of the accretion column (see Patterson 1994) on the accreting white dwarf. X-ray studies of eclipsing polars are particularly valuable for understanding the geometry of the accretion region, and to learn about the interaction of matter with the magnetic field near the coupling region, the stellar masses, the shock height, and the temperature distribution near the white dwarf surface. A hard X-ray study of polars with large area and broad-band X-ray detectors like the Proportional Counter Array (PCA) on board the () satellite provides an excellent opportunity to learn about these effects and to estimate the mass of the white dwarf by measuring the maximum temperature of the post-shock plasma.
We have analyzed the X-ray data obtained of 5 Polars and 1 Intermediate Polar (IP) as listed in Table 1 along with some of their important properties. The dates of the observations of each source and the mean count rate in the 2–20 keV band are given in Table 2. Most of the observations have the source in the center of the field of view of PCA, except for the 2002 observation of V1432 Aql which is intentionally offset to minimize the contribution of flux from NGC6814.
| Name | Magnitude | Spin Period | Distance | References |
| (Visual) | (seconds) | (pc) | ||
| V2301 Oph | 15–17 | 6780 | 15027 | SRHB, BRB, Hess97, SI, SS |
| V1432 Aql | 14.2–18 | 12150 | 230 | W95, P95, GS |
| EP Dra | 18 | 6276 | 450 | RSTS, S99, SM |
| GG Leo | 16–17 | 4792.767 | 100 | Bur98, Sz00 |
| V834 Cen | 15 | 6090 | 86 | JNJ, M83, B83, C90, S93 |
| TV Col | 14.1 | 1911 | 368 | BDW, H93, A94, R02 |
| Name | Date | Exposure Time | Count Rate | Offset(′) |
| (Y M D) | (seconds) | (2-20 keV) | ||
| V2301 Oph | 1997 05 27-30 | 13200 | 6–16 | 0.06 |
| 1997 09 26-28 | 5700 | 4-21 | 0.06 | |
| 1997 11 22-24 | 39500 | 15-23 | 0.06 | |
| V1432 Aql | 1998 06 23-25 | 16700 | 23-33 | 0.01 |
| 2002 07 14-15 | 19700 | 18-20 | 14.8 | |
| EP Dra | 1998 08 28 | 14303 | 1.2 | 0.1 |
| GG Leo | 1999 05 07 | 4688 | 3.3 | 0.03 |
| V834 Cen | 1996 05 14-18 | 8700 | 5-9 | 0.01 |
| 1997 08 02 | 16256 | 8 | 0.03 | |
| 1998 06 23-25 | 20400 | 9-11 | 0.04 | |
| 2002 01 18, 24 | 18600 | 0.5 | 0.04 | |
| TV Col | 1996 08 09-13 | 82000 | 30-50 | 0.1 |
2. 2-20 keV Light Curves of Polars
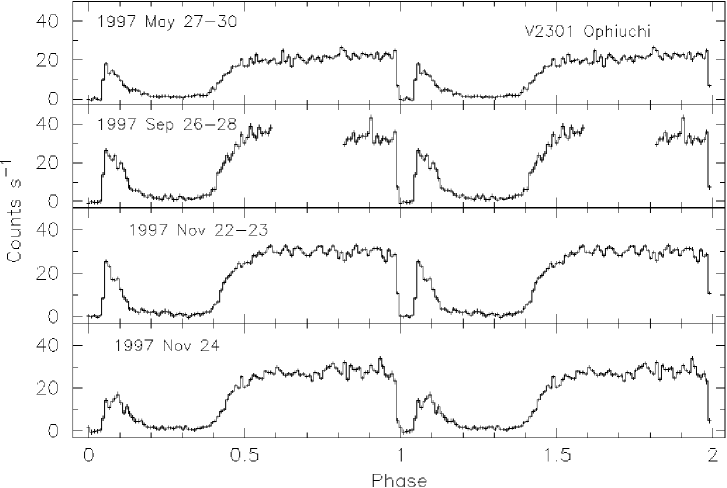
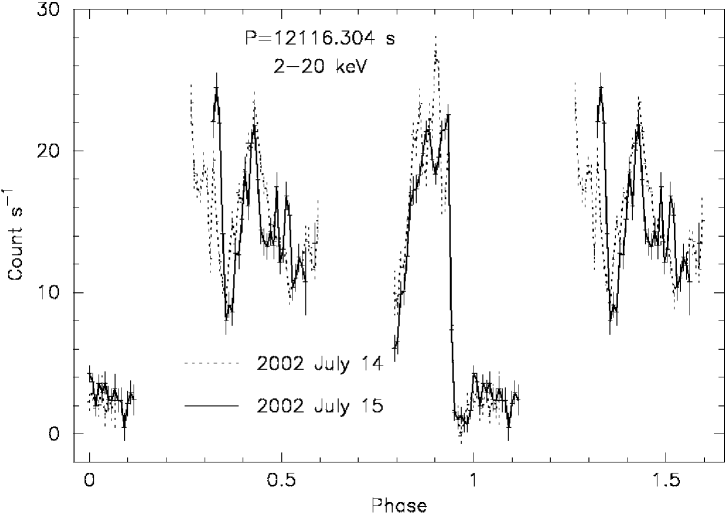
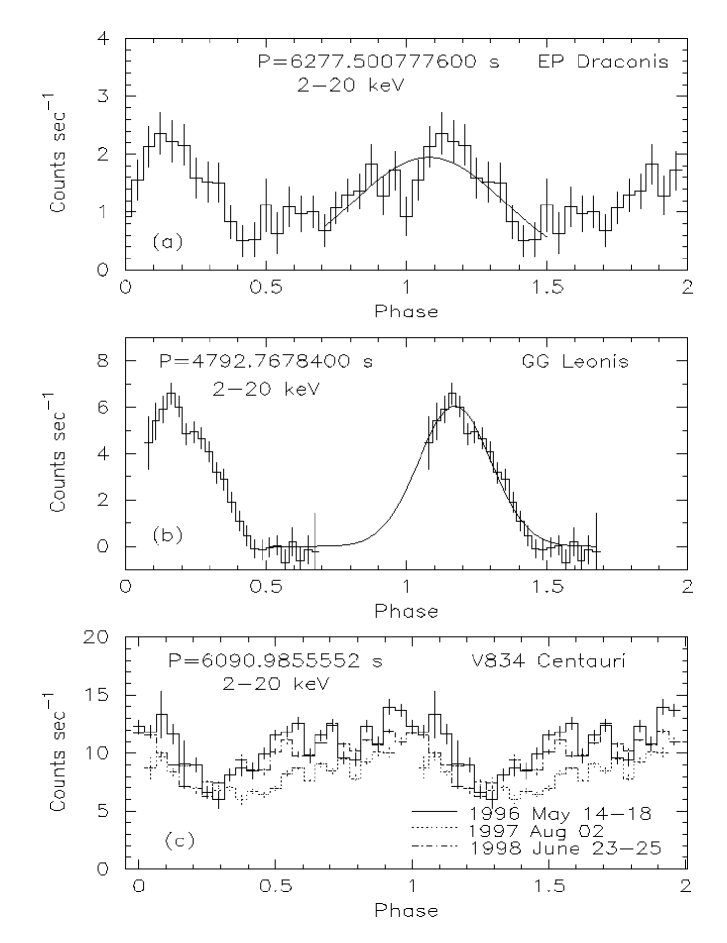
X-ray light curves of V2301 Oph and V1432 Aql in the 2-20 keV energy band are shown in Figures 1 and 2 respectively for each of the long observations. Several total eclipses were seen clearly in V2301 Oph and along with previous observations used to derive an improved ephemeris for the system: HJD = 2448071.02051(2) + 0.0784499794(10)E. The out-of-eclipse intensity of V 2301 Oph changes on daily and monthly timescales, while the light curve shape and the eclipse ingress and egress remain unchanged (see Fig. 1). The spectral hardness ratio is, however, found to remain constant throughout. These intensity variations, therefore, lead to luminosity variations and suggest that the mass accretion rate varies on these timescales. V1432 Aql also shows complete eclipses (the small residual amount 10% of the peak is due to contamination by NGC 6814) in both the observations shown in Fig. 2. Several dips are seen between the phases 0.35 to 0.52, and rapid flickering is observed near the maximum in the highly complicated light curve of V1432 Aql. Total eclipses have also been observed in the 2–20 keV light curves of EP Dra and GG Leo shown in Fig. 3. The residual count rate in EP Dra is fully accounted for by contribution from a nearby (8.3′away) cluster of galaxies A2317. V834 Cen shows yearly intensity variations (Fig. 3) with changing maximum intensity as a function of phase while the minimum intensity remains the same. It was not detectable in 2002, and therefore, presumed to have a entered a very low state.
3. TV Col: Spin and Orbital Periods
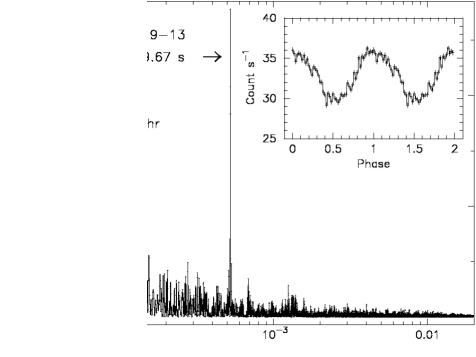
A 5 day long X-ray observation of an intermediate polar, TV Col, is reported here for the first time. The power spectral distribution of its light curve obtained by using the CLEAN (see Norton, Beardmore & Taylor 1996) method and thus removing the window function, is shown in Fig. 4. It clearly displays the presence of a sinusoidal oscillation (spin period) at 1910s and that of modulation due to orbital period of 5.5h. Several other peaks due to various harmonics and side bands of the spin, orbital period and the precession period of 4d (see Norton et al. 1996; Retter et al. 2002) are also seen. In particular, power is detected at side-band frequencies corresponding to periods of 5.2h, 5.8h, and 6.2h (or beats between the orbital and precession period).
4. X-ray Spectra of Polars
The hard X-ray emission is believed to originate from the hot gas in the post-shock region gradually cooling and settling on to the white dwarf. It is, therefore, expected that the post-shock region should have a temperature gradient with a low temperature at the bottom of the accretion column and high near the shock front, and a continuous temperature distribution in between. Multi-temperature plasma models are therefore required to quantify the temperature distribution and line emission (Done, Osborne & Beardmore 1995). In addition, the pre-shock material is exposed to hard X-rays thus ionizing it, which can give rise to complex absorption effects. A considerable fraction of hard X-rays from the post-shock region, can also be reflected by the white dwarf surface. Hence, it is important to take into account all the above processes while characterizing the X-ray emission. Several spectral models ranging from the simple thermal bremsstrahlung to plasma emission models with continuous emission measure (cevmekl), and cooling flow were used to fit the X-ray spectra. The best fit spectral parameters derived from two models : thermal bremsstrahlung plus absorption, and cevmekl with ionised absorber and reflection are shown in Table 3. The 2–10 keV flux values given in Table 3 are in units of 10-11 ergs cm-2 s-1. The errors and the range of values for the parameters listed in the table are with 90% confidence. The thermal bremsstrahlung models always required the presence of an emission line component (a broad Gaussian) with the line energy indicating the dominance of the plasma emission from Fe XV or FeXVI over fluorescence of cold Fe. The cevmekl models describe the physical situation much better. These models indicate subsolar abundance for Fe and provide a maximum temperature that is somewhat lower than that derived from the simple bremsstrahlung models (Table 3). The best fit maximum temperatures from Model 2 were used to estimate the mass of the white dwarf in these systems. The estimated masses (Table 3) are consistent, within errors, with the previous estimates given by Ramsay (1997) using a more realistic spectral model.
| Model 1 | Model 2 | ||||||
|---|---|---|---|---|---|---|---|
| Name | kTbrem | EFe | kTmax | NH(warm) | AFe | Fluxa | MWD |
| keV | keV | keV | 1022cm-2 | Relative | M | ||
| V2301 Oph | 12-15 | 6.5-6.8 | 10-20 | 1.5-3.2 | 0.11-0.28 | 3.30 | 0.90 |
| V1432 Aql | 50-75 | 6.4-6.6 | 12-18 | 2.4-3.5 | 0.17-0.31 | 4.00 | 0.90 |
| EP Dra | 5-9 | 6.5-7.1 | 10 | 1.1 | 0.3-1.4 | 0.32 | 0.75 |
| GG Leo | 38 | 6.4-7.0 | 22 | 5.0 | 0.15-0.45 | 0.84 | 1.1 |
| V834 Cen | 11 | 6.6-7.0 | 8.5 | 1.5-3.8 | 0.20-0.67 | 1.66 | 0.70 |
References
Augusteijn, T., Heemskerk, M.H.M., Zwarthoed, G.A.A., & van Paradijs, J. 1994, A&AS, 107, 219 (A94)
Bailey, J., Axon, D. J., Hough, J. H., Watts, D. J., Giles, A. B., & Greenhill J. G., 1983, MNRAS, 205, 1P (B83)
Barrett, P., O’Donoghue, D., & Warner, B. 1988, MNRAS, 233, 759 (BDW)
Barwig, H., Ritter, H., & Brnbantner, O., 1994, A&A, 288, 204 (BRB)
Burwitz, V., Reinsch, K., Schwope, A. D., et al., 1998, A&A, 331, 262 (Bur98)
Cropper, M., 1990, Space Sci.Rev., 54, 195 (C90)
Done, C., Osborne, J. P., & Beardmore, A. P., 1995, MNRAS, 276, 483.
Geckeler, R. D. & Staubert, R., 1997, å, 325, 1070 (GS)
Hellier, Coel, 1993, MNRAS, 264, 132 (H93)
Hessman, F. V., Beuermann, K., Burwitz, V., de Martino, D., & Thomas, H. C., 1997, A&A, 327, 245 (Hess97)
Jensen, K. A., Nousek, J. A., & Nugent, J. J., 1982, ApJ, 261, 625 (JNJ)
Mason, K., O., Middleditch, J., Cordova, F., A., et al., 1983, ApJ, 264, 575 (M83)
Norton, A. J., Beardmore, A. P. & Taylor, P., 1996, MNRAS, 280, 937
Patterson, J., 1994, PASP, 107, 307
Patterson, J., Skillman, D. R., Thorstensen, J. & Hellier, C., 1995, PASP, 107, 307 (P95)
Ramsay, G., 1997, MNRAS, 290, 99
Remillard, R. A., Stroozas, B. A., Tapia, S. & Silber, A., 1991, ApJ, 379, 715 (RSTS)
Retter, A., Hellier, C., Augusteijn, T., Naylor, T., et al., 2002, MNRAS, in press (R02)
Schlegel, E. M., 1999, AJ, 117, 2494 (S99)
Schmidt, G. D., & Stockman, H. S., 2001, ApJ, 548, 410 (SS)
Schwope, A., D., & Mengel, S., 1997, Astron. Nachr., 318, 25 (SM).
Schwope, A., D., Thomas, H., C., Beuermann, K., & Reinsch, K., 1993, A&A, 267, 103 (S93)
Silber, A. D., Remillard, R. A., Horne, K. A. & Bradt, H. V. 1994,ApJ, 424, 955(SRHB)
Steiman-Cameron, T. Y., & Imamura, J. N., 1999, ApJ, 515, 404 (SI)
Szkody, P., Armstrong, J., & Fried, R., 2000, PASP, 112, 228 (Sz00).
Watson, M. G., Rosen, S. R., O’Donoghue, D., et al., 1995, MNRAS, 273, 681. (W95)