Primordial Black Holes as Dark Matter: The Power Spectrum and Evaporation of Early Structures
Abstract
We consider the possibility that massive primordial black holes are the dominant form of dark matter. Black hole formation generates entropy fluctuations that adds a Poisson noise to the matter power spectrum. We use Ly- forest observations to constrain this Poisson term in matter power spectrum, then we constrain the mass of black holes to be less than . We also find that structures with less than primordial black holes evaporate by now.
1 Introduction
The nature of Cold Dark Matter (CDM) is one of the most important and profound mysteries in modern cosmology. One of the clues towards solving this mystery is the fact that Big Bag Nucleosynthesis (BBN) paradigm (e.g., Burles et al. 2001) predicts a much lower density for the baryonic matter (by a factor of ) than almost all the measurements of the CDM density in the last decade (see Bahcall et al. 1999 for a review). Black holes are an alternative to the most popular candidate for the dark matter: massive, non-baryonic, elementary particles (see Khalil & Munoz 2002 for a recent review). If Primordial Black Holes(PBHs), formed in the early universe, they could become the dominant form of dark matter.
There are variety of mechanisms proposed for PBH formation: during inflationary reheating (Garcia-Bellido & Linde 1998), from a blue spectrum of primordial density fluctuations (Carr & Lidsey 1993) or during a phase transition in the early universe (e.g., Rubin et al. 2000). The typical mass of PBHs at the formation time can be as large the mass contained in the Hubble volume, , down to around (Hawke & Stewart 2002). Carr & Hawking (1974) show that there is no physical self-similar growth mode for the PBHs in a radiation gas, and so there will be no significant accretion after PBH formation. However, Bean & Magueijo (2002) speculate that the accretion of quintessence (i.e., a scalar field) into the PBHs could lead to the scaling of the PBH mass with .
In this letter, we consider PBHs with as the constituents of CDM. The dynamical constraints on such objects has been thoroughly reviewed and discussed by Carr & Sakellariadou (1999). They show that the strongest upper limit on the mass of such compact objects in the galactic halo is which comes from two independent methods:(1) the rate of globular cluster disruptions and,(2) the mass of the galactic nucleus, accumulated due to dynamical friction. However, the globular cluster disruption limit depends on the completely unknown initial number of globular clusters, while the galactic nucleus limit ignores black hole ejection through gravitational slingshot which may prevent mass accumulation at the center (Xu & Ostriker 1994). Therefore we will take a more conservative value of as our upper limit. On the lower end, the non-detection of long duration lensing events by the MACHO microlensing experiment excludes the mass range for the halo objects (Alcock et al. 2001). This letter studies the impact of these PBHs on the large scale structure of the universe, and specifically the signatures of discreteness in CDM. In Sec. 2 we study the impact of the Poisson noise due to the discreteness of PBHs on the linear power spectrum. Sec. 3 compares the numerical simulations with this linear power spectrum with the observational data of the Ly- forest power spectrum. This puts an upper limit on the mass of PBHs. In Sec. 4 we discuss the effect of evaporation of early structures, which puts a lower cutoff on the mass function of the PBH haloes. Finally, Sec. 5 concludes the paper.
2 The Linear Spectrum
In the following analysis we assume that PBHs form as the result of a phase transition at some temperature , in the radiation dominated era. Furthermore, we will assume that there is no substantial accretion following their formation era and all of their masses are around . This assumption can be generalized to an extended accretion scenario where marks the end of accretion period (Magueijo and Bean 2002). The black hole density follows
| (1) |
where is the number density of PBHs, is the fluctuation is the number of PBHs due to Poisson noise, and the factor describes the dilution in PBH density due to cosmic expansion. Since the PBHs are not correlated on acausal distances, one expects that on scales larger than the Hubble radius
| (2) |
For linear perturbations, on large scales, Eq.(1) leads to
| (3) |
where the , and are the relative overdensities of PBHs, Poisson fluctuations and radiation, respectively. Since in Eq.(1)is observable and constant, one would conclude that the quantity
| (4) |
is gauge-invariant and conserved. Indeed this is the entropy per PBH, which should remain constant as long as the universe expands adiabatically (e.g. see Mukhanov et al. 1992). The associated perturbations, generated in this way are isocurvature(or entropy) perturbations, as the curvature at large scales is not (immediately) affected by the formation of compact objects at small scale.
As we are assuming that PBHs are the present day Cold Dark Matter (CDM), the overdensity of CDM is given by
| (5) |
where and are the transfer functions for adiabatic and isocurvature perturbations respectively. For the following analysis we will use the analytical fits quoted in Bardeen et al. 1986 to the transfer functions. Eq. (5) leads to the following power spectrum
| (6) |
In this expression, with is the adiabatic power spectrum which is produced through inflation (or an alternative method of generating scale-invariant adiabatic perturbations), while is given in Eq.(2).
One can easily see that the isocurvature term on the RHS of Eq.(2) contributes a constant to the power spectrum as both and
| (7) |
are independent of (e.g. Peacock 1998). Note that this is the simple linear growth due to gravitational clustering which is the same for adiabatic fluctuation. Since the power spectrum of adiabatic fluctuations decays as at small scales, one expects to see the signature of this Poisson noise at large ’s. Combining Eqs. (2),(6) and (7) gives the power offset
| (8) | |||||
which is also a lower bound on the matter linear power spectrum.

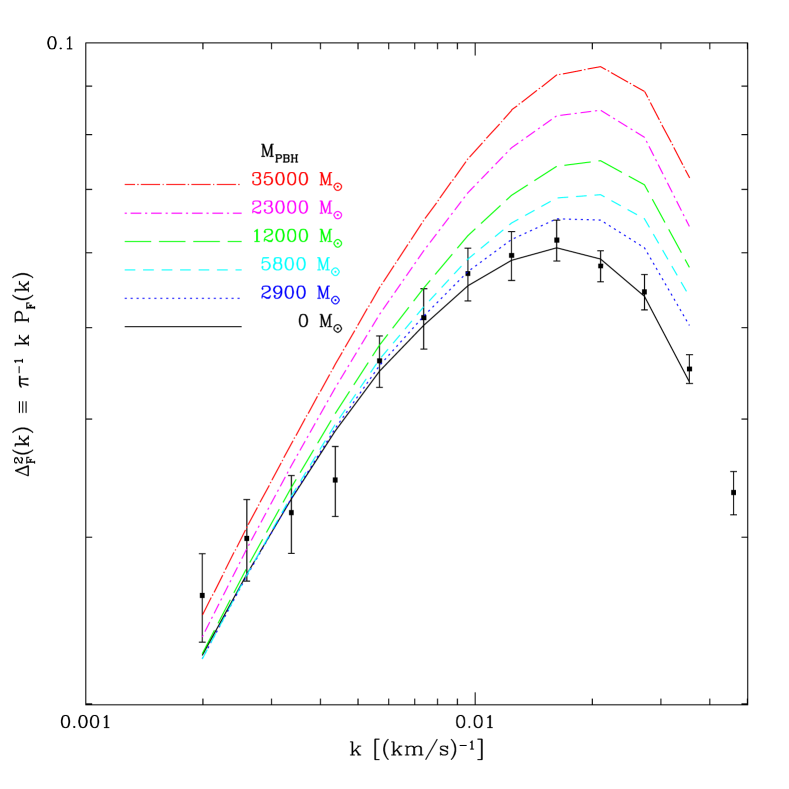
Fig.(1) shows the linear power spectrum for different masses of the PBHs. We see the Poisson plateau (Eq. 8) at large k’s which drops with decreasing mass. The impact of this plateau on the Ly- forest power spectrum is discussed in the next section.
3 Simulations of Ly- forest
The lines in Fig. (2) show the predicted change in the power spectrum of the Ly- forest transmitted flux, , as is varied. The points with error bars are measured by Croft et al. (2002) using their fiducial sample (). The predictions were made using the large set of numerical simulations and the interpolation code described in McDonald et al. (2003). We have not yet performed fully hydrodynamic simulations using PBH power spectra, so our result is based entirely on hydro-PM simulations (e.g., Gnedin & Hui 1998; McDonald, Miralda-Escudé, & Cen 2002; McDonald 2003). The curves we show are smooth because the power spectra computed from the simulations have been compressed into the parameters of an analytic fitting formula. The background cosmological model used in Fig. (2) is assumed to be flat with a cosmological constant, , , , and (this value of is close to the best fit found by Croft et al. 2002 for our model). The Ly- forest model assumed in the simulation is controlled by 3 parameters: the mean transmitted flux fraction in the forest, , and the parameters, and , of a power-law temperature-density relation for the gas in the IGM, , where is the density of the gas in units of the mean density (see McDonald 2003 for a demonstration of the effects of these parameters on the flux power spectrum). The allowed range of each of these parameters has been constrained by independent observations. We use the measurement from McDonald et al. (2000) and the measurements K and from McDonald et al. (2001). To obtain these values at , we interpolated between the redshift bins used by McDonald et al. (2000, 2001). We subtracted 50% of the potential continuum fitting bias they discuss from , and add the same number in quadrature to their error on . We add 2000 K in quadrature to the error bars on to help absorb any systematic errors. To produce Fig. (2), we fixed these Ly- forest parameters to their measured values, and fixed the normalization of the initially adiabatic component of the linear power spectrum, , to the value that gives the best fit when . It is not surprising to see that the Ly- forest power increases dramatically as the white noise power from the PBHs becomes significant on the observed scales.
Fig. (2) is not sufficient to place constraints on because we have not varied any of the other parameters to see if the predicted power can be adjusted to match the observations. To obtain an upper limit on the PBH mass we compute , minimizing over the amplitude of the linear power and the three Ly- forest parameters, subject to the observational constraints described above on , , and . We follow Croft et al. (2002) in using only points with s/km. Defining an upper limit by , we find . Fig. (3) shows how this limit is obtained. The temperature-density relation parameters play no role, but is important. As increases, the best fit value of also increases until this trend is halted by the external constraint on . The effect of the increase in is to reduce (McDonald 2003), counteracting the increase in power due to . Finally, the unconstrained parameter also increases with , further decreasing the power on small scales while increasing on large scales (see McDonald 2003; this freedom to adjust the tilt of is significant – with fixed we find ).
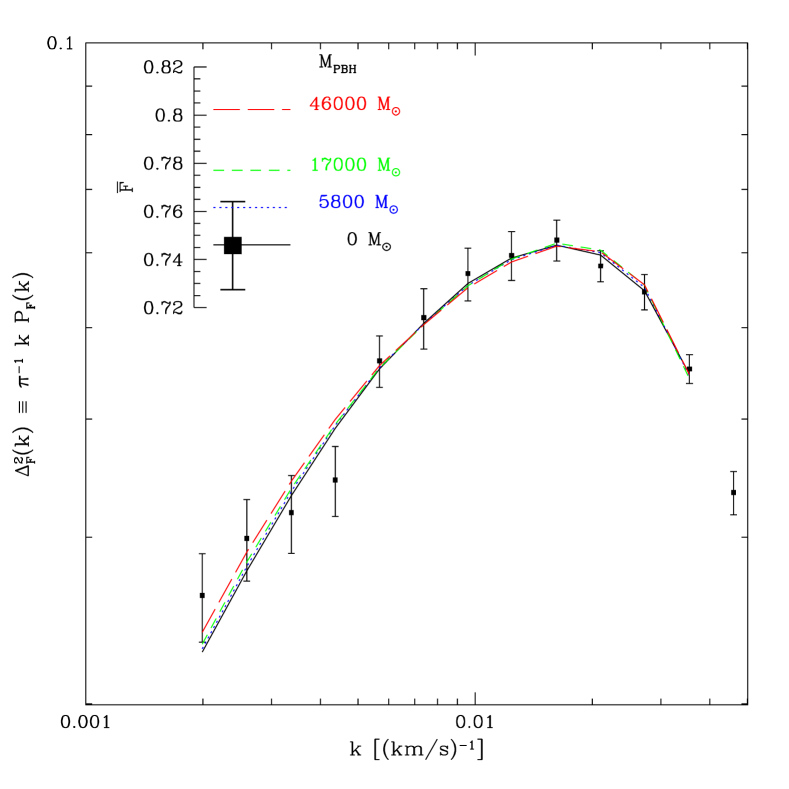
Fig. (3) may at first appear unconvincing to the reader unfamiliar with the Ly- forest; however, the result is ultimately simple to understand. In Fig. (1) we see that the white noise power begins to dominate on the scales to which the Ly- forest is sensitive when (note that 1 comoving Mpc/h = 108 km/s at in our model). As increases there is simply too much power on the scale of the Ly- forest to produce the observed level of fluctuations. Increasing can cancel some of the effect but the size of the increase is limited because is directly observable.
A factor of relaxation in the upper bound seems unlikely but not inconceivable. For example, if we arbitrarily increase the error bar on to , the limit we derive is . The limit is if we arbitrarily decrease the predicted by 10% for all models. The assumed value of has no effect on the result (we obtain using ). Finally, we remind the reader that the Ly- forest only constrains the power spectrum in km/s units at . Equation (8) and our assumed cosmological model were used to compute .
4 Early Structures and Relaxation Effects
So, apart from the Poisson noise, is there any difference between the gravitational clustering of the conventional CDM (WIMP particles) and PBHs? The answer is yes. The collisional relaxation time for a gravitational system is of the order of the number of particles, times the dynamical time of the system. Therefore, one expects the relaxation related effects, e.g. evaporation and core collapse, to happen faster for systems with smaller number of particles. As the structures form bottom-up in a hierarchical structure formation scenario (and even more so in the presence of PBHs as the spectrum is bluer), and the dynamical time for cosmological haloes is of the order of the age of the universe, such effects may be important only for the first structures, that form right after the recombination era, which have the smallest number of PBHs.
Let us make a simple estimate of how evaporation of early structures sets a lower limit on the mass of virialized objects. The evaporation time of an isolated cluster can be estimated using
| (9) |
(see Binney & Tremaine 1987), where the subscripts, ”” and ”” refer to the characteristic times, subsequently associated with the evaporation and relaxation of the structure, while and are the number of particles and the median radius, respectively. To relate to the formation time, for simplicity, we consider a truncated singular isothermal sphere which within the spherical collapse model (e.g., Afshordi & Cen 2002) yields
| (10) |
where is the formation time of the object. Combining this with Eq.(9) gives
| (11) |
The next assumption is that the approximate formation time of the structure is when the variance of fluctuations at the mass scale of the structure is around the critical overdensity in the spherical collapse model, (Gunn & Gott 1972),
| (12) |
Based on the calculations of Sec. 2, , which is dominated by the Poisson noise at the small scales, is given by
| (13) |
neglecting a late time cosmological constant which is not important at the formation time of the early structures. Now, combining Eqs.(11-13) with
| (14) |
for a flat universe, gives the minimum mass for the structure not to evaporate
| (15) | |||||
and consequently, the structures with should evaporate by redshift .
This calculation may be an underestimate of since Eq.(9) is valid for an isolated object and ignores tidal effects. In general, tidal stripping can decrease significantly (by a factor of 5-10). However, accretion, on the other hand, can slow down the net mass loss rate of the structure and hence has a reverse effect. In reality, the exact lower limit will probably depend on the environment of the structures.
5 Conclusions
We have studied the possibility of having CDM in the form of PBHs (or any other massive compact object) and its impact on the large scale structure of the universe. We see that the simple Poisson noise, enhanced by gravitational clustering in the matter dominated era, leads to a plateau in the power spectrum at large wave numbers (see Fig. 1). Comparison of numerical simulations of Ly- forest with the current observational data rules out the PBH masses larger than . The discrete nature of the PBHs can also lead to the evaporation of small (early) structures. A simple estimate shows that this puts a lower limit of about on the mass of small structures.
References
- (1) Afshordi, N., & Cen, R. 2002, ApJ 564, 669.
- (2) Bahcall, N.A., Ostriker, J.P., Perlmutter, S., and Steinhardt, P.J. 1999, Science, 214, 1481.
- (3) Bardeen, J. M., Bond, J.R., Kaiser, N., & Szalay, A.S. 1986, ApJ, 304, 15.
- (4) Bean, R., & Magueijo, J. 2002,Phys.Rev. D66, 063505.
- (5) Binney, J., & Tremaine, S 1987, Galactic Dynamics, Princeton University Press.
- (6) Burles, S., Nollett, K.M., & Turner, M.S. 2001, ApJL 552, L1.
- (7) Carr, B.J., & Hawking, S.W. 1974, MNRAS, 168, 399.
- (8) Carr, B.J.,& Lidsey,J.E. 1993, Phys. Rev. D48, 543C.
- (9) Carr, B.J.,& Sakellariadou, M. 1999, ApJ, 516, 195.
- (10) Croft, R. A. C., Weinberg, D. H., Bolte, M., Burles, S., Hernquist, L., Katz, N., Kirkman, D., & Tytler, D. 2002, ApJ, 581, 20.
- (11) Garcia-Bellido, J., & Linde, A. 1998, Phys. Rev. D57, 6075G .
- (12) Gnedin, N. Y. & Hui, L. 1998, MNRAS, 296, 44.
- (13) Gunn, J.E. & Gott, J.R. 1972, ApJ 176, 1.
- (14) Hawke, I., & Stewart, J.M. 2002, Class. Quant. Grav., 19, 3687.
- (15) Khalil, S., & Munoz, C. 2002, Contemp.Phys. 43, 51.
- (16) Peacock, J.A. 1998, Cosmological Physics, Cambridge University Press.
- (17)
- (18) McDonald, P. 2003, ApJ, in press (astro-ph/010806)
- (19) McDonald, P., Miralda-Escudé, J., & Cen, R. 2002, ApJ, ApJ, 580, 42.
- (20) McDonald, P., Miralda-Escudé, J., Rauch, M., Sargent, W. L. W., Barlow, T. A., Cen, R., & Ostriker, J. P. 2000, ApJ, 543, 1.
- (21) McDonald, P., Miralda-Escudé, J., Rauch, M., Sargent, W. L. W., Barlow, T. A., & Cen, R. 2001, ApJ, 562, 52.
- (22)
- (23) McDonald, P., et al. 2003, in preparation
- (24)
- (25) Mukhanov, V.F., Feldman, H.A, & Brandenberger, R.H. 1992, Phys. Rep. 215, 203.
- (26) Rubin, S.G., Khlopov, M.Yu., & Sakharov, A.S. 2000, Grav.Cosmol. S6, 1.
- (27) Xu, G.& Ostriker, J.P. 1994, ApJ 437, 184.