The Visibility of Shell-Type Supernova Remnants in Gamma Rays
A.D. Erlykina,b and A.W. Wolfendaleb
a Lebedev Physical Institute, Leninsky Prospekt, Moscow, Russia
b Department of Physics, University of Durham, DH1 3LE, UK
Abstract
The question of the origin of the cosmic radiation (CR) is a continuing one. The idea that the shocks from supernova remnants (SNR) expanding into the interstellar medium (ISM) accelerate CR is still a popular one but a number of authors have drawn attention to the fact that the experimental evidence for the presence of gamma rays from the expected interaction of CR with gas in the remnant is poor. Indeed, it is claimed that many SNR are not ‘seen’ in GeV or TeV gamma rays, whereas ‘they should have been’.
We have looked at this problem and we conclude that the idea of CR production in SNR cannot be faulted in this way, if the evacuation of ambient gas by the stellar wind of the progenitor star and, frequently, by associated earlier close-by SN, is taken into account; such phenomena are expected for the important Type II SN which result from very massive stars and which provide the SNR which are thought to accelerate CR.
Other SNR have, apparently, been seen and the interaction of SNR-accelerated particles with adjacent molecular clouds has been deemed responsible. However, we worry about this interpretation because of the slow progress of the SNR shock through such clouds, although electron-effects may, indeed, contribute.
This paper is devoted mainly to the visibility of nearby ( within about 1 kpc ) SNR in gamma rays although many of the arguments also relate to remote SNR. For the nearby SNR another problem enters the scene: the large angular spread of the remnant. It is especially important for the old SNR, where cosmic rays have already diffused to a large distance from the SNR center. We have also examined the effect of the ’anomalous diffusion’ of CR propagation in the non-homogeneous interstellar medium on the visibility of SNR for gamma rays of different energies.
1 Introduction
The idea that CR of energy up to the ‘knee’ in the spectrum (at PeV) are produced by SNR shocks is well known and there is considerable literature on the subject. We ourselves have taken these models and examined a number of CR ‘results’ (anisotropy, mass composition, spectral variations, etc.) and found a satisfactory outcome. However, others (e.g. Plaga (2001), Pohl (2001), Torres et al. (2002), Völk (2002) ) have drawn attention to the lack of a gamma ray signal from many known SNR, the gamma rays being expected to arise from CR interactions with the gas ( and the radiation field ) in the SNR. The interactions are bremsstrahlung and inverse compton scattering ( IC ) for electrons and pion production for protons and heavier nuclei. Clearly this is an unsatisfactory situation and one needing an in-depth examination.
The question of the relative contributions to the gamma ray flux from protons ( nuclei ) via -decay and electrons is one that pervades the subject. At ‘low’ energies ( eg. 0.1 GeV ) it is generally regarded that in the diffuse gamma ray flux, at least, only some 20% comes from electrons ( see Ramana Murthy and Wolfendale, 1993 for a summary of the estimates of their quantity ).
In the TeV region the answer is less clear cut insofar as many workers
have argued that the IC contribution may surpass that from
-decay. Two points are relevant here:
(i) In one sense, the IC contribution is not important if, as is the
case here, our goal is to examine the argument that ‘lack of observation
of TeV gamma rays shows that CR in general are not produced by the
objects in question: SNR’. This is the argument that is adopted
here.
(ii) In fact, there are some who argue that for some sources at least,
IC from electrons is not important. Berezhko et al. ( 2001, 2003 ) adopt
this position; for their models of SNR 1006 and CasA, they find that
IC provides
only 30% and 1%, respectively of the total flux of gamma rays at 1 TeV.
These two points allow us to ignore the IC contribution, although we mention its effect further when considering the TeV gamma ray results for the SN just mentioned in §5.3.1.
Gamma-ray production in shell-type SNR has been widely discussed and an extended list of references can be found in Torres et al. (2002). The form of our examination here is, in part, as follows:
-
(i)
We derive the expected proton intensity vs. distance from the SNR and the gamma ray intensity vs. angle from an SNR for two energy thresholds: 0.1 GeV and 1 TeV. The derivations are for ‘standard’ conditions of ISM density, shock strength, etc., and they relate to different distances and to different ages of SNR.
-
(ii)
The experimental situation is briefly examined, from the standpoint of the searches made and the fluxes, and upper limits, recorded.
-
(iii)
A detailed study is made of the likely conditions in the actual ISM, not least the density of the target ISM and thereby the predicted fluxes for the two energy thresholds and the various distances and ages. The effects of the non-homogeneous structure of the ISM and the presence of molecular clouds are also studied.
-
(iv)
A comparison of ‘observed and expected’ fluxes is given.
-
(v)
The conclusion draws the strands together.
In another paper we examine the situation for gamma rays from our proposed ’single source’ ( see, for example, Erlykin and Wolfendale, 1997 ).
It will be apparent that the present work includes new features, not previously considered, at least in the manner whereby we endeavour to use actual Galactic properties - most notably those of the gas in the ISM and the way in which particles propagate.
2 The expected gamma ray signal from SNR, for ‘standard conditions’
Our intention is not to examine the precise theoretical model of the SN explosion and development of the SNR and the consequent particle acceleration, which has been the subject of much work by others, but rather to draw a simple scenario, which nevertheless satisfies the basic physical principles and energy requirements. Where there is a new analysis is in the case of diffusion of the particles after leaving the remnant, where ‘anomalous diffusion’ is considered as a variant.
2.1 The acceleration model
We follow our model enunciated in Erlykin and Wolfendale ( referred to henceforth as EW ) (2001). In it we use the treatment of Axford (1981), complemented by the numerical calculations of Berezhko (1999), in which the SNR shock propagates through the tenuous hot ISM with density ( a more recent estimate is , Ferrière, 2001 ). We have chosen these conditions because we are interested in the nearby SNR and they correspond to the conditions in our local superbubble. In fact, the effect of the ISM density in the calculation of the proton distribution is not too important insofar as we standardise the spectra to correspond to a fixed total CR energy. In what follows we give some details about the model only insofar as some features of the predicted gamma ray yield are sensitive to it.
With the density indicated the radius of the shock wave, , is given by
| (1) |
where pc and y.
In fact, the exponent ( 0.5 ) differs from the conventional value, 0.4, for the Sedov region; one reason has been given by Berezhko, ( 1999 ) and is related to the effect of cosmic ray pressure. Interestingly, Moffett et al., ( 1993 ) quote 0.48 from direct measurements for SN 1006. In any event, the exact value is not very important for the reason given above, viz. energy normalization is applied.
A similar remark can be made about the fact that depends on density whereas in what follows we disregard this dependence. The logic is in part the energy argument just referred to and in part the fact that the operative parameter is the time spent in the remnant before the ‘bubble bursts’, i.e. the energy density falls to roughly the ambient value. There are compensating factors which make this time only weakly dependent on gas density, at least for the range of densities considered here.
Particles are accelerated such that the CR energy density is related to the time from the SN explosion by
| (2) |
being the Mach number, which, following (1), decreases with time as
| (3) |
At each moment the cosmic rays are produced with a power-law rigidity spectrum in the rigidity interval – GV (Berezhko et al., 1996). The spectral exponent at time is given by
| (4) |
It is assumed that CR take, finally, erg, i.e. 10% of the available kinetic energy. The remnant is assumed to ‘release’ the particles at a radius of pc at a time y. In the initial calculations the particles were assumed to be protons in this stylised model, although later we included other nuclei. It can be added that adiabatic losses are ‘allowed for’ by taking a specific value for the final CR energy on emergence from the remnant.
2.2 Particle propagation within and beyond the remnant
2.2.1 Within the remnant
It is assumed that the particles diffuse rapidly after acceleration so that they fill the remnant uniformly and the intensity is thus independent of radius at any instant. The argument is that, despite the mean free path for scattering at GeV energies being very short—and thus one might expect a concentration of such particles near the centre of the remnant—turbulence will cause mixing.
2.2.2 Outside the remnant
The particles emerging from the remnant will diffuse away and the majority will eventually escape from the Galaxy. Their intensity versus distance is an important datum for two reasons:
-
(i)
There will be a ‘halo’ of gamma rays round the SNR, and some, at least, of these gamma rays will often count as having come from the SNR.
-
(ii)
In the analysis of gamma rays expected from our Single Source ( the nearby SNR ) it is those particles which have diffused from this SNR, that give the ‘peak’, which causes the knee in the primary energy spectrum. This is the point that Bhadra ( 2002 ) has addressed in his analysis of the extent to which the gamma ray signal from our Single Source might be expected to have been observed.
Calculations have been made for two modes of propagation of the CR particles: the ‘normal’, gaussian form and that for ‘anomalous diffusion’. In the latter analysis we follow the work of Lagutin et al. (2001a,b), Erlykin et al. (2003) and EW (2002a)). Arguments in favour of anomalous diffusion have been advanced by Erlykin et al. (2003) and are mainly the following:
-
(i)
the spatial distribution of matter, magnetic and radiation fields in the ISM is highly irregular and non-homogeneous;
-
(ii)
in many cases the spectra of the irregularities have a power-law character, which favours the fractal structure of the ISM;
-
(iii)
anomalous diffusion in the fractal ISM allows an understanding of a number of observed effects, including: the so-called ‘GeV-excess’ of gamma rays in the Inner Galaxy, the small radial gradient of low energy cosmic rays, the observation of a Galactic Plane Enhancement in the Outer Galaxy at energies about GeV and the softer energy spectrum of cosmic rays in the galactic halo.
Using the nomenclature of Lagutin at al.,( 2001a,b ) the mode of propagation is characterised by a parameter ‘’, where for normal ‘gaussian’ diffusion and takes smaller values for anomalous diffusion. We have made the case in EW (2002a) for locally. The extent to which the remnant itself affects the mode of propagation just outside the remnant will be considered later.
The difference between the two modes appears in the shape of the lateral distribution function for the cosmic ray intensity: for and for , with , being the distance from the radius pc where the particles start to diffuse and being the diffusion radius which is defined as , i.e., there is a different time dependence for the two modes. kpc ( as assumed previously ) for the vertical scale of the galactic halo, and and are the diffusion time and proton lifetime against escape, respectively. Clearly, the distribution function for the anomalous diffusion case falls off much more slowly than for the gaussian, at large x.
In the calculations we again follow EW (2001) and adopt
| (5) |
Here, and below, is in GeV.
Since the scattering on magnetic irregularities has a predominantly resonant character, i.e., it is most efficient for particles with giroradius equal to the size of the irregularity ( Berezinsky et al. 1984, Longair, 1992 ), then the exponent is connected with as
| (6) |
(Erlykin et al., 2003). We have, however, adopted for both modes to reveal the difference between them due to the first two factors: the diffusion front shape and the time dependence of the diffusion radius.
We illustrate the difference between the two modes of propagation by two Figures. Figure 1 shows the results for the time dependence of the cosmic ray energy density at different distances from the SNR center.

The higher energy density for the ‘normal’ diffusion at distances larger than 100 pc from the SNR centre compared with the ‘anomalous’ one is due to the faster diffusion for at relatively small times after it starts.
Figure 2 shows the lateral distribution functions for the two modes of propagation and for two proton energies. The energies considered are those roughly relevant to the gamma ray energy thresholds: 2 GeV for and 10 TeV for TeV. The difference between the cases of and is seen to be quite marked.

2.3 Gamma Ray Emissivity
2.3.1 -collisions
The emissivity, in terms of number of gamma rays produced above a particular energy, per proton–ISM proton () interaction, and its conversion to emissivity for the ambient CR spectrum, has been given by many authors, following the early work of Stecker (1971).
We derived these values on the basis of the following assumptions:
-
(i)
the gamma quanta come from the decay of ’s;
-
(ii)
the inclusive spectrum of ’s in the C-system of -collisions has the gaussian form , where is the rapidity;
-
(iii)
the partial inelasticity does not depend on the primary energy and is equal to 0.15;
-
(iv)
the total multiplicity of gamma quanta and its density in the central rapidity region is close to those observed in experiments.
The gamma ray multiplicity as a function of the primary proton energy in the energy range – GeV, where protons are accelerated after the SN explosion, is shown in Figure 3a for different energy thresholds of gamma quanta. For GeV the results agree with the total multiplicity and particle density in the central region of rapidity measured in the accelerator UA5 experiment (Alpgard et al., 1982); for TeV they agree with the results of the UA7 experiment (Pare et al., 1990).
The gamma ray emissivity depends on the cosmic ray energy spectrum , the inelastic cross-section for particle collision , and the gamma ray multiplicity , as
| (7) |
The energy spectrum depends in turn on the location and the age of the SNR. As an illustration we show in Figure 3b the time variation of the emissivity for cosmic rays in the center of the SNR. At the end of the expansion at the age of years, when the spectrum inside the SNR has a slope of about 2.15, our values if referred to the energy density contained in the spectrum agree well with the results of Drury et al.,(1994); these results are frequently adopted.

2.3.2 -collisions
For -collisions the cross section in (7) is larger than the corresponding cross-section for -collisions. At the same energy per nucleon the multiplicity of gamma quanta produced by one ‘wounded’, i.e. non-spectator nucleon, is the same as for protons. Hence the total number of gamma quanta produced in a single -collision, , should depend on the number of ‘wounded’ nucleons as .
Since we assume that particles of any charge and mass are accelerated in the same interval of rigidity then if the corresponding spectrum of nuclei in terms of the energy per nucleon has a power law character with differential exponent , it is
| (8) |
In the Glauber geometric approach to the -collision, , therefore
| (9) |
In the important case of cosmic rays emerging at the end of the SNR expansion with the gamma ray emissivity of nuclei is about Z times higher than for protons with the same rigidity. Of course, the CR energy input will be higher for the case where nuclei are concerned.
2.3.3 Inclusion of the other nuclei in CR and the ISM
If it is assumed that the mass composition of cosmic rays produced by SN is similar to that observed near the Earth ( Ito, (1988), Wiebel-Sooth and Biermann, (1999)), then the increase of gamma ray emissivity due to the mixed CR mass composition is about 1.640.03 for sub-GeV energies and 1.970.05 at 10 TeV energy.
In addition to this factor there is also the effect of non-hydrogen nuclei in the ISM. Dodds et al.,(1976) give, as the multiplying factor 1.40. Thus, the increase for all CR-ISM over CR p-H nuclei interactions is 2.300.04 at sub-GeV energies and 2.760.07 at 10 TeV.
2.3.4 Contribution of electrons
Irrespective of arguments about the magnitude of the IC contribution ( §1 ) - and despite the remarks there about the small magnitude of the -bremsstrahlung contribution - we have checked the latter.
A finite electron contribution is expected because shock waves propagating through the hot ISM and plasma accelerate not only protons and nuclei, but also electrons, and we have therefore evaluated the contribution of electrons to the emissivity of gamma quanta. At this stage we took into account only bremsstrahlung because we are interested in the matter effects and the intensity of this process is proportional to the matter density, likewise the intensity of - production. The contribution of synchrotron radiation and inverse Compton scattering requires the introduction of two additional input parameters: the strength of the magnetic and radiation fields. They were accounted for in the total energy losses including ionization using just the parameters typical for the standard ISM: and . The former may be too low in a young remnant.
For the evaluation of electron bremsstrahlung we used the same program, which was developed in EW (2002b), and which let us explain the low ratio and the steeper energy spectrum of electrons, compared with protons, as the consequence of the inefficiency of electron injection for high Mach numbers in SNR shocks. For the calculation of bremsstrahlung we used the classic non-screening cross-section given by Rossi, (1952).
The bremsstrahlung photon emissivity is shown in Figure 3b by dashed lines. The difference in the emissivity between electrons and protons at the initial stages of the SNR development is due to our assumption about the inefficiency of high Mach numbers for electrons, which was absent for protons. It is seen that nearly all the time the contribution of electrons to the gamma-ray emission is negligible compared with protons, so that in what follows we ignore the electron contribution. It should be remarked, however, that there may well be regions where enhanced electron acceleration occurs, perhaps due to non-linear wave generation effects and turbulence in addition to the degree of turbulence adopted here. Such behaviour may be found in highly shocked region of molecular clouds ( eg Bykov et al., 2000 ).
3 Gamma Ray Fluxes, Expected and Measured
3.1 Expected gamma ray fluxes
In Figure 4 we show the total gamma ray flux from a nearby SNR as a function of its age ( for primary CR protons ). The datum matter density everywhere has been taken as 1 H-atom cm-3 ( heavier nuclei in the CR beam and in the ISM are not included ). At the maximum of the emission the fluxes can be approximated as
| (10) |
| (11) |
where is the fraction of the SNR kinetic energy transferred to cosmic rays. The fluxes are a factor of 1.5 for and a factor of 2.6 for lower than those of Drury et al.,(1994) the difference being partly due to the -production model but mainly to the adopted form for the energy spectrum of produced cosmic rays. It is worth remarking that our scenario, originating in the Axford model, has no intrinsic non-linear effects and is based on the energetics of the acceleration process.

After the expansion phase the intensity of cosmic rays decreases in a different way depending on the gamma ray energy and the diffusion mode. The higher energy particles diffuse and escape faster than the low energy ones. For the nearby SNR after a rather short time they reach the Earth and pass it, so that a gamma ray telescope on the Earth cannot see the gamma rays produced by those cosmic rays behind the Earth.
Because normal diffusion is faster at early times than the anomalous one the decrease of the intensity after the end of the expansion at years is much faster for than for .
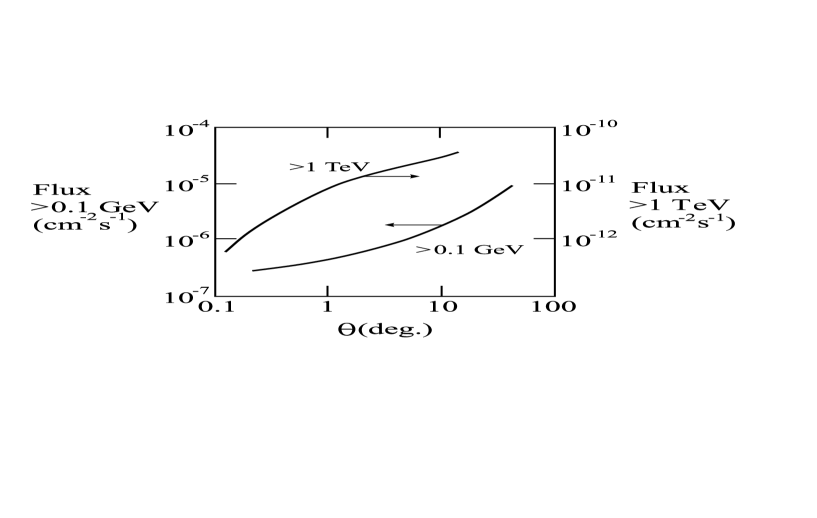
Nearby SNR are expected to give an extended excess of the gamma ray intensity, i.e. extended in angular scale. If the detector has sufficient angular resolution, it can observe the profile of the extended source. In Figures 5 and 6 we give examples of the expected angular profiles for sources of different age developing by anomalous and normal diffusion. It is seen that the profiles are even more sensitive to the energy of the gamma quanta and the diffusion mode than are the total fluxes ( integrated over angle ). The angular sizes of the remnants reach tens of degrees and the usual search technique, based on the comparison of ‘ON’ and ‘OFF’ runs, where both are taken from nearby parts of the sky, is very inefficient in this case. It is interesting to note that, eventually, it should be possible to determine the diffusion ‘law’ by measuring the intensity profile for old SNR.
A point of relevance concerns the premature escape of high energy particles before years is reached. The frequently fragmented nature of SNR makes this a distinct possibility and in consequence the estimated TeV fluxes may be upper limits. However, if, indeed, anomalous diffusion is true the core and halo will be populated by these particles and, for distant SNR at least, the total gamma ray flux will barely change.


3.2 Measured gamma ray fluxes and upper limits
3.2.1 Search for gamma rays with energies above 0.1 GeV
The third EGRET gamma ray source catalogue of Hartman et al. (1999), which relates to ‘sources’ above 0.1 GeV, lists twelve sources which had been identified by Sturner and Dermer (1995) as being possibly associated with SNR. These sources have median fluxes ( the measured flux varied somewhat from one viewing period to another for the same source ) in the range (3-12), with an overall mean flux of .
A later paper by Sturner et al. (1996) has reduced the number to five high confidence coincidences and two marginal coincidences. These associations are listed in Table 1. Three of those in the new list were in the old list (plus the two marginal cases). There are two new ones and six of the old ones have disappeared. The three common ones have a mean flux of , compared with for the whole earlier set and are thus, presumably, more reliable.
The extent to which the SNR under consideration is associated with a nearby molecular cloud is indicated in the Table; by ‘interacting’ is meant such an association.
As the authors imply, the origin of the gamma rays in terms of CR acceleration by the SNR followed by interaction in the molecular cloud is only one possibility. Pulsars, or just the gas enhancements coupled with the ambient CR intensity, are also possibilities.
The uncertainty is also referred to by Torres et al. (2002) who include, in their analysis, new CO-observations (and implied molecular hydrogen masses). The importance of molecular clouds as targets has also been well brought out in a very recent paper by Torres et al. ( 2003 ). These authors point out that even distant SNR ( further than 5 kpc ) may be detectable as gamma ray sources if nearby clouds are sufficiently massive. They present evidence for 5 ‘coinciding pairs of 3EG sources and SNR’, for which there is evidence of nearby large molecular clouds.
The conclusion to be drawn at this stage is that there are probably coincidences of young ( less than about y ) SNR with gamma ray sources, but there is no certainty, yet. If the coincidences are genuine then the fluxes (above 0.1 GeV) are of order . Perhaps the best example is Cygni which, with a median flux of , is the nearest to us, at a distance of kpc.
3.2.2 The results for the nearby ‘Loops’
There were early claims that ‘Loop I’ had been detected in this energy band. Thus, Lebrun and Paul (1985) and Bhat et al. (1985) claimed excess fluxes from the direction of this feature. The latter analysis related to results from both the SAS II and COSB satellites. Rogers and Wolfendale (1987) went further and claimed excesses for Loop III and the Vela region. The work by Wolfendale and Zhang (1994) and Osborne et al. (1995) should also be mentioned. These authors examined data from the Compton Gamma Ray Observatory, specifically from the EGRET instrument and found gamma ray excesses from the ‘ridges’ of a number of SNR. Loop I was examined in detail by Osborne et al. and a strong case made for the presence of CR acceleration.
The best estimate of the excess gamma ray flux from Loop I is . We have reexamined the results from all the satellites and endeavoured to find the mean intensity through the centre of the remnant, as distinct from the overall flux, for reasons that will become clear later. The value is .
Information on the relative contribution of electrons and protons ( and heavier nuclei ) was given by Osborne et al.(1995). These workers made an analysis of the spectral shape far from the ridge, and nearby, and found similar shapes. Now Strong and Mattox (1996) showed the presence of the ‘pion-peak’ in the general diffuse flux, i.e. a majority of protons, so that the Loop I excess can also be explained by protons.
A consequence of the SN explosions which created our Local Superbubble is an environment enriched by nuclei. It is known that their abundance in cosmic rays grows with the energy. According to our ’Single Source Model’ these nuclei are responsible for the fine structure of the energy spectrum at the highest PeV energies with oxygen as the dominant element at the knee. The higher gamma ray emissivity of heavy nuclei compared with the protons can, therefore, in principle contribute to the observed flux of gamma rays from Loop I at higher energies.
Loop I is, in our view, a very likely source of excess gamma rays. A comparison with our expectation will be given later.
3.3 Search for gamma ray-SNR associations in the TeV energy region
3.3.1 General comments
The advent of Cherenkov radiation telescopes, which detect photons from secondary electrons in the upper levels of the atmosphere, has led to advances at TeV gamma ray energies. In terms of the physics to be studied, there is the usual advantage of going to higher energies –with the possibility of surprises. There is also the (hoped for) likelihood of the initiating particles being protons (and heavier nuclei) rather than electrons.
In terms of detectability, the relative background due to cosmic rays interacting with the Galactic ISM is reduced. This is because SNR have CR spectra on emergence of the form , whereas the ambient CR have an exponent of about 2.7; the difference arises because of the energy-dependent Galactic escape.
3.3.2 SNR beyond 1 kpc
An important search has been made by the HEGRA-IACT group (Lampeitl et al., 2001, Aharonian et al., 2002 ), relating to signals from 63 SNR on a quarter of the Galactic Plane (); none was detected. It is important to appreciate, however, that only 19 are situated at known distances (Green, 2000). Of the 19, the nearest is at 2.7 kpc (G023.3), and the mean distance is 5.2 kpc. The remaining 44 SNR are probably beyond 6 kpc, in view of their low radio fluxes. The upper limit for the SNR population is at the level of for . In total, just 5 distant SNR have been detected in the TeV energy region, 2 of them are plerions ( Crab and PSR 1706-44 ), which we shall not analyse here. The other 3 detected are of the shell type as follows:
-
(i)
Cas A (3C461). This is the remnant from the SN which exploded in 1680; it is 2.8 kpc away, has a radius of 2.5 arc min and a radio flux of 2700 Jy. The observed flux above 1 TeV (HEGRA: Aharonian et al., 2001) is .
-
(ii)
SN 1006 (G 327.6+14.6). This is the remnant of the SN which exploded in 1006. It is kpc away and has a radius of arc min. The radio flux at 1 GHz is 19 Jy. The flux observed above 1 TeV (from part of the shell: CANGAROO: Hara et al., 2001) is .
-
(iii)
SNR G348.5+0.0/348.5+0.1/347.3-0.5 associated with RX J1713.7-3946. This is an example of an extended source, which emits gamma quanta thought to be produced in the interactions of cosmic rays accelerated by the SNR shell with the nearby dense molecular clouds. The distance and the age of the source are under discussion and vary from 1 kpc with 2 kyears to 6 kpc with more than 10 kyears. The observed flux above 1 TeV is (CANGAROO: Enomoto et al., 2002 ).
3.3.3 SNR within 1 kpc
Green describes 5 SNR in this category, including the Cygnus Loop, Monoceros and Vela. Details are given in Table 2. Only Vela, which is a plerion type SNR, has been detected. Among nearby SNR found in X-rays the diffuse Monogem Ring should be mentioned ( Plucinsky et al., 1996 ), this object is located near Monoceros Nebula. In spite of the fact that it has not been detected in gamma rays we mention it as one of the possible candidates for our nearby ( 300 pc ) and recent ( years ) ‘Single Source’. The expectation values will be considered later.
3.4 The sensitivity problem and the minimum detectable flux
It is necessary to examine the general question of the sensitivity of contemporary detectors to searches for gamma rays ( GeV and TeV ) from SNR. Clearly, the sensitivity will be a function of the search method and of many parameters, most notably the background ( which will be a maximum in the Galactic Plane and towards the Inner Galaxy ) and the angular size of the source. Insofar as the majority of SNR are in the Galactic Plane the former will be more important, but in the case of Loop I, and our ‘Single Source’, the latter will also be of significance. The bigger the source the more accurately does the background need to be known because an -dependent background makes the technique of ‘ON source - OFF source’ much more difficult. The characteristics of the gamma ray telescope: area and angular resolution are also of course of prime importance.
In view of what has been said already, we consider that Figure 7 gives a good representation of the current limiting fluxes. As given, the values are averages (over the Galactic Plane); there is an uncertainty of a factor of about 2 to allow for the variable background. This, then, represents the contemporary limit to the identification of there being a significant gamma ray excess in the direction of a known SNR in, or near, the Galactic Plane.
Turning to the interpretation of observed excesses, there are further uncertainties. The excess could be due to an underestimate in the amount of gas in the vicinity. Li and Wolfendale (1981) examined this aspect for the 2CG catalogue of COS B sources and in that case showed that only half the sources were ‘genuine’ and not just due to the ambient, near-constant CR flux irradiating molecular clouds. Houston and Wolfendale (1984) estimated that a ‘genuine’ source of flux above 0.1 GeV of has a detection probability of less than 10% at and still only at . Although the subject has moved on in the intervening period it is difficult to imagine that the average fluxes given in Figure 7 are too high.
As with the situation for low energy gamma rays, it is important to consider the level at which the TeV gamma ray sources might be visible. Although this level is dependent on the characteristics of individual detection arrays ( e.g. on the size of the mirror and the angular bin size allowable ) there will be the same general feature as at low energies: the threshold flux will rise with increasing size of the object, viz. weak extended objects will be more difficult to see than sharp localised ones. Inspection of a collection of arrays gives the line shown in Figure 7.
4 The density of the ISM in the vicinity of SNR and the CR energy content
4.1 General remarks
The density of the ISM is a key parameter in our calculations insofar as the ISM provides the target material for gamma ray production. Although the canonical mean density of the ISM is 1 H-atomcm-3, and this has been used as our datum in the calculations, it is virtually certain that ( in the absence of molecular gas ) the relevant value will almost always be lower here. The basic reasons are two-fold:
-
(i)
SN often occur in groups so that there is a good chance of the SN under consideration having exploded in a ‘bubble’ caused by one or more previous SN.
-
(ii)
Type II SN, which are thought to be responsible for CR acceleration, are caused by very massive stars (often O-stars and Wolf-Rayet stars) and these stars give rise to strong winds before the SN itself. The winds displace much of the gas surrounding the star so that the remnant expands into its parent star’s evacuated surroundings. For very young SNR, however, ( eg. Berezhko et al., 2003 ) the previous wind may cause an increase in gas density. Details are given in what follows.
It will be appreciated that insofar as matter is conserved, there will be a pile-up of IS gas and the particle-irradiation of this gas may need to be considered. Furthermore, there is the ever-present possibility of the presence of molecular gas.
4.2 SN associations
Many of the massive stars responsible for SN are found in associations. Parizot et al.,(2001) quote 90% for this fraction, whereas Wallace et al.,(1994) and Ferrière, (2001) quote ‘about half’ for the catalogued O-stars and their association with clusters. These massive objects have energetic stellar winds which inject as much as ergs into the ISM over the stellar lifetime, i.e., as much as injected by the eventual SN itself. Arnal and Mirabel (1991), Lozinskaya (1991) and others have reported bubbles of up to 50–100 pc in diameter. Heiles (1987, 1990) has made the point that since many of the clustered O- and B-stars become SN ‘together’, within a short space of time (they are of almost the same age), they will form ‘superbubbles’ several hundred pc in diameter.
Loop I is almost certainly an example of a close succession of SN in a confined space and SNR G78.2+2.1, discussed later in connection with Gamma Cygni source, is another example of an SNR which is a member of an association.
4.3 Excavation of the ISM by an individual SN
For a single, isolated, SN the precursor star will reduce the local ISM density if, as is common (see Section 4.2), the stellar wind had a high energy content. Thus, many Type II SNR will expand into ‘low density’ regions of the ISM. The effect of this expulsion of ISM gas from the region is presumably not serious for the distant sources from the standpoint of overall, eventual, gamma ray production in the sense that because the mass of gas is conserved the gamma ray emission is simply transferred from within a near-uniform sphere to a spherical shell which for the distant sources is still within the field of view of the detector. However, for young SN, the measured gamma ray flux can be low even for this case if, as is likely, the SNR shock does not reach the compressed-gas region. For the nearby sources the effect of the ISM excavation should be substantial, because a large portion of the target mass will be outside of the fiducial volume of the detector. SNR Cas A, discussed in Section 3.3.2 and later in Section 5.3.1, is an example of such an SN which exploded into a wind bubble created by the progenitor star although Berezhko et al. ( 2003 ) argue that the gas density may be high because ‘part of the slow red supergiant wind of the SN progenitor has been swept up into a dense shell’. SN 1006 and RX J1713.7-3946 also reside in a low density environment.
4.4 The presence of molecular clouds
A complication is the presence of molecular gas which will be target material for the primary particles accelerated within the remnant ( and, of course, will be a target for the ambient CR in the ISM in general, eg. Houston and Wolfendale, 1981 ). The situation is not straightforward for a number of reasons, as follows:
-
(i)
The presence of molecular gas, mainly hydrogen, is manifested by the observation of the CO-line and there are many maps of CO-emission. The overlap of such contours with an optically detected SNR does not guarantee the presence of H2 within the remnant, because of line of sight effects, however. Indeed, only IC443 seems to be a clear example of a significant interaction between SNR and a molecular cloud ( MC ).
-
(ii)
Strong shocks dissociate CO and thus may ‘remove the evidence’. The dissociated H2 may or may not be seen against the foreground and background material.
-
(iii)
The interaction of an SNR shock with a MC is a matter of great complexity, not least because a MC itself is a complex system, composing as it does a mixture of dense clumps and less-dense inter-clump material.
Concerning the interaction of a shock with a clump ( density several hundred atoms cm-3 ), the shock speed is reduced considerably and particles may not be allowed into much of the cloud by the time of observation even though the rest of the shock has moved past the cloud. This factor might be the limiting one for ‘young’ SNR ( age years ). For example, in a cloud of mean density compared with the standard , the density ratio is and, since the shock velocity is proportional to ( Dyson and Williams, 1980 ), the speed will be reduced by 10. For a remnant of age years ( -Cygni - see later ), the shock velocity will be reduced to , i.e. 0.5 pc per 103 years.
A further point of importance is that energy is taken from the shock and given to the molecular material, thereby reducing the amount available for CR acceleration.
-
(iv)
Diffusion of particles into the cloud from the surrounding previously shocked medium may be slow. For example, for 2 GeV particles ( the precursors of gamma rays above 0.1 GeV ) even with the ‘normal’ diffusion coefficient used by us in the ISM in general ( ) the rms penetration will only be pc in 103 years. If the diffusion coefficient is much smaller in regions of high density - as would be expected for reasons of magnetic field compression - then the penetration will be even slower. In this connection it can be remarked that in their SNR shock - CR acceleration paper, Berezhko et al., (1996) assumed that the diffusion coefficient is inversely proportional to density. For a cloud with mean density , the rms penetration distance will therefore be reduced by an order of magnitude.
A relevant point concerns the ionization density in dense MC ( Chevalier, 1999 ), however. This author argues that CR may, in fact, propagate rapidly if the Alfvén waves are heavily damped. Nevertheless, the energy transfer problem, i.e. reduced fraction available for CR, cannot be circumvented.
-
(v)
The role of the inter-clump material appears crucial. Following Blitz, (1980) we note that although the fraction of the mass carried by this ‘low’ density material ( ) is low ( 25% ) the fractional volume is high - 92%. Chevalier, (1999) and Bykov et al., (2000) have argued for the generation of non-thermal radiation by magnetic field compression in this material. Electron-bremsstrahlung can be important, here ( see later ).
A further complication is that the shock may break up the cloud somewhat and thereby increase the mean rate of penetration. Nevertheless, the effective mass of a MC within, or adjacent to, a remnant will usually be much less than its inferred mass, and for -production, at least, the yield will be reduced.
The effect of the above will be particularly important for searches for gamma ray sources associated with known SNR-MC associations and particularly for those SNR which are young.
4.5 The mean gas density to adopt
The crucial question is the nature of the SNR. If it has not been recorded as such by optical means, then, if the ‘object’ is large, the effective density may be quite high, because the piled-up gas may well be included. On the other hand, searches for gamma ray emission from known sources - the usual situation - in general deals with young SNR where the shock has not reached the piled-up gas and the mean density of gas is low, unless there is nearby molecular gas, or unless the precursor has provided considerable local gas.
Taking the factors listed above into account, it appears reasonable to use a mean value equal to about twice that in the Local Bubble, this latter being ( see §2.1 ) for optically detected SNR for which there is no known associated molecular material. Thus, we adopt , but bear in mind that there will be big fluctuations in this value, not least if the SNR abuts or contains a molecular cloud, or has provided considerable gas from the precursor star. In fact, in the absence of molecular gas the distribution in densities will be nearer bimodal, with % having ( young SN in a cluster ) and 50% with ( a single isolated comparatively old SN ).
4.6 Energy taken by cosmic rays
Although we adopt ergs as the energy going into cosmic rays, it can be different. Examining the work of Berezhko et al. (1996) we note that this quantity can in fact be as high as 80% of the total, viz. erg. These authors give 80% and for the CR energy for an initial Mach number of 33 and injection rates and respectively.
5 Comparison of observations with our estimates
5.1 Gamma ray energies above 0.1 GeV in general
For SNR beyond 1 kpc, viz. less than about in radius, Figure 7 shows that the present limiting observational flux is about . Turning now to Figure 4a, which is for our preferred propagation model (), the predicted flux is for interactions and . For all CR-ISM interactions the value rises to . This is already below the observed limit of . For the 50% of sources with the predicted flux is , i.e. only 1.4% of this limit. Even with an 8-fold increase of the total CR energy content (see Section 4.6) the predictions are still an order of magnitude below the observed limit. It is, therefore, not surprising that many of these SNR are not seen.
For sources within 1 kpc, although the predicted fluxes are bigger, because of their increased angular diameters, the threshold fluxes for the sources will also be bigger. As an example, an SNR at 300 pc has a maximum predicted flux of for ( Figure 4a ), for , i.e. for CR-ISM interactions. With - the highest probable density in the absence of molecular clouds within the remnant - the predicted flux is . At 300 pc, the angular radius of SNR at the end of the expansion phase is about 20∘ and Figure 7 indicates an observed limit of . Again, even with an eightfold increase in energy content, the SNR will still be non-detectable in low energy gamma rays.
5.2 The detected sub-GeV gamma ray sources
5.2.1 The likely SNR—gamma ray source coincidences
Table 1 gives a list of these coincidences ( see also Section 3.2.1). At the indicated distances and ages, the expected flux will be for , the low flux being due to both distance and youth ( Figure 4a ). For the result is , several orders less than observation ( ). Presumably, the answer lies in some way with the accompanying ‘molecular cloud’ although the increased effective density required ( ) is very high, implying that most of the generated particles traverse the cloud if CR - gas nucleus collisions are in fact responsible, or more likely, that another process is more important. A ‘case history’ will examine this aspect.
Now some more details about the most important of the detected sources.
5.2.2 Loop I
The flux above 0.1 GeV is estimated by us as ( see Section 3.2.2 ). The estimates of the distance to the Loop I center and of its age are quite uncertain: pc and of order years, respectively. However, even with these uncertainties it is possible to say that for a single source the expected flux from our Figures 4a and 4c is between and , i.e. is lower by the factor of 4 even for the standard matter density of . Because Loop I is thought to be responsible for the formation of our Local Superbubble, the actual matter density in it is reported as and the expected flux should be reduced to for a single source. Even allowing for the fact that Loop I almost certainly results from many () SN over the past 1 My and allowing for an increase in CR energy, as well as with the possibility of enriching the mass, the discrepancy is still large.
A possible way out is the following. Although Loop I is in the HISM the measurements referred to in Section 3.2.2 show that the ridges stand out, i.e. the shock has reached the ‘piled-up’ gas. Furthermore, Frisch, (1997) has pointed out that there appear to be two molecular clouds in the remnant. These clouds are about 20 pc in radius and since the age of the remnant is large ( years ) there has been time for the clouds to have been penetrated by the CR. The corresponding mean gas density is ( our higher component value, by chance ), and the predicted intensity in the centre , i.e. a factor ( 52 ) short of the measurement. It is possible to achieve agreement by increasing the CR energy yield ( the individual CR particle energies are too low for it to be allowable to increase the mean mass ), furthermore, several SN over the last Megayear were probably responsible for the remnant, a claim in accordance with that of others. Agreement follows.
5.2.3 Gamma-Gygni
This source is important because it is often used as an example of a strong ’GeV source’ which on the other hand is a very weak ’TeV source’, which means that it is claimed that it cannot accelerate protons and nuclei up to TeV energies ( Prosch et al., 1996; Plaga, 2001 ). The situation here is the following. The observed flux of gamma rays above 0.1 GeV is for the source. There is an associated SNR, G78.2+2.1, which is a member of the Cyg OB9 association and if for this source alone the expected flux of gamma rays might be as low as . However, if the nearby molecular cloud Cong 8 is indeed physically coupled with the radio bright region DR 4, which is the evidence for the interaction of the accelerated electrons with the magnetic field of the cloud, then taking into account the parameters of the cloud ( and 0.05 for the fraction of the volume which it occupies in the SNR ), Prosch et al. were able to explain the observed gamma ray flux on the basis of its hadronic origin.
Some further comments are needed, however. It is, indeed, true, that there appears to be evidence for the impact of the SNR on Cong 8 by way of distortion of the radio contours but the fraction of the mass within the remnant appears to be less than 5%. Furthermore, Prosch et al. assume a mass for Cong 8 of whereas the truth seems to be much less ( , following Pollock, 1985 ). Indeed Cong 8 is a small part of the Cyg OB9 complex which, itself, only has a mass of . There is also a problem of the age of the remnant. Various values have been quoted, as high as years. Adopting the angular size of the optically ‘seen’ SNR ( Green, 2000 ) and a distance of 1.5 kpc we find a radius of 13 pc and thus an age of years only, for an ISM density of 1 atom cm-3. The age is important for two reasons: the extent of shock penetration and the ambient CR intensity at the time of observation. As the age increases the degree of penetration increases but the CR intensity falls. There is thus a measure of compensation.
Assuming, for the moment, complete penetration of the cloud, the expected flux ( above 0.1 GeV ) is given by
| (12) |
where is the mass in units of , is the emissivity in units of atom and is the distance in kpc. For the situation indicated above ( years, etc. ) inserting a factor for the fraction of the cloud penetrated ( f1 ), the gamma ray flux from Cong 8 will be
| (13) |
With an assumed density within the remnant of 1 cm-3 ( it is in a complex region with much material about ) the contribution from the rest of remnant is
| (14) |
The total is thus for the limiting case of ( in fact we show later that ). The result is already less than the ‘observed’ flux of by a significant factor.
It is true that our figure is dependent on SNR age but greater age would give a lower predicted intensity.
To conclude about low energy gamma rays for Gamma Cygni, it seems that the contribution from SNR - accelerated protons interacting locally is too small to explain the observed flux even if all the CR can penetrate the molecular cloud. It is here that the proposal of Chevalier, (1999) and Bykov et al., (2000) involving electrons is very attractive.
The TeV region for this source can also be considered here. At these energies only upper limits were obtained. From the results of HEGRA IACT ( He et al., 1997 ) and HEGRA AIROBICC ( Prosch et al., 1996 ) systems it can be concluded that the gamma ray flux above 1 TeV is less than . The predicted flux about 1 TeV from the present work is times the flux above 0.1 GeV, i.e. . With , this flux is higher than the observed upper limit by a factor 4, but the slowness of the shock front means that will be much less than 1. Specifically, with a cloud size of 10 pc the time taken to cross it is years ( see Section 4.4 ) and, insofar as only about 200 years are available ( from inspection of the geometry of the system ) %.
Thus, we predict , ‘comfortably’ below the observed upper limit.
5.2.4 The nearby SNR
Turning to Table 2, only Monoceros is a feature in Sturner and Dermer’s list, and here the flux is measured to be above 0.1 GeV. At a distance of 1 kpc and age years ( radius 30 pc ), Figure 4a predicts for , viz. 3 orders short. The effective density needed is even higher than above ( Section 5.2.1 ): and even with an increased CR energy output and heavy nuclei, considerable penetration of the ( known ) molecular cloud is needed.
5.3 Gamma ray energies above 1 TeV in general
Arguments similar to those presented in Section 5.1 pertain here. For the cluster SNR, with , seen as the source of the angular size , our maximum predicted flux (Figure 4b) is for and for CR-ISM interactions, to be compared with a minimum detectable flux of ( Figure 7 ). For isolated sources of a similar size with there is still a discrepancy by a factor of 13. The larger angular size of nearby SNR requires a smaller distance to be seen, for example, a 10∘ SNR of age 104 years is seen from a distance of 200 pc and the expected flux for an isolated SN is for CR-ISM collisions, which is again less than the minimum detectable flux of , although only by a factor of 1.8, which is within the uncertainty of these estimates and the factor of 2.8 ( see §2.3.3 ) to allow for heavier nuclei in CR and the ISM would be sufficient to cover this difference.
For the SNR similar to our ’Single Source’ there is another possibility to reduce the discrepancy. As discussed in 2.3.2 the intensity of gamma rays is dependent on the mass of the initiating particle; specifically for a ‘thin target’ ( the gas in the SNR ) and for a fixed rigidity spectrum it is proportional to Z ( equation 9 ). Thus, if the majority of the particles were ‘heavy nuclei’—say oxygen and iron (as required to explain the knee in the Single Source Model)—then the gamma ray emission would be enhanced.
To re-iterate, a nearby, isolated SNR, producing mainly heavy nuclei at TeV energies and viewed against a low Galactic background might just be detectable; an increase in CR energy, too, would take it into the observable class.
In what follows we examine the detected TeV gamma ray sources, which seem to be important for our analysis.
5.3.1 The detected TeV gamma ray sources
All three shell type SNR detected to date in TeV gamma rays are relatively distant sources and the sensitivity of detection is a maximum.
(i) CasA. As remarked in Section 3.3.2, CasA ( 3C 461 ) has a measured flux of above 1 TeV. For a distance of 3.4 kpc, Figure 4 indicates an expected gamma ray flux of cm-2s-1 for cm-3, and for our preferred density of cm-3 the flux would fall to cm-2s-1. An increased CR yield by a factor 8 ( see §8 ) we would predict cm-2s-1, a value too low by a factor of 30. Before dismissing -decay as the source of the detected gamma rays mention must be made of very recent work by Berezhko et al. ( 2003 ). These authors adopt a mean density of 11 cm-3 ( see §4.3 ) and, with erg going into CR derive an expected flux equal to that observed. Our own model applied using these parameters ( 11 cm-3 and erg ) would give a similar result - a factor 2 smaller. With the factor 2.8 from §2.3.3 there is near agreement.
The density is so high because the progenitor is assumed to have
injected 2M⊙ into very small
( 2 pc radius ) SNR. Whether this
is reasonable remains to be seen.
(ii) SN 1006. For the source, SN1006, the observed flux is , to be compared with expectation ( Figure 4 ) of for . At first sight, explanation of the deficit by way of IC appears to be the solution but we wish to point out the conclusions of Berezhko et al. ( 2001 ) - denoted BKV. These authors maintain that the IC contribution is only 30% of the total expected intensity, the bulk coming from -decays. In passing, and this has relevance to the discussion in §1, they point out that the different spatial distribution of low energy electrons which produce the radio signal and the high energy electrons which can generate the TeV gamma rays are very different ( the former being concentrated in a thin shell, where the magnetic field is very strong ). Thus, the implied high energy electron intensity is lower than would have been claimed from the straightforward use of the radio data.
BKV use values for the SNR shock energy going into CR and gas density higher than ours such that they are able to explain the whole signal from SN 1006 in terms of -decay. In fact, relaxing our parameters to theirs would only increase our flux to cm-2s-1, a factor 9 short. Part of the reason for the difference in predictions of our model and that of BKV ( a factor 3 ) may come from differences in the spectral shape of the proton component but the reason for the residual difference is unknown ( application of the 2.8 factor from §2.3.3 is not appropriate because we are making a comparison ).
Notwithstanding the claim by BKV to be able to explain the TeV emission by -decay, we feel that IC may be the answer. The reason is that the gamma ray emission comes from a restricted region of the remnant only and it is unphysical to assume that the whole of the CR injection is concentrated in this region.
(iii) SNR G347.3-0.5. As for the ROSAT source RX J1713.7-3946 ( SNR G347.3-0.5 ), possibly associated with the EGRET GeV source 3EG J1714-3857, the measured fluxes are above 0.1 GeV and above 1 TeV. The distance to this source is very uncertain, values quoted are within 1 - 6 kpc, and the age is unknown. However, even with these uncertainties we can say that the maximum expected fluxes are about and respectively for , i.e. substantially less than observed, even for this ‘high’ density, but within the accessible region when a higher CR energy content is allowed.
6 Conclusions
We have used our ‘standard’ SNR model to predict gamma ray fluxes above two limiting energies (0.1 GeV and 1 TeV) for remnants of various ages and at different distances. Attention has been drawn to the crucial question of the (ISM) gas into which the remnant expands and it is pointed out that this can vary from one remnant to another over the range to H-atoms cm-3 together with - in some cases - contributions from molecular clouds or gas from the progenitor.
Comparison with observation shows our ( conventional ) predictions to be always lower than observation (or the estimated upper limit to the measured fluxes) and this is particularly so in the lower energy region. In the TeV region the predictions are nearer to observation but it is disturbing that where positive observations have been made rather extreme assumptions must be made. Loop I is, perhaps, an exception insofar as there is approximate agreement, without recourse to unusual features. It must be assumed that processes other than proton ( and other nuclei ) - interstellar gas interactions are mainly responsible for the measured gamma ray fluxes, particularly at low energies.
The conclusion of relevance to cosmic ray origin is that, in view of the predicted gamma ray fluxes never exceeding observation, there is, as yet, no objection to particles to at least 10 TeV having been accelerated by supernova remnants.
Acknowledgments
The authors are grateful to The Royal Society and The University of Durham for financial support. Two unknown referees are also thanked for useful comments and suggestions.
| SNR | Age ( y) | Distance (kpc) | Interacting? |
| IC443 | 3.0 | 0.7–2.0 | Yes |
| MSH11-61A | 2.2 | 2.2–518 (?) | No (?) |
| G 312.4-04 | 15.0 | Yes (?) | |
| W28 | 2.5 (?) | 1.6–4.2 | Yes |
| Cygni | 14 | Yes |
| Name | SNR | distance | Ang. radius | Approx. radius | (1 GHz) |
|---|---|---|---|---|---|
| () | (kpc) | (deg.) | (pc) | (Jy) | |
| — | G 65.3 +5.7 | 0.8 | 2.5 | 32 | 52 |
| Cygnus Loop | G 74.0 | 0.44 | 2.0 | 14 | 210 |
| — | G 89.0 +4.7 | 0.8 | 1.0 | 13 | 220 |
| Monoceros | G 205.5 +0.5 | 0.8–1.6 | 1.8 | 30 | 160 |
| Vela | G 263.9 | 0.25-0.5 | 2.0 | 1 | 1750 |
References
Aharonian, F.A., Akhperjanian, A., Barrio, J. et al., 2001, (Astron. Astrophys., 370, 112
Aharonian F.A., 2002, astro-ph/0209360, submitted to Astron. and
Astrophys.
Alpgard K. et al., 1982, Phys. Lett. B, 115 71
Arnal E.M. and Mirabel, F., 1991, Astron. Astrophys., 250, 171
Axford W.I., 1981, Proc.17th Int.Cosmic Ray Conf.(Paris),12 155
Berezhko E.G., Elshin V.K. and Ksenofontov L.T., 1996, J. Exp. Theor. Phys., 82 1
Berezhko E.G. 1999 Private communication
Berezhko, E.G., Ksenofontov, L.T. and Völk, H.J., 2001, Proc. 27th Int. Cosm. Ray Conf., (Hamburg), 6, 2489
Berezhko, E.G., Pühlhofer, G. and Völk, H.J., 2003,
astro-ph/0301205
Berezinsky V.S. et al., 1984, Astrophysics of Cosmic Rays, Nauka,
Moscow
Bhadra, A., 2002, J. Phys. G: Nucl. Part. Phys., 28, 397
Bhat, C.L. et al., 1985, Nature, 314, 515
Blitz, L., 1980, Giant Molecular Clouds in the Galaxy,
Eds. P.M.Solomon and M.G.Edmunds, Pergamon Press, 1
Bykov, A.M. et al., 2000, Astrophys. J., 538, 203
Chevalier, R.A., 1999, Astrophys. J., 511, 798
Dodds, D., Wolfendale, A.W. and Wdowczyk, J., 1976 Mon. Not. Roy. Astron. Soc., 176, 345
Drury, L.O’C., Aharonian F.A. and Völk, 1994, Astron. Astrophys 287 959
Dyson, J.E. and Williams, D.A., 1980, Physics of the Interstellar
Medium, Manchester Univ. Press
Enomoto R. et al., 2002, Nature, 416, 823
Erlykin, A.D. and Wolfendale, A.W., 1997, J. Phys. G:
Nucl. Part. Phys. 23 979
Erlykin, A.D. and Wolfendale, A.W., 2001, J. Phys. G:
Nucl. Part. Phys. 27 941
Erlykin A.D., Lagutin A.A. and Wolfendale A.W. 2003 Astropart. Phys (in press), astro-ph/0209506
Erlykin A.D. and Wolfendale A.W., 2002a, J. Phys. G:
Nucl. Part. Phys. 28 2329
Erlykin A.D. and Wolfendale A.W., 2002b, J. Phys. G:
Nucl. Part. Phys. 28 359
Ferriere, K.M., 2001, astro-ph/0106359
Frisch P., 1997, astro-ph/9705231
Green, D.A., 2000, A Catalogue of Galactic SNR, Dept. of
Physics, Univ. of Cambridge, UK
Hara, S. et al., 2001, Proc. 27th Int. Cosm. Ray Conf. (Hamburg),
6, 2455
Hartman, R.C. et al., 1999, Astron. Astrophys. Suppl. Ser., 123, 179
Heiles, C., 1987, Astrophys. J., 315, 555
Heiles, C., 1990, Astrophys. J., 354, 483
Heß, M. et al., 1997, Proc. 25th
Int. Cosm. Ray. Conf. (Durban),
3 229
Houston, B.P. and Wolfendale, A.W., 1984, J. Phys. G:
Nucl. Part. Phys., 10, 1587
Ito K., 1988, in Cosmic Ray Astrophysics, ed. by Oda M.,
Nishimure J. and Sakurai K., Terra Sci.Publ.Com./Tokyo
Lagutin A.A. et al., 2001a, Nucl. Phys. B (Proc.Suppl.) 97 267
Lagutin A.A. et al., 2001b, Proc. 27th Int. Cosmic Ray
Conf.(Hamburg), 5 1900
Lampeitl H. et al., 2001, Proc. 27th Int. Cosm. Ray Conf.,
(Hamburg), 6, 2348
Lebrun, F. and Paul, J., 1985, Proc. 19th Int. Cosm. Ray Conf.,
(La Jolla), 1, 309
Li, T.P. and Wolfendale A.W. 1981, Astron. Astrophys. Lett.,
100, L126
Longair M.S. 1992, High Energy Astrophysics, Cambridge Univ. Press,
second. ed., vol.1
Lozinskaya, T.A., 1991, Supernovae and Stellar Winds in the
Interstellar Medium, Amer. Inst. Phys.
Moffett, D.A., Gross, W.M. and Reynolds, S.P., 1993, Astrophys. J., 106, 1566
Osborne, J.L., Wolfendale, A.W. and Zhang, L., 1995,
J. Phys. G: Nucl. Part. Phys., 21, 429
Pare E. et al. 1990, Phys. Lett. B 242 531
Parizot, E., Paul, J. and Bykov, A., 2001, Proc. 27th
Int. Cosm. Ray Conf. (Hamburg), 6, 2070
Plaga R. 2001, astro-ph/0111555, submitted to New Astronomy Review
Plucinsky P.P. et al., 1996, Astrophys. J., 463, 224
Pohl M. 2001, Proc. 27th Int.Cosmic Ray Conf. (Hamburg),
Invited, Rapporteur and Highlight Papers, 147
Pollock, A.M.T., 1985, Astron. and Astrophys., 150, 339
Prosch C. et al., 1996, Astron. and Astrophys., 314, 275
Ramana Murthy, P.V. and Wolfendale, A.W., 1993, Gamma Ray
Astronomy, Cambridge Univ. Press
Rogers, M.J. and Wolfendale A.W., 1987, Proc. 20th Int. Cosm. Ray
Conf., (Moscow), 1, 81
Rossi B., 1952, High Energy Particles, Prentice Hall, Englewood
Cliffs, NJ
Stecker, F.W., 1971, Cosmic Gamma Rays, Mono Book Corp.,
Baltimore MD
Strong, A.W. and Mattox, J.R., 1996, Astron. Astrophys., 308, L21
Sturner, S.J., and Dermer, C.D. 1995, Astron. Astrophys., 293, L17
Sturner, S.J., Dermer, C.D. and Mattox, J.R., 1996 Astron. Astrophys. Suppl. Ser., 120, 445
Torres, D.F., Romero, G.F., Dame, T.M. et al., 2002,
astro-ph/0209565, submitted to Physics Reports
Torres, D.F. et al., 2003, astro-ph/0301424
Völk H., 2002, astro-ph/0210297
Wallace, B.J., Landecker, T.L. and Taylor, A.R., 1994, Astron. Astrophys, 286, 565
Wiebel-Sooth B. and Biermann P.L. 1999, Astronomy and
Astrophysics - Interstellar Matter, Galaxy, Universe, 3C, 37, publ. in Landolt-Börnstein, Group VI, ISBN
0942-8011/3-540-56081-5, Springer Verlag, Berlin/Heidelberg
Wolfendale, A.W. and Zhang, L., 1994, J. Phys. G:
Nucl. Part. Phys., 20, 935