Magnetic field evolution in galaxies interacting with the intracluster medium
A fully three-dimensional (3D) magnetohydrodynamical (MHD) model is applied to simulate the evolution of the large-scale magnetic field in cluster galaxies interacting with the intra-cluster medium (ICM). As the model input we use a time dependent gas velocity field resulting from 3D N-body sticky-particle simulations of a galaxy. The modeled clouds are affected by the ram pressure due to their rapid motion through the ICM in the central part of a cluster. Numerical simulations have shown that after the initial compression phase due to ram pressure a process of gas re-accretion onto the galactic disk takes place. We find that the gas re-accretion leads to an increase of the total magnetic energy without any dynamo action. The simulated magnetic fields are used to construct the model maps of high-frequency (Faraday rotation-free) polarized radio emission. We show that the evolution of the polarized intensity shows features that are characteristic for different evolutionary stages of an ICM–ISM interaction. The comparison of polarized radio continuum emission maps with our model permits to determine whether the galaxy is in the compression or in the re-accretion phase. It also provides an important constraint upon the dynamical modeling of an ICM–ISM interactions.
1 Introduction
It is well known that galaxies in clusters have different physical and morphological properties than field galaxies. They are often Hi deficient, i.e. they have lost up to 90% of their atomic gas - mainly due to the interaction of the interstellar medium (ISM) with the intra-cluster medium (ICM) (Solanes et al. 2001). The cluster galaxies often possess Hi tails and strong compression regions (Cayatte et al. 1994, Bravo-Alfaro et al. 2000, Chyży et al. in prep.). These observed asymmetries of the gas distribution can be explained either by ram, pressure effects (Vollmer et al. 2001 and references therein) and/or by tidal interactions with nearby companions (e.g. NGC 4438, Combes et al. 1988). Recent radio continuum observations of Virgo Cluster galaxies show also magnetic field structures which are not present in normal galaxies (Soida et al. 1996, Vollmer et al. in prep.). NGC 4254, oriented face-on, shows strong radio polarization maxima distributed outside the optical spiral arms in the direction towards the Virgo Cluster center (Soida et al. 1996, Chyży et al., 2001). The highly inclined galaxy NGC 4522 also shows asymmetric radio polarization destinations (Vollmer et al. in prep.).
While the question of the gas reaction to the ICM ram pressure has a rather long history (Takeda, Nulsen, & Fabian 1984, Gaetz, Salpeter & Shaviv 1987; Balsara, Livio, & O’Dea 1994; SPH: Tosa 1994; Abadi, Moore, & Bower 1999, Schulz & Struck 2001; Vollmer et al. 2001), there were no investigations yet concerning the evolution of magnetic fields in cluster galaxies. Therefore, a comprehensive study of magnetic field behaviour under the influence of the gas stripping process is needed to provide a physical interpretation of the observed features in the radio continuum and polarization in stripped spiral galaxies.
The evolution of the magnetic field structure in galaxies is closely related to the amplification of the large scale magnetic field by a dynamo action. The main clue of the traditional MHD dynamo is the rate of small scale turbulent motions in the rotating medium producing large-scale poloidal magnetic field from the azimuthal one. Then the differential rotation reproduces the toroidal magnetic field with its strength amplification (e.g. Parker 1979 and references therein).
We solve the induction equation for the gas velocity fields obtained from the N–body simulations by Vollmer et al. (2001). With our simulations we analyze the problem of a total magnetic energy amplification in galaxies interacting with the ICM. In a first step no dynamo action is included.
The main goal of our project is to study a representative case of ICM–ISM interaction to investigate the characteristic features of the magnetic field evolution. This will be a first step to understand the observed magnetic fields in cluster galaxies.
The outline of this article is as follows: the model used to simulate the evolution of the magnetic field is introduced in Sect. 2. The resulting evolution of the magnetic field topology is shown in Sect. 3.1. In Sect. 3.2 the evolution of the total magnetic energy is investigated, followed by the construction of model maps of polarized radio emission (Sect 3.4). We discuss our results in Sect. 4 and summarize them in Sect. 5.
2 Model
We constructed a 3D MHD model of magnetic field evolution (see Otmianowska-Mazur et al. 1997 for more details) in a galaxy moving rapidly through the ICM. We apply the Zeus3D code (Stone & Norman 1992a and b) solving the induction equation:
| (1) |
where is the magnetic induction, is the large-scale velocity of the gas, and is the coefficient of a turbulent diffusion. Realistic, time dependent gas velocity fields are provided by the 3D N-body sticky-particle simulations of Hi cloud complexes evolving in an analytically given gravitational potential of a disk, a bulge and a halo (Vollmer et al. 2001). The clouds collide inelastically and are affected by the assumed ICM ram pressure due to relative motion of the galaxy with respect to the ICM.
2.1 Model input parameters
We model a galaxy which is mildly Hi deficient (it has lost 30% of its gas) at the end of the simulation. It is on an eccentric orbit within the cluster and its disk plane is inclined by 20∘ with respect to the orbital plane. When the galaxy is approaching the cluster center the clouds are pushed and possibly stripped away in the direction opposite to its velocity respect to ICM. When the galaxy emerges from the cluster core, a process of cloud re-accretion starts due to the galactic gravitational potential. The sticky-particle code uses 10000 cloud complexes with different masses. Ram pressure is modeled as an additional acceleration on the clouds located at the surface of the gas distribution in the direction of the galaxy’s motion within the cluster. Thus, there is no explicit intra-cluster medium included in the model. The maximum ram pressure applied on the clouds corresponds to an intra-cluster medium density of (see Vollmer et al. 2001 for more details) and a maximum velocity of the modeled galaxy of about 1500 km s-1 with respect to the cluster center. The time step of our calculations is yr. The time of closest approach to the cluster center is =500 Myr after the start of the simulations.
The induction equation is analyzed in rectangular coordinates (). The number of grid points used is 171x171x71 along the , and axis, respectively. This corresponds to the grid spacing of 200 pc in the galactic plane and of 280 pc in the direction, resulting in a size of the modeled box of 34 kpc x 34 kpc x 20 kpc. Since the N-body code is discrete whereas the MHD code is using a grid, we have to interpolate the discrete velocities on the grid. This is done using a spline function with a density dependent smoothing length. It turned out that we had to use a large smoothing length to suppress the noise in the velocity field of the outer disk, which is due to a small, local particle density. In this way we avoid numerical artifacts of the magnetic field distribution at the outer disk. This has the consequence that the velocity field at the edge of the gas distribution is more extended than the gas distribution itself, which leads to an overstanding magnetic field at the edges of the gas distribution.
The large number of grid points gives rise to a computational difficulty: in our earlier papers (eg. Otmianowska-Mazur et al. 2002, Elstner et al. 2000) the cell size in direction was 80 pc, whereas in the present simulations it is 280 pc, thus the value of the numerical diffusion in the direction is certainly higher. In order to avoid such diffusion in the central part of our box during the first 20 time steps the velocity curve was smoothed from the distance of 5 kpc to the center with a Gaussian function with kpc. This smoothing influences the magnetic field configuration in the later time steps only marginally, but allows to keep magnetic flux in the central disk constant during the first 200 Myr of its evolution. We assume the magnetic field to be partially coupled to the gas via the turbulent diffusion process (Otmianowska-Mazur et al. 2002). We made two basic experiments with two different behaviours of the turbulent diffusion coefficient: uniform (case A) and linearly growing with in the halo (case B) (see Otmianowska-Mazur et al. 2002 for a detailed explanation). Its value is in the whole box for case A. For experiment B it has the same value in the disk plane. To check how numerical diffusion influences our results, two additional computations were made: no physical diffusion (only numerical diffusion) (case C), and uniformly distributed diffusion 5 times smaller than in case A (case D). The initial magnetic field is purely toroidal with a strength of 1 G.
3 Results
3.1 Magnetic field geometry
All calculated models with different diffusion coefficient result in qualitatively similar magnetic field structures. Therefore, we discuss only case A (uniform diffusion) as the simplest one. The effects of the ICM ram pressure on the ISM of a galaxy moving rapidly through the ambient ICM can be divided into two main phases: the period of cloud pushing/stripping called also the compression phase and of cloud re-accretion (see Vollmer et al. 2001). Both of these processes influence significantly the magnetic field morphology. The stripping phase takes place roughly between 300 and 600 Myr. Re-accretion happens mainly between 700 and 1000 Myr.
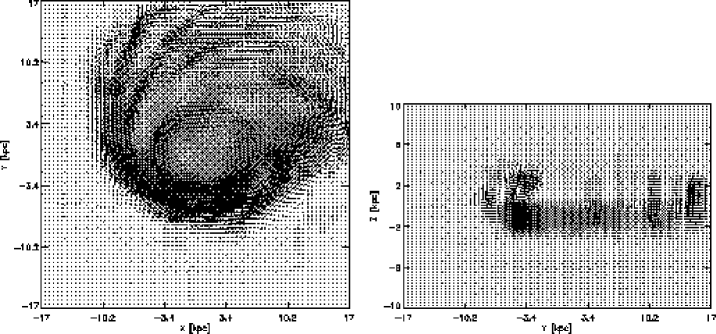
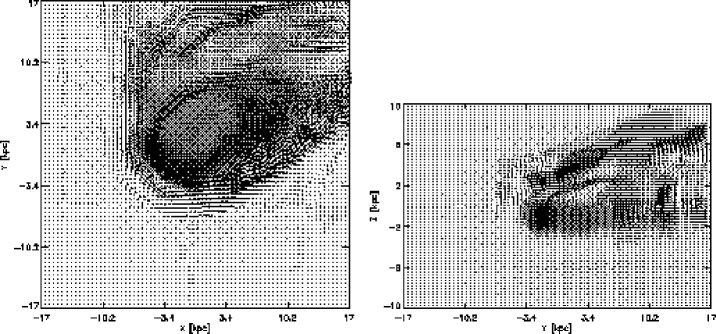
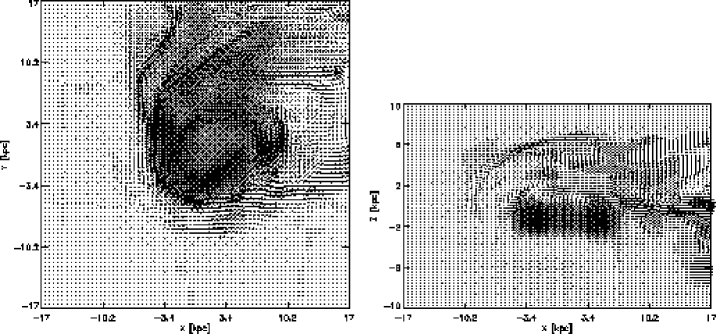
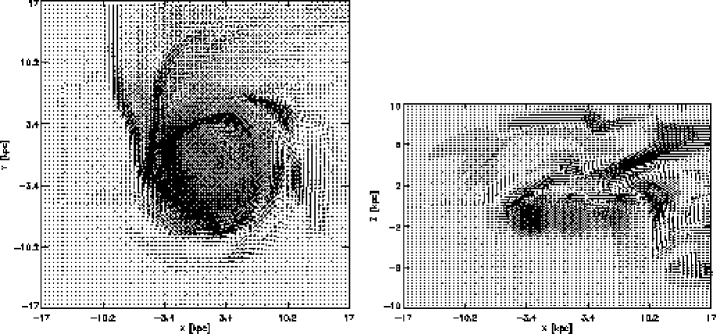
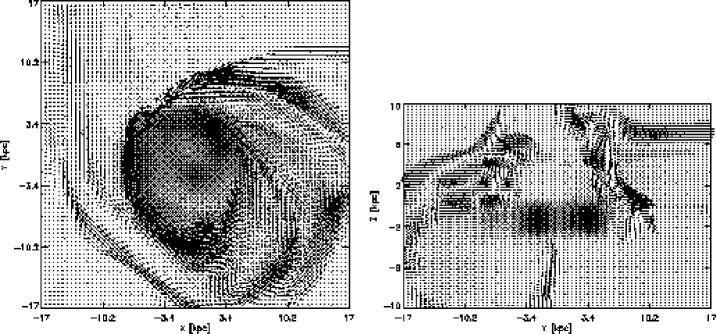
In Figs.1-6 we present snapshots of 6 different timesteps: =450, 550, 650, 750, 850, and 950 Myr. In each figure the magnetic field vectors in the midplane of the disk are shown while the total gas density is presented in a logarithmic scale. The galaxy is viewed face-on (- plane; left panel) or edge-on (right panel). In order to emphasize the most interesting features we show the - plane in Fig. 3–5 and the - plane in Fig. 1, 2 and 6. The maximum lengths of the magnetic field vectors are G in the - plane and G in the - and - planes respectively. The galaxy moves towards south-east, which is equivalent to the wind flowing from this direction. In the - and - plane the wind also comes from the south-east.
3.1.1 The compression phase
Shortly before the ram pressure reaches its maximum (=450 Myr), the gas is strongly compressed forming a heavy spiral arm on the windward side of the disk (Fig. 1). The magnetic field is swept together with the gas and also forms a strong maximum in the direction of the wind (south-east). Since the compressed magnetic field rotates counter-clockwise together with the gas (frozen-in field), its maximum is located in the south-west of the galaxy. We observe a shift between the maximum of the magnetic field and that of the gas. Because there is no ISM located further out to the south–east than the gas maximum, the offset magnetic field can not be associated with the ISM. Three physical mechanisms can in principle create such an offset: (i) the pile–up of magnetic field associated with the ICM, (ii) turbulent diffusion, and (iii) shear amplification between the rotating galaxy and the intra-cluster medium. Since there is no explicit ICM and thus no magnetic field associated with the ICM included in the model and diffusion is much too slow to play a role, mechanisms (i) and (ii) are excluded. In order to estimate the growth of the magnetic field due to shear, we compare it to the growth due to gas compression:
| (2) |
The growth of the magnetic field due to shear is:
| (3) |
where , are the components of the magnetic field in azimuthal, radial direction, is the velocity component in radial direction, is the angular velocity, and is the galactocentric distance. The derivative can be estimated by 40 km s-1/5 kpc. Since the wind accelerates the outer gas particles is reduced, thus’ 150 km s-1/5 kpc. In the south-east the magnetic field is mainly azimuthal . Thus, the amplification of the magnetic field due to gas compression exceeds that due to shear. We conclude that the shift between the gas and magnetic field maxima in the south-east is a pure numerical artifact. It is due to the use of a density dependent smoothing length together with a fixed minimum length. The smoothing length at the edge of the galaxy’s gas distribution is small, whereas slightly outside, it becomes much larger. The offset thus reflects the gradient of the smoothing length across the edge of the gas distribution.
In the north-western part of the disk the visible distribution of magnetic field structures is caused by stripping effects. In the western part of the outer disk the magnetic field forms small waves and changes its direction locally at an almost right angle. In the direction (Fig. 1 right panel) an asymmetry in the distribution of magnetic field vectors can be observed in the compression region. Since the wind direction has a radial component and a component in the direction, the magnetic field begins to be pushed radially inwards and towards positive .
At the timestep of 550 Myr (Fig. 2) the gas has formed a prominent accelerated arm in the west (=10 kpc, =3 kpc). The magnetic field enhanced due to compression effects follows the rotation of the gas and moves counter-clockwise. In addition, being pushed by the wind it moves inwards. Its maximum strength is now located west (=10 kpc, =0 kpc) of the galaxy closer to its center than for =450 Myr. The magnetic maximum is offset from the gaseous one, again due to the gradient of the smoothing length across the edge of the gas distribution. The magnetic spiral arms in the north as well as the waving structure in the west are more pronounced than at =450 Myr. In the direction the compressed magnetic field of the south-eastern part of the galaxy is swept together with gas by few kpc above the disk plane (much higher than the initial magnetic field; Fig. 1).
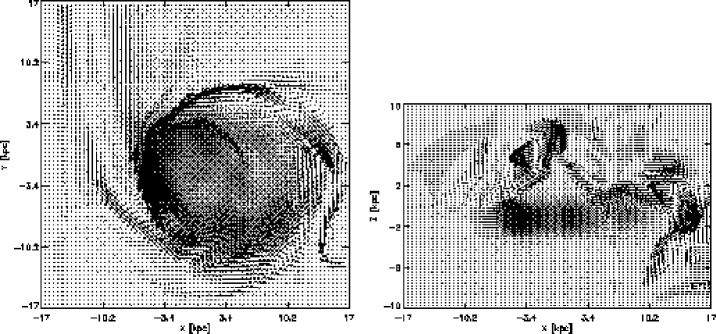
At the time =650 Myr (Fig. 3) the galaxy slows down on its orbit away from the cluster core. The accelerated arm has moved to the north of the galaxy and has a complex three dimensional structure. The gas maxima start to be redistributed and wind-compression features diminish their strength. However, at the south-east disk edge magnetic maxima are still present (Fig. 3 left). The northern part of the outer disk is filled with strong magnetic arms stretching away from the galaxy. At the south–west side of the disk (=10 kpc, =-3 kpc) a counter-rotating gaseous arm forms. The visible maximum of the magnetic strength there is connected with the falling gas. In the - plane the magnetic field extends to even more positive than for =550 Myr, whereas the magnetic field at the location, where the counter-rotating arm forms, extends to negative .
3.1.2 The phase of re-accretion
The period of re-accretion begins at Myr. The galaxy moves slowly through outer regions of the cluster. The wind has ceased and a large number of gas clouds starts to fall back onto the galactic disk producing very violent gas fountains. The magnetic field is taken up and down together with the gas and forms poloidal loops extending high in the halo (even to 7 kpc, see Fig. 5 right panel).
At =750 Myr (Fig. 4) the accelerated arm, which falls back onto the galactic disk in the north-east, produces a distribution of maximum gas density similar to that produced by the wind (Fig. 1). The counter-rotating arm, which has a very small mass, has no visible influence on the gas distribution, but generates magnetic field at negative that are not visible in Fig. 4, because it is not located in the – plane. Due to the strong shear motions at the trailing edge of the back-falling, accelerated arm, the magnetic field is enhanced there. It extends towards positive . A second maximum of the magnetic field is visible in the south-west where an expanding gas shell starts to form.
At =850 Myr (Fig. 5) the ridge of the enhanced gas density has moved to the north-east, in a counter-rotating sense. The maximum of the magnetic field follows this ridge. Additionally, a strong magnetic arm is formed to the north, whose radial distance from the galactic center increases to the west. For the first time a weak magnetic arm is visible east of the galaxy. In the south-west (=5 kpc, =-10 kpc) the expanding gas shell is now clearly visible. The magnetic field structure in the direction became very complex. Several magnetic loops with heights up to several kpc above the disk plane can be observed in Fig. 5 (right panel).
At the last presented timestep (=950 Myr, Fig. 6) we observe the beginning of a second expanding gas shell south of the galaxy center, which coincides with a strong ridge of magnetic field. Thus, the beginning of the expansion of a gas shell is accompanied by a strong magnetic arm. In the western part we observe strong open spiral arms. The magnetic field structure in the direction shows now several loops extending up to 10 kpc in both direction of the disk plane.
3.2 Evolution of the total magnetic energy
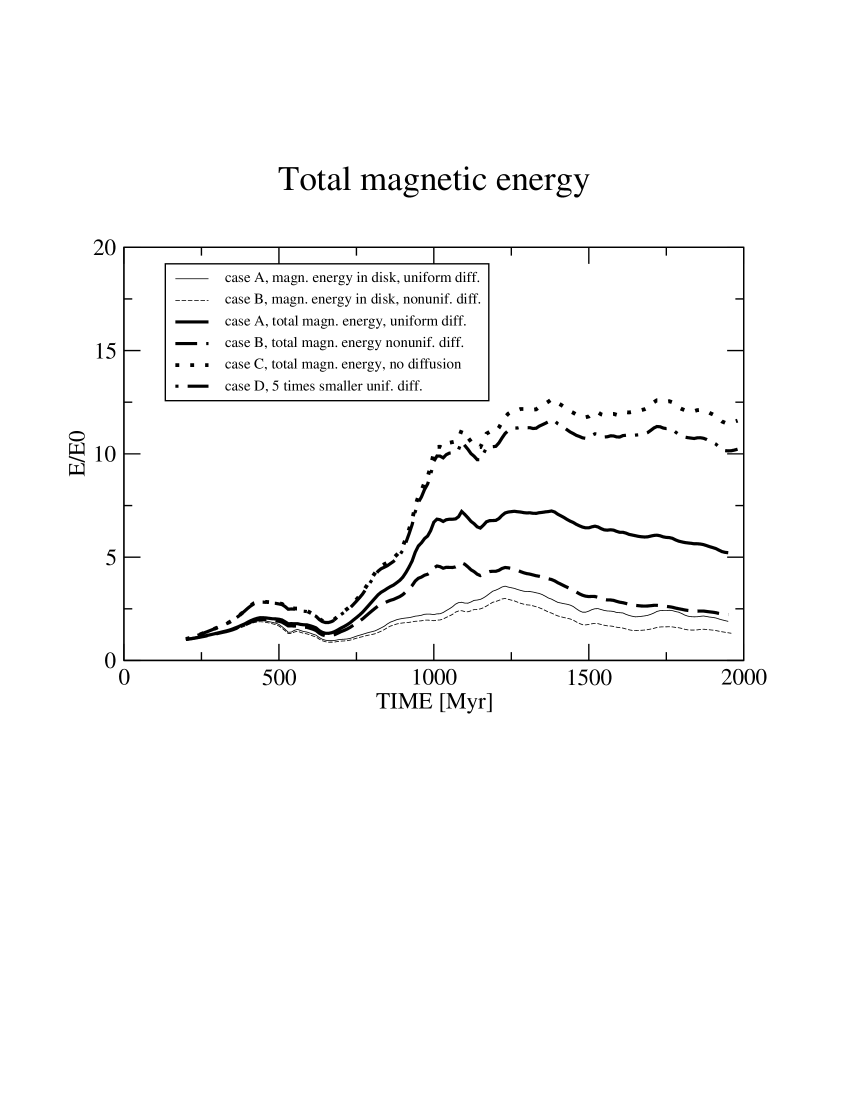
The evolution of the total magnetic energy normalized to its initial value is presented in Fig. 7 for our 4 experiments: with a uniformly distributed magnetic diffusion coefficient (case A), with a diffusion coefficient growing into the halo (case B), without a physical diffusion (case C), and with a diffusion coefficient 5 times smaller than its basic value (case D). We have calculated the magnetic energy (i) in the whole box (34 kp34 kpc20 kpc) and (ii) in a thick disk centered on the galaxy center with a disk height of 1.8 kpc.
For cases A and B the total magnetic energy increases from its initial value and reaches its maximum at 430 Myr. In the cases of the reduced physical diffusion (case C) and no physical diffusion (case D) the total magnetic energy rises to 3 times its initial value. The ram pressure compresses the gas at the windward side and gives rise to a radial component of the velocity field there. This enhances the magnetic field via the term in the induction equation (Eq. 1). At the same time the wind expels the magnetic field out of the galaxy and out of the box of calculation. ¿From =500 Myr to 700 Myr the sweeping of the magnetic field becomes more important than the generation of magnetic field due to compression. The magnetic energy in the disk and in the whole galaxy even decreases slightly below its initial value.
The process of re-accretion, which starts at about 650 Myr, causes a fast growth of the total magnetic energy in the whole galaxy from (case B, long dashed line) to (experiment A, dashed line). Within the thick disk the magnetic energy increases to and , respectively. Moreover, the increase of the magnetic energy within the disk is slower than in the whole galaxy. In the re-accretion phase the magnetic energy within the whole box reaches a maximum for case A/B at Myr. The magnetic energy within the disk reaches its maximum 150 Myr later. We observe a clear decline of the magnetic energy within the disk and the whole galaxy after the maximum for case A and B.
The experiments with a reduced physical diffusion (case D) and without physical diffusion (case C) lead to a higher increase of the total magnetic energy than our basic two experiments A and B. The energy grows 10 times its initial value during the re-accretion phase. During the last 700 Myr the total magnetic energy stays almost constant for case D and decreases only very slowly for case C.
The influence of the physical diffusion can be directly observed in comparing case A with cases C/D (Fig. 7). Whereas the graphs for case C and D are very close to each other, those of case A (for the whole galaxy) are situated well below. Comparing cases A, C, and D for 1250 Myr1350 Myr one can derive a roughly linear correlation between total magnetic energy and the diffusion coefficient. Thus, the physical diffusion clearly dominates over the numerical diffusion.
The linearly growing diffusion coefficient also has a non negligible influence on the evolution of the magnetic energy. During the re-accretion phase its maximum of is decreased by a factor 1.4 with respect to for the uniform diffusion coefficient. For later timesteps this factor decreases to a value of 2.3 at the end of the simulations. These factors are slightly lower for the magnetic energy computed only within the disk.
3.3 The influence of the cloud–cloud collision rate
In order to investigate the influence of the cloud–cloud collision rate on the evolution of the total magnetic energy, we have increased the radii of the clouds by a factor 6. This leads to an increase of the number of collisions per unit time of a factor 36. The evolution of the total magnetic energy for the simulations with the high and the low cloud–cloud collision rate is shown in Fig. 8.
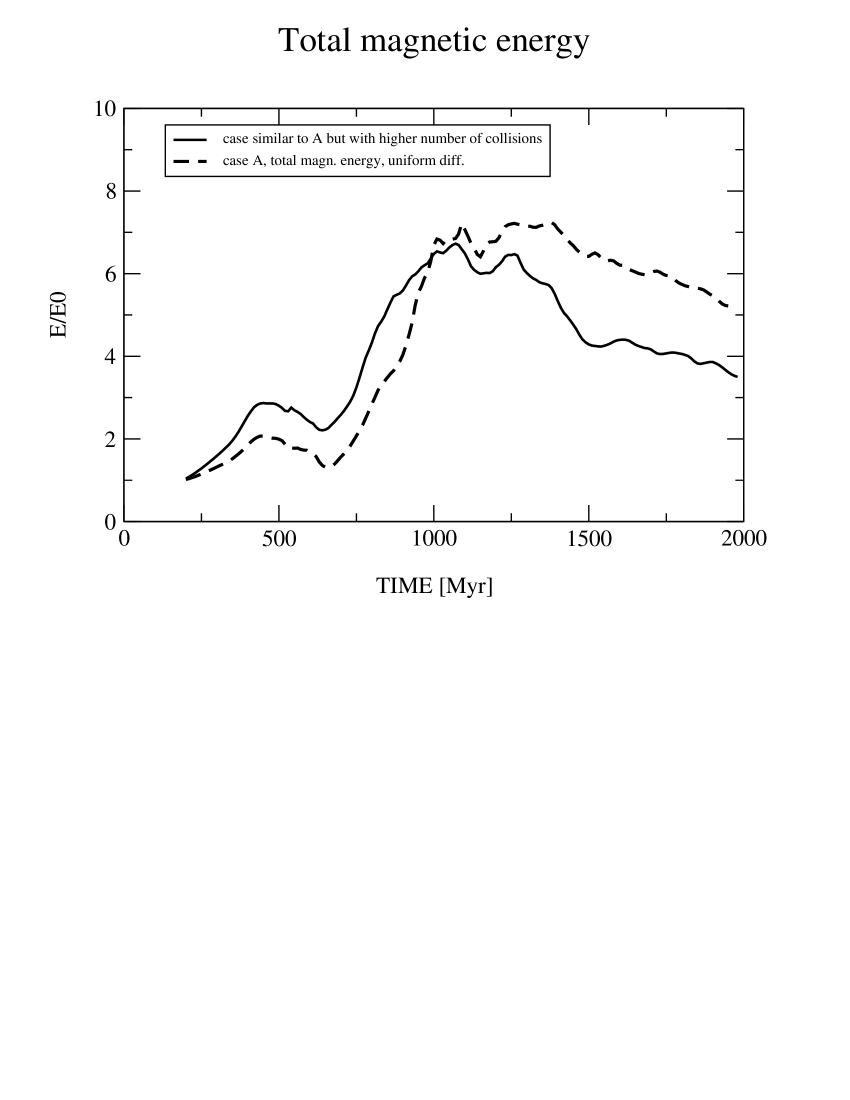
In the case of a high cloud–cloud collision rate (solid line) the magnetic field energy grows faster and to higher values until =450 Myr. This is due to formation of spiral structures within the disk, which is enhanced by a higher cloud–cloud collision rate. For Myr the magnetic energy evolves in the same way as that of the simulation with the low cloud–cloud collision rate, but with an approximately constant offset. At Myr both curves reach the same maximum. For Myr the total energy drops faster in the case of the high cloud–cloud collision rate. Within 500 Myr it decreases by less than half of its maximum value. This decrease is caused by the higher damping of vertical and shear motions due to frequent cloud–cloud collisions.
3.4 Polarization maps
In order to analyze the general properties of the magnetic field we use simulated maps of the polarized intensity (PI), constructed on the basis of our resulting magnetic fields. This process yields the information which can be directly compared with polarized radio continuum observations. We performed it in the way similar to that described in our previous works (e.g. Otmianowska-Mazur et al. 2000, Otmianowska-Mazur et al. 2002). The Stokes parameters I, Q and U are integrated along the line of sight and convolved with an assumed beam of 10 ′′. We then computed maps of polarized intensity and the angles of polarization B-vectors.
At selected time steps (see Fig. 9) of our model we construct maps of the radio polarization intensity (PI) with the inclination of (face-on) to the sky plane. We use the density distribution of relativistic electrons that has the form
| (4) |
where is the radial distance to the galaxy center and is the vertical distance from the midplane of the disk. We set =10 kpc and =1 kpc. The distance of the galaxy is assumed to be 34 Mpc. Thus, one arcminute roughly corresponds to one kpc. The beamsize is 10′′. The PI maps of model A with high and low cloud–cloud collision rates are very similar. We show the polarized intensity together with the polarization B vectors and the gas surface density in Fig. 9 for model A with the uniformly distributed diffusion and the low cloud–cloud collision rate.
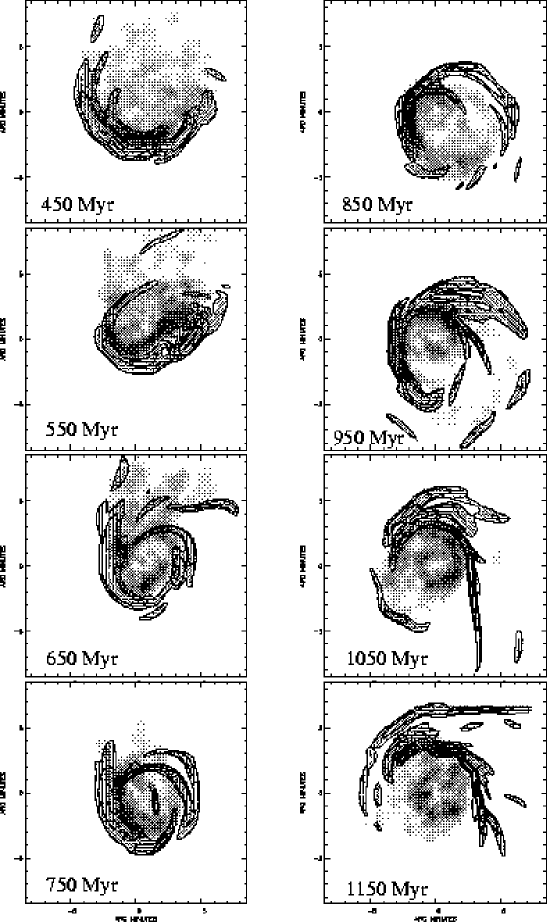
We will focus here only on the brightest PI emission features that arise from the ICM–ISM interaction. They can directly be compared with radio continuum observations of cluster galaxies. At =450 Myr the gas is compressed in the south-east leading to an excess of density in the gas and a bright ridge of polarized emission. This ridge is symmetric and has the form of a half-ring. The offset in our model snapshot is again a numerical artifact due to the gradient of the smoothing length at the edge of the galaxy’s gas distribution (cf. Sect. 3.1.1).
Shortly after the galaxy’s nearest approach to the cluster center (=550 Myr) the accelerated arm is formed in the west. It is again accompanied by a ridge of the strong polarized emission, which has its maximum in the west of the galaxy center. Again, the PI emission maximum is shifted outward in comparison with the maximum of the gas surface density.
At =650 Myr the re-accretion phase begins and the gas falls back onto the disk in the north-east of the galaxy. In the east, where the gas hits the galactic disk, a strong polarized emission region forms. We observe also ridges of PI at the interface between the infalling and galactic gas in the north. In addition, one can still observe a polarized intensity ridge in the west, that represents the maximum PI emission. Both features form an incomplete ring structure.
This ring structure becomes more complete and symmetric at =750 Myr with the maximum of PI located in the east of the disk being again slightly shifted outward with respect to the maximum of the gas surface density. This shift is real, because it is caused by backfalling gas that hits the disk in this region.
At =850 Myr the gaseous clouds re-accrete form the north and hit the disk in the north-east. The ring structure in PI that is observed at =750 Myr has now expanded. It becomes weaker where the expanding shell forms. The PI maximum is located in the north-east. A gas shell starts to expand to the south-west partly accompanied by the polarized intensity.
At the timestep of =950 Myr a large and extended region of PI forms in the north-west where the gas of the expanding shell flows back onto the galactic disk. Most of the flux in polarized emission is located in the north of the galaxy. The most southern PI maximum is located where the expanding shell is anchored.
This north–western region of the extended polarized emission moves in the direction of rotation and appears in the north of the galaxy at =1050 Myr. One can still observe a residual ridge of PI in the south-east and a new narrow feature of PI running north-south.
For the evolution of the PI, one can again distinguish two different evolutionary phases: (i) the compression phase and (ii) the re-accretion phase. While the ridges of maximum PI are mainly caused by the compression for 600 Myr, they are amplified due to shear via re-accretion for 600 Myr. Whereas the maxima of polarized emission should coincide with the maxima of the gas surface density in the compression phase, they can be located outside in the re-accretion phase.
4 Discussion
Our numerical experiment clearly indicates that the magnetic field is amplified in the whole disk and even outside the galaxy during the whole period of the evolution. There are several physical processes responsible for this fact. In the first phase, when the galaxy moves through the ICM, the mechanism of a strong compression takes place at the windward side of the galaxy. The azimuthal component of the magnetic field is easily amplified in this process, but also a radial component is created due to wavy gas motions (see Fig. 2 left panel). At later times of the galaxy evolution this radial field is transformed by the differential rotation into an azimuthal field (similarly to the MHD dynamo). This represents the most effective process of magnetic field growth. The re-accretion phase is much more complicated than the compression phase. The presence of very violent inflows and outflows, shears connected with them and a differential rotation (resulting in the reproduction of azimuthal field) gives again possibility of an efficient increase of the total magnetic energy. Inflowing gas moves in a spiral-like manner towards the disk forming strong magnetic field outside the disk and gaseous maxima at the interface with the disk gas.
In order to explain a complicated picture of relations of the velocity and magnetic field relations we present different velocity components as vectors projected onto the magnetic field strength shown as a grey-plot. Fig. 10 shows the galactic plane at the time step of =450 Myr (the wind compression phase), while Fig. 11 presents two perpendicular cuts of the box at =650 Myr (the re-accretion period). We choose the same time steps as in Fig. 1 and Fig. 3. Our modeled velocity is extrapolated into the whole box in order to avoid too strong velocity gradients in our calculations. This is the only way to avoid an artificial shear at the edges of the galaxy’s gas distribution.
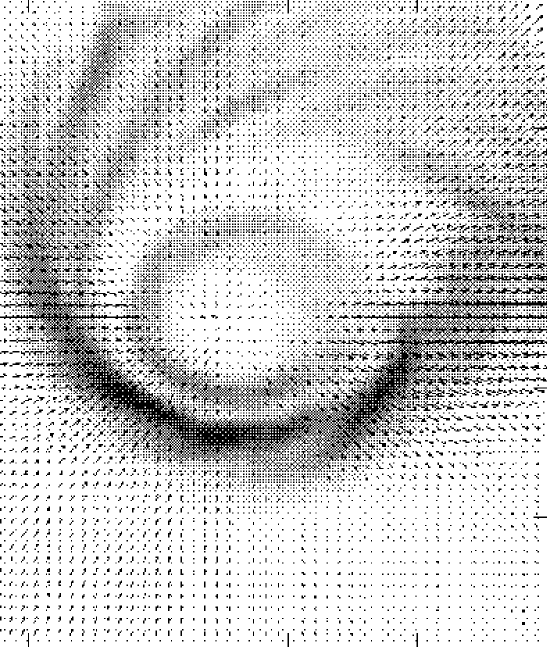
The radial velocity (Fig. 10) serves as the best indicator of compression regions, where the strong gradients of this velocity component are observed. One of them is visible at the south-east part of the galaxy and is placed in the direction of the wind causing the formation of the magnetic field maximum in the central part of this quarter (near the gaseous arm in Fig. 1, left panel). Above this region in the the north-eastern part of the map one can see the radial velocity, which is related to a gas flow from the north. A part of the gas is swept from the galaxy to the west. The presented radial velocity component creates a radial magnetic field component. The differential rotation transforms this radial component into an azimuthal field and amplifies in this way the magnetic stripes occuring in this region. West of the galaxy center the radial velocity shows strong outflow of gas. The magnetic field there is amplified due to the same mechanism: strong compression causes the creation of a radial magnetic field component. The differential rotation transforms it into a toroidal component amplifying the already existing toroidal magnetic field. (cf. Fig. 1, left panel).
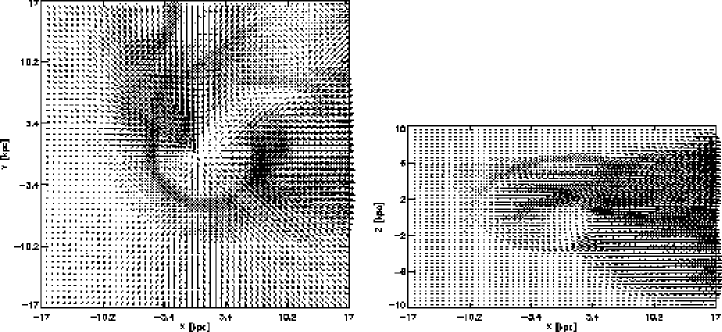
In order to present processes of magnetic field amplification connected with the re-accretion period, the left panel of Fig. 11 shows the radial velocity component vectors in the plane of the disk at the beginning of the re-accretion phase (=650 Myr). The strong radial velocity connected with the wind is not longer present south-east of the galaxy. In the south-west the gas is moving outwards. This is the beginning of the shell expansion. The velocities of the back-falling counter-rotating arm are not visible, because this arm is not located within the disk plane. In the north the gas falls onto the galactic disk causing the formation of large number of magnetic maxima there.
The right panel of Fig. 11 presents velocity vectors in the - plane of the modeled box. At the east the magnetic field is amplified by the flow. In the lower right quarter of the image the velocity vectors are almost parallel to the disk, whereas those of the upper right quarter point towards the disk plane. Such a complicated velocity picture should be studied with a detailed analysis of the 3D flow, in order to investigate which mechanism (compression, shear, inflow, outflow) is responsible for the magnetic field amplification.
The most interesting and new result of our calculations is the growth of the total magnetic energy during the phase of re-accretion. We found that the total magnetic energy grows up to a few times its initial value (cf. Fig. 7) within the thick disk. Three processes are responsible for this growth: (i) compression of magnetic field by re-accreting gas, (ii) enhancement of magnetic field due to shearing motions, and (ii) a new kind of dynamo mechanism: the re-accreting material has important velocities in the radial and the vertical direction. Together with the differential rotation the galaxy’s velocity field becomes very complex. For Myr large gas loops are formed in the halo with heights up to several kpc. The magnetic field associated with them has an important poloidal component. The differential rotation in the disk creates the toroidal component of the magnetic field from the poloidal component (see Ruzmaikin et al. 1988). This may constitute a mechanism of the magnetic field generation. Thus, we find a new kind of the dynamo working in cluster galaxies, which have undergone a ram pressure event and are now in the phase of re-accretion.
The modeled polarization maps show a characteristic evolution of the distribution of the polarized intensity (PI). This evolution can be divided into two distinct phases:
-
•
the compression phase and
-
•
the re-accretion phase.
During the compression phase the maximum of the PI should coincide with the maximum of the gas surface density. This is not necessarily the case during the re-accretion phase. Thus, the polarized radio continuum emission could represent a tool to discriminate between different evolutionary stages of a cluster galaxy that undergoes or has undergone an ICM–ISM interaction. Together with the gas distribution and velocity field the PI distribution gives an important additional constraint on dynamical models. We plan to check this hypothesis in our future study. Observationally two Virgo galaxies that were observed in PI with the VLA at 2.8 cm and 6 cm (NGC4254: Soida et al. 1996 and NGC4522: Vollmer et al. in prep.). Both show asymmetric ridges of PI. Our future project is to compare the modeled PI maps to the high-frequency (Faraday rotation-free) polarized radio emission observations of Virgo cluster galaxies.
5 Conclusions
The evolution of the large-scale galactic magnetic field in a cluster galaxy undergoing an intracluster – interstellar interaction is investigated using 3D numerical simulations. In order to solve the induction equation (Eq. 1) we use velocity fields resulting from an N-body, sticky particle code including ram pressure effects (Vollmer et al. 2001).
We considered the general problem of magnetic field evolution in galaxies interacting with the ICM. Two experiments are performed with different values of magnetic diffusion. The classical -effect has not been involved in our computations. We perform the simulations of a galaxy, which is mildly HI deficient after the stripping event, as a representative model of the N-body calculations. This simulation presents the most characteristic features of magnetic field evolution during and after an ICM–ISM interaction.
The modeled magnetic fields are used to construct maps of the distribution of polarized radio continuum emission, which can be directly compared to observations.
We find that:
-
•
interactions with the intracluster medium (i.e. the galaxy motion with respect to the ambient medium) lead to the formation of a heavy spiral arm along with a strong magnetic field concentration, on the disk windward side. On the other side of the disk the gaseous and magnetic arms stretch away from the disk center.
-
•
Due to the gas re-accretion after the stripping event the vertical magnetic fields arise, forming fragments of a large-scale poloidal field, resembling those created by a dynamo process.
-
•
Due to the ICM–ISM interaction, the total magnetic energy in cluster galaxies, which are affected by ram pressure, grows without any dynamo action. The interaction with the ambient gas may serve as a magnetic field amplification process in cluster spirals.
-
•
The distribution of polarized radio continuum emission shows characteristic features during the galaxy evolution within the cluster. The comparison of maps of polarized radio continuum emission with our simulations will help to determine the evolutionary stage of a galaxy that undergoes an ICM–ISM interaction. It will also serve as an important additional constraint on dynamical modeling of ICM–ISM interactions.
Acknowledgements.
The authors express their attitude to Prof. Chantal Balkowski and Prof. Marek Urbanik for helpful discussions. K.O.-M. and B.V. thank Dr. Marian Soida for a detailed discussion of the polarization maps. This work was partly supported by a grant from the Polish Committee for Scientific Research (KBN), grant no. 0249/P03/2001/21.References
- (1) Abadi, M.G., Moore, B., & Bower, R.G. 1999, MNRAS, 308, 947
- (2) Balsara, D., Livio, M., & O’Dea, C.P. 1994, ApJ, 437, 83
- (3) Bravo-Alfaro H., Cayatte V., van Gorkom J.H., & Balkowski C. 2000, AJ, 119, 580
- (4) Cayatte V., Kotanyi C., Balkowski C, & van Gorkom J.H. 1994, AJ, 107, 1003
- (5) Chyży K.T., Soida M., Urbanik M., Beck R., 2001, in Proc. 24th General Assembly of IAU, Manchester 7-18 August 2000, in press.
- (6) Combes F., Dupraz C., Casoli F., & Pagani L. 1988, A&A, 203, L9
- (7) Elstner D., Otmianowska-Mazur K., v. Linden S., Urbanik M.: 2000, A&A 357, 129
- (8) Gaetz, T.J., Salpeter, E.E., & Shaviv G. 1987, ApJ, 316, 530
- (9) Otmianowska-Mazur K., von Linden, S., Lesch, H., Skupniewicz, G., 1997, A&A, 323, 56
- (10) Otmianowska-Mazur K., Chyży K., Soida M.: 2000, A&A 359, 29
- (11) Otmianowska-Mazur K., Elstner D., Soida M., Urbanik M., 2002, A&A, 384, 48
- Parker (1979) Parker, E.N.: 1979, Cosmical Magnetic Fields, Oxford
- (13) Ruzmaikin A.A., Shukurov A.M., & Sokoloff D.D. 1988, Magnetic Fields of Galaxies, Astrophysics and space science library, Vol. 133, Kluwer Academic Publishers
- (14) Schulz S. & Struck C. 2001, MNRAS, 328, 185
- (15) Soida M., Urbanik M., & Beck R. 1996, A&A, 312, 409
- (16) Solanes J., Manrique A., Garc a-Gómez C., González-Casado G., Giovanelli R., & Haynes M.P. 2001, ApJ, 548, 97
- (17) Stone J.M., Norman M.L., 1992a, ApJS 80, 791
- (18) Stone, J. M., Norman, M. L., 1992b, ApJS, 80, 791
- (19) Takeda, H., Nulsen, P.E.J., & Fabian, A.C. 1984, MNRAS, 208, 261
- (20) Tosa, M. 1994, ApJ, 426, L81
- (21) Vollmer B., Cayatte V., Balkowski C., & Duschl W.J. 2001, ApJ, 561, 708