A Radio Flare from GRB 020405: Evidence for a Uniform Medium Around a Massive Stellar Progenitor
Abstract
We present radio observations of GRB 020405 starting 1.2 days after the burst, which reveal a rapidly-fading “radio flare”. Based on its temporal and spectral properties, we interpret the radio flare as emission from the reverse shock. This scenario rules out a circumburst medium with a radial density profile expected around a mass-losing massive star, since in that case the reverse shock emission decays on the timescale of the burst duration s. Using published optical and X-ray data, along with the radio data presented here, we further show that a self-consistent model requires collimated ejecta with an opening angle, ( day). As a consequence of the early jet break, the late-time ( day) emission measured with the Hubble Space Telescope significantly deviates from an extrapolation of the early, ground-based data. This, along with an unusually red spectrum, , strengthens the case for a supernova that exploded at about the same time as GRB 020405, thus pointing to a massive stellar progenitor for this burst. This is the first clear association of a massive progenitor with a uniform medium, indicating that a profile is not a required signature, and in fact may not be present on the lengthscales probed by the afterglow in the majority of bursts.
1 Introduction
Over the past few years several indirect lines of evidence have emerged in favor of massive stars as the progenitors of long-duration gamma-ray bursts (GRBs). These include the distribution of offsets of GRBs from their host centers (Bloom, Kulkarni & Djorgovski, 2002), the absence of optical afterglows from dark GRBs (Djorgovski et al., 2001; Piro et al., 2002), high column densities toward several GRBs (Galama & Wijers, 2001), and the inference of very high star formation rates in several GRB host galaxies (Berger, Kulkarni & Frail, 2001; Frail et al., 2002; Berger et al., 2002).
Perhaps the most convincing evidence comes from the detection of late-time ( days) red bumps dominating the optical emission from several afterglows (e.g. Bloom et al. 1999). While several interpretations of these bumps have been suggested (Esin & Blandford, 2000; Waxman & Draine, 2000; Ramirez-Ruiz et al., 2001; Reichart, 2001), the preponderance of spectral and temporal evidence (e.g. Bloom et al. 2002; Garnavich et al. 2002) indicates that these bumps are due to radioactive Nickel emission from supernovae (SNe) accompanying the bursts. These observations lend support to the collapsar model (Woosley, 1993; MacFadyen & Woosley, 1999), in which the core of a massive star collapses to a black hole, which then accretes matter and powers the GRB, while the rest of the star produces a supernova.
A seemingly unavoidable consequence of this scenario is that the GRB ejecta should expand into a medium modified by mass loss from the progenitor star. To first order, the expected density profile is , arising from constant mass loss rate and wind velocity. Extensive efforts have been made to find evidence for such a density profile based on broad-band observations of the afterglow emission (e.g. Chevalier & Li 2000; Berger et al. 2000; Panaitescu & Kumar 2002). Unfortunately, these studies have been inconclusive in distinguishing between a wind density profile and a medium with uniform density, due in part to the lack of early observations (particularly in the radio and submillimeter bands) and the degeneracy between dust extinction and the intrinsic spectral slope in the optical and near-IR bands. Thus, the signature of stellar mass loss remains the elusive missing link in the association of GRBs and massive stars.
To date, the single exception to this disappointing trend is GRB 011121, which provides strong evidence for a circumburst medium shaped by a stellar wind (Price et al., 2002), and an accompanying SN (Bloom et al., 2002; Garnavich et al., 2002). The reason for these unambiguous results is the combination of exquisite Hubble Space Telescope (HST) observations, extensive near-IR data, and dual-band radio data.
More recently, Price et al. (2002) presented the -ray properties and redshift () of GRB 020405, along with multi-band ground-based and HST optical observations. The observations between 15 and 65 days after the burst reveal a red bump (with a spectrum ) brighter than an extrapolation of the early data. Price et al. (2002) interpret this emission as coming from a SN accompanying the burst, but note that the statistical significance of this result depends on the degree of collimation of the GRB ejecta. This is because a more collimated outflow results in an earlier steepening of the afterglow lightcurves, and hence a more significant deviation at late time.
In this paper we present radio observations of GRB 020405, which point to a uniform density circumburst medium. We also show that the radio, optical, and X-ray data require an early jet break, which significantly strengthens the SN interpretation for the late-time emission. Combining these two results we conclude that a density profile is not a required signature of a massive stellar progenitor.
2 Radio Observations
Very Large Array (VLA111The VLA is operated by the National Radio Astronomy Observatory, a facility of the National Science Foundation operated under cooperative agreement by Associated Universities, Inc.) observations were initiated 1.2 days after the burst using the standard continuum mode with MHz contiguous bands. A log of all observations is given in Table 1. We used the extra-galactic source 3C 286 (J1331+305) for flux calibration, while the phase was monitored using J1356343. The data were reduced and analyzed using the Astronomical Image Processing System (Fomalont, 1981).
3 Reverse Shock Emission in the Radio Band
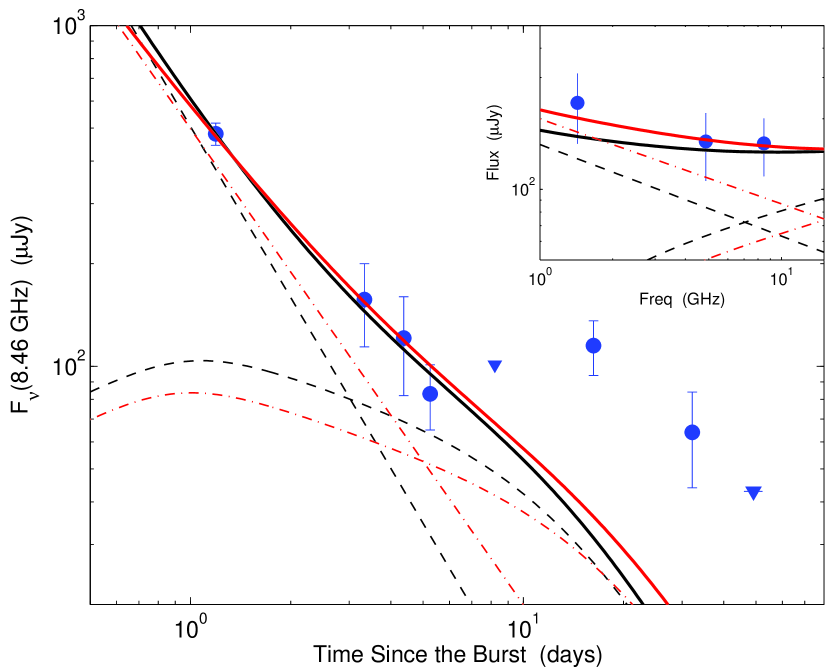
In Figure 1 we plot the 8.46 GHz lightcurve of GRB 020405, as well as the radio spectrum between 1.43 and 8.46 GHz on day 3.3. The early emission is characterized by two important features. First, it is brightest ( mJy) during the first observation ( days), and rapidly fades, , between and days. Second, the spectral index between 1.43 and 8.46 at days is , and similarly at days based on the 8.46 and 22.5 GHz data.
The rapid fading and negative spectral slope are atypical for emission from the forward shock on the timescale of 1 day. In fact, for typical parameters, the radio band, , lies well below the peak of the synchrotron spectrum at early time, GHz (Sari & Esin, 2001); here and are the fractions of shock energy carried by the magnetic fields and electrons, respectively, and is the afterglow kinetic energy. In this regime, the spectrum is (or if , the synchrotron self-absorption frequency; Sari, Piran & Narayan 1998). As a result, the early radio flux is expected to either increase, as or (Sari, Piran & Narayan, 1998; Chevalier & Li, 2000), be flat (Chevalier & Li, 2000), or decay as (Sari, Piran & Halpern, 1999), followed by a steep decline as to when crosses the radio band. This behavior is observed in the most radio afterglows (e.g. Berger et al. 2000). Since the early radio emission from GRB 020405 does not follow this general trend, we conclude that it did not arise from the forward shock.
Instead, we interpret the observed emission as coming from a reverse shock (Meszaros & Rees, 1997; Sari & Piran, 1999) plowing back into the relativisitic ejecta. Similar “radio flares” have been observed in several afterglows (Kulkarni et al., 1999; Frail et al., 2000; Djorgovski et al., 2001), in particular from GRB 990123 where the flare was shown to be the low-energy tail of the mag optical flash observed at s (Kulkarni et al., 1999; Sari & Piran, 1999). In all cases in which a radio flare has been observed, the emission had similar properties to that from GRB 020405, namely a bright ( mJy) flux measured at early time ( day) followed by a rapid decline.
Hydrodynamical studies of the reverse shock (e.g. Kobayashi & Sari 2000) have shown that the radio emission depends on the properties of the ejecta and circumburst medium. In particular, the main implication of the radio flare from GRB 020405 is that it effectively rules out a circumburst medium with a density profile (hereafter, Wind). Chevalier & Li (2000) have shown that in a Wind environment, with typical afterglow parameters, the cooling frequency of the reverse shock, Hz, is significantly lower than its characteristic frequency, Hz. Thus, the emission peaks at , with a flux, Jy, independent of time until the reverse shock crosses the shell at s (Chevalier & Li, 2000); here light seconds is the initial width of the shell. Following the shell crossing, electrons are no longer accelerated, and since the reverse shock is highly radiative () the emission decays exponentially. Thus, strong emission from the reverse shock at days is not expected in a Wind environment, indicating that the early radio emission from GRB 020405 requires a circumburst medium with uniform density (hereafter, ISM).
In addition, based on the flat spectral slope between and GHz measured at days, we conclude that for both the reverse and forward shocks GHz. Otherwise, the emission from the reverse shock would be severely attenuated over this frequency range by the forward shock, , resulting in a significantly steeper spectrum; here is the synchrotron optical depth.
4 Uniform Density Models for the Afterglow Emission
Using the conditions inferred in §3 we model the radio, optical, and X-ray data with a model describing self-consistently the time evolution of the forward and reverse shocks in a uniform density medium. We consider the optical data only at days since the emission at later times is dominated by a much redder component, possibly a SN (Price et al., 2002). We return to this point in §5.
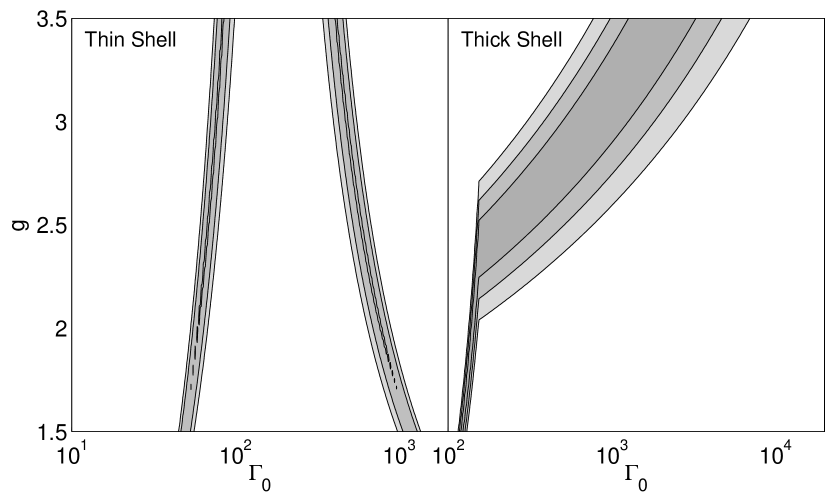
The time evolution of the reverse shock spectrum ( for and for ) is described by , , and the time of peak emission, (Kobayashi & Sari, 2000); here s is the duration of GRB 020405 (Price et al., 2002), , is the initial Lorentz factor, and is the circumburst density. The parameter describes the evolution of the reverse shock Lorentz factor, , and the limits correspond to adiabatic expansion () and pressure equilibrium between the forward and reverse shocks (). To evaluate , , and we use the physical parameters of the ejecta and circumburst medium as inferred from the forward shock emission (see below and Table 2), in conjunction with equations 7–9 of Kobayashi (2000) for the thick shell case (i.e. when the reverse shock is relativistic and effectively decelerates the shell), and equations 15–17 for the thin shell case (i.e. when the reverse shock cannot decelerate the shell effectively). We set the nominal values of and for the thin and thick shell cases, respectively. Thus, the only free parameter of the reverse shock emission is .
For the forward shock we use the time evolution of the synchrotron spectrum in the appropriate regime (i.e. spherical ISM for : Sari, Piran & Narayan 1998, and an expanding jet for : Sari, Piran & Halpern 1999); here , the jet break time, is the epoch at which , and is the half opening angle of the jet. To account for possible extinction within the host galaxy, , we use the parametric extinction curves of Cardelli, Clayton & Mathis (1989) and Fitzpatrick & Massa (1988), along with the interpolation calculated by Reichart (2001).
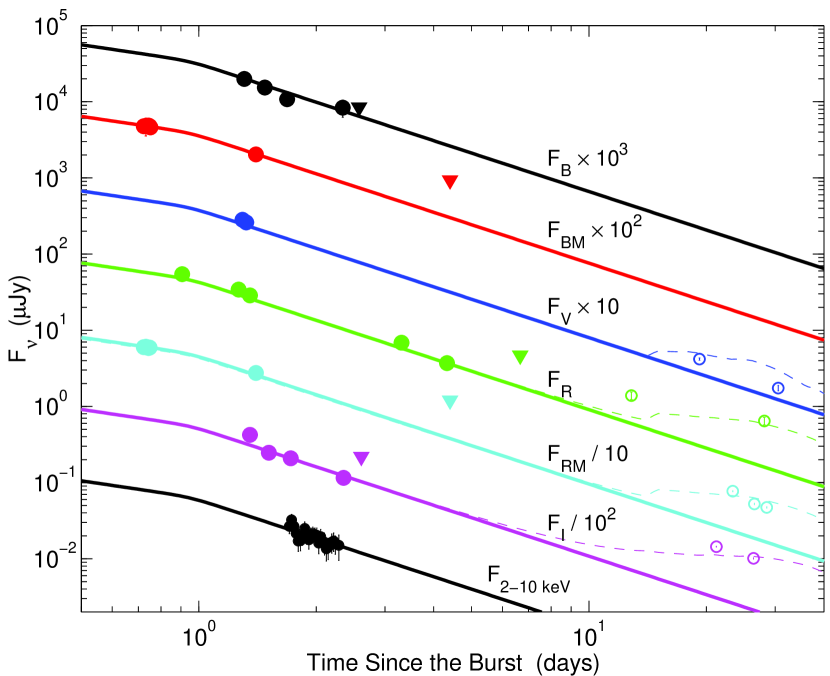
The results of the two models (thin and thick shell cases) are shown in Figures 1 and 2, and summarized in Table 2. We find that both models provide an equally adequate fit (with per degree of freedom), but is not well constrained, (Figure 3).
More importantly, both models require collimated ejecta with day (hereafter, Jet). Models with a significantly wider collimation angle have per degree of freedom, primarily because they underestimate the flux in the X-ray band by a factor of about , and cannot explain the radio and optical emission simultaneously.
At the same time, the Jet models underestimate the radio flux at days by about on day 16.3, and about on day 32. This is due to an apparent brightening of the radio emission on this timescale. Since in the radio band , one possible explanation for the brightening is that the forward shock encounters a density enhancement; a density increase by a factor of ten is required. The flux in the optical bands would remain largely unaffected since (see Table 2), in which case the flux is independent of density.
Using the parameters of the forward shock emission we calculate erg, , , and cm-3 using equations 4.13–4.16 of Sari & Esin (2001). The opening angle of the jet is (Frail et al., 2001). Using this value we find a beaming corrected -ray emergy, erg (Price et al., 2002), typical for long-duration GRBs (Frail et al., 2001), and a beaming corrected kinetic energy, erg, lower than the typical inferred values of to erg (Panaitescu & Kumar, 2002).
5 Implications for the Progenitor of GRB 020405 and GRB Circumburst Environments
In the previous section we did not consider the optical emission at days since it has a distinct spectrum, , compared to for the early afterglow data. Moreover, the predicted brightness of the afterglow at late time is lower by a factor of about in the and bands compared to the flux measured with HST (Figure 2). These two observations indicate that the late-time emission comes from a separate component.
Price et al. (2002) interpreted this emission as coming from a supernova that occured at about the same time as the burst. However, they note that the significance of this conclusion depends sensitively on the time of the jet break. Based solely on the optical data, these authors were unable to significantly constrain . However, our combined radio, optical, and X-ray model with day indicates that the SN interpretation is secure.
We gain further confidence about this interpretation by comparing the late-time emission to the optical emission from the Type Ic SN 1998bw (Galama et al., 1998). In Figure 2 we plot the combined emission from the afterglow of GRB 020405 and SN 1998bw redshifted to . We correct the SN lightcurves for Galactic extinction, mag (Schlegel, Finkbeiner & Davis, 1998), as well as extinction within the host galaxy as determined in §4. While SN 1998bw does not provide a perfect fit to the data, the level of agreement is remarkable given that there are other effects at play (e.g. an earlier decay for a fainter luminosity; Iwamoto et al. 1998).
The conclusion that GRB 020405 was accompanied by a supernova indicates that the progenitor must have been a massive star. However, we also demonstrated that the circumburst density profile is uniform, at least in the range to cm. This is the first case in which a massive progenitor and a uniform ambient medium have been associated directly, leading us to conclude that a strong density gradient, , on the lengthscales probed by the afterglow is not a required signature of a massive stellar progenitor. In fact, this may explain why the signature of stellar mass loss has not been observed in the majority of afterglows.
The uniform medium around the progenitor of GRB 020405 does not imply that the progenitor did not lose mass. In fact, it has been previously suggested that a relatively uniform medium can occur downstream from the wind termination shock (Ramirez-Ruiz et al., 2001). This region can extend out to cm. In addition, a density enhancement is expected at the termination shock, which can explain the increased radio flux at days compared to the Jet model predictions (§4).
6 Conclusions
We showed that the early radio emission from GRB 020405 was dominated by the reverse shock, and that this directly implies a uniform circumburst medium. The same conclusion holds for all bursts in which radio flares have been detected on the timescale of day. The broad-band data indicate that the ejecta underwent a jet break at day (i.e. ), resulting in a significant deviation of the late-time optical emission measured with HST from an extrapolation of the model. Combined with the spectral properties of the late emission, and a reasonable agreement with the optical emission of SN 1998bw, this indicates that GRB 020405 was accompanied by a supernova. Thus, the progenitor of this burst was a massive star.
The association of a massive stellar progenitor with a uniform circumburst medium indicates that the tedious search for a density profile may have been partly in vain. It appears that a Wind profile does not necessarily accompany every GRB, and in fact may not be the case for the majority of bursts. This result, in conjunction with the inferred Wind medium for GRB 011121 which was also accompanied by a supernova, indicates that the circumburst environments of GRBs are more diverse than the simple assumption of constant mass loss rate and wind velocity; the interaction of the wind with the local environment may play a significant role. Deeper insight into the structure of the circumburst medium requires rapid localizations and dense, multi-band follow-up.
References
- Berger et al. (2002) Berger, E., Cowie, L. L., Kulkarni, S. R., Frail, D. A., Aussel, H., and Barger, A. J. 2002, ApJ (in press), astro-ph/0210645.
- Berger, Kulkarni & Frail (2001) Berger, E., Kulkarni, S. R., and Frail, D. A. 2001, ApJ, 560, 652.
- Berger et al. (2000) Berger, E. et al. 2000, ApJ, 545, 56.
- Bloom, Kulkarni & Djorgovski (2002) Bloom, J. S., Kulkarni, S. R., and Djorgovski, S. G. 2002, AJ, 123, 1111.
- Bloom et al. (1999) Bloom, J. S. et al. 1999, Nature, 401, 453.
- Bloom et al. (2002) Bloom, J. S. et al. 2002, ApJ, 572, L45.
- Cardelli, Clayton & Mathis (1989) Cardelli, J. A., Clayton, G. C., and Mathis, J. S. 1989, ApJ, 345, 245.
- Chevalier & Li (2000) Chevalier, R. A. and Li, Z. 2000, ApJ, 536, 195.
- Djorgovski et al. (2001) Djorgovski, S. G., Frail, D. A., Kulkarni, S. R., Bloom, J. S., Odewahn, S. C., and Diercks, A. 2001, ApJ, 562, 654.
- Esin & Blandford (2000) Esin, A. A. and Blandford, R. 2000, ApJ, 534, L151.
- Fitzpatrick & Massa (1988) Fitzpatrick, E. L. and Massa, D. 1988, ApJ, 328, 734.
- Fomalont (1981) Fomalont, E. 1981, NEWSLETTER. NRAO NO. 3, P. 3, 1981, 3, 3.
- Frail et al. (2000) Frail, D. A. et al. 2000, ApJ, 538, L129.
- Frail et al. (2002) Frail, D. A. et al. 2002, ApJ, 565, 829.
- Frail et al. (2001) Frail, D. A. et al. 2001, ApJ, 562, L55.
- Galama et al. (1998) Galama, T. J. et al. 1998, Nature, 395, 670.
- Galama & Wijers (2001) Galama, T. J. and Wijers, R. A. M. J. 2001, ApJ, 549, L209.
- Garnavich et al. (2002) Garnavich, P. M. et al. 2002, ApJ (submitted), astro-ph/0204234.
- Iwamoto et al. (1998) Iwamoto, K. et al. 1998, Nature, 395, 672.
- Kobayashi (2000) Kobayashi, S. 2000, ApJ, 545, 807.
- Kobayashi & Sari (2000) Kobayashi, S. and Sari, R. 2000, ApJ, 542, 819.
- Kulkarni et al. (1999) Kulkarni, S. R. et al. 1999, ApJ, 522, L97.
- MacFadyen & Woosley (1999) MacFadyen, A. I. and Woosley, S. E. 1999, ApJ, 524, 262.
- Meszaros & Rees (1997) Meszaros, P. and Rees, M. J. 1997, ApJ, 476, 232.
- Panaitescu & Kumar (2002) Panaitescu, A. and Kumar, P. 2002, ApJ, 571, 779.
- Piro et al. (2002) Piro, L. et al. 2002, ApJ, 577, 680.
- Price et al. (2002) Price, P. A. et al. 2002a, ApJ, 572, L51.
- Price et al. (2002) Price, P. A. et al. 2002b, ApJ (submitted), astro-ph/0208008.
- Ramirez-Ruiz et al. (2001) Ramirez-Ruiz, E., Dray, L. M., Madau, P., and Tout, C. A. 2001, MNRAS, 327, 829.
- Reichart (2001) Reichart, D. E. 2001, ApJ, 554, 643.
- Sari & Esin (2001) Sari, R. and Esin, A. A. 2001, ApJ, 548, 787.
- Sari & Piran (1999) Sari, R. and Piran, T. 1999a, ApJ, 517, L109.
- Sari & Piran (1999) Sari, R. and Piran, T. 1999b, ApJ, 520, 641.
- Sari, Piran & Halpern (1999) Sari, R., Piran, T., and Halpern, J. P. 1999, ApJ, 519, L17.
- Sari, Piran & Narayan (1998) Sari, R., Piran, T., and Narayan, R. 1998, ApJ, 497, L17+.
- Schlegel, Finkbeiner & Davis (1998) Schlegel, D. J., Finkbeiner, D. P., and Davis, M. 1998, ApJ, 500, 525.
- Waxman & Draine (2000) Waxman, E. and Draine, B. T. 2000, ApJ, 537, 796.
- Woosley (1993) Woosley, S. E. 1993, ApJ, 405, 273.
| Epoch | Flux Density | ||
|---|---|---|---|
| (UT) | (days) | (GHz) | (Jy) |
| Apr 6.22 | 1.19 | 8.46 | |
| Apr 6.25 | 1.22 | 22.5 | |
| Apr 8.36 | 3.33 | 8.46 | |
| Apr 8.38 | 3.35 | 4.86 | |
| Apr 8.40 | 3.37 | 1.43 | |
| Apr 8.42 | 3.39 | 22.5 | |
| Apr 9.40 | 4.37 | 8.46 | |
| Apr 10.28 | 5.25 | 8.46 | |
| Apr 13.24 | 8.21 | 8.46 | |
| Apr 21.28 | 16.3 | 8.46 | |
| May 7.20 | 32.2 | 8.46 | |
| May 21.12 | 46.1 | 8.46 | |
| May 24.13 | 49.1 | 8.46 | |
| May 27.17 | 52.1 | 8.46 | |
| May 21.12–27.17 | 46.1–52.1 | 8.46 |
Note. — The columns are (left to right), (1) UT date of each observation, (2) time since the burst, (3) observing frequency, and (4) flux density at the position of the radio transient with the rms noise calculated from each image. The last row gives the flux density at 8.46 GHz from a co-added map of the data from May 21–27.
| Parameter | Thin Shell | Thick Shell |
|---|---|---|
| (Hz) | ||
| (Hz) | ||
| (Hz) | ||
| (Jy) | ||
| (days) | ||
| (mag) | ||
Note. — Best-fit synchrotron parameters, and the inferred physical parameters for the reverse and forward shock model described in §4. The quoted values for the forward shock are at . We give the results for the thin shell (with ) and thick shell (with ) cases. In both models with fix the value of at 1 GHz based on the flat spectrum in the radio band between 1.4 and 8.5 GHz (§3). a is not well constrained and can take a wide range of values (Figure 3).