Observations of Galactic and Extra-galactic Sources From the BOOMERANG and SEST Telescopes
Abstract
We present millimeter-wave observations of three extra-galactic and six Galactic sources in the Southern sky. Observations were made at 90, 150, 240 and 400 GHz with resolutions of 18, 10, 14 and 12 arcmin respectively during the 1998 Antarctic long duration balloon flight of BOOMERANG. Observations were also made with the SEST telescope, at 90 and 150 GHz with resolutions of 57 and 35 arcsec respectively. These observations can be used for calibrations of Cosmic Microwave Background (CMB) experiments as well as an understanding of the physical processes of the sources.
1 Introduction
Galactic millimeter-wave radiation arises from a combination of synchrotron, free-free and dust emission. Compact millimeter-wave sources in the Galaxy can potentially be used to calibrate observations of the Cosmic Microwave Background (CMB). Southern Galactic sources are particularly useful for CMB observations that take place in the Antarctic, where planets are observed only at low elevation. Previous millimeter-wave observations of Southern Galactic sources have been made by Arnold et al. (1978), Cheung et al. (1980), Cox et al. (1995), Ruhl et al. (1995), and Puchalla et al. (2002). For reviews of radio observations of a subset of our Galactic sources, see e.g. Brooks et al. (1998) and De Pree et al. (1999). Extra-galactic point sources are expected to be an important foreground contaminant of CMB observations (Toffolatti et al 1999, Sokasian et al. 2001).
BOOMERANG is a millimeter-wave telescope and receiver designed to measure anisotropy in the Cosmic Microwave Background (CMB) from the Long Duration Balloon (LDB) platform. BOOMERANG launched from McMurdo station, Antarctica on December 29, 1998 for a 10.5 day flight. The instrument is described in detail in Crill et al. (2002). CMB angular power spectrum results can be found in de Bernardis et al. (2000), Netterfield et al. (2002) and Ruhl et al. (2002). Diffuse dust is discussed in Masi et al. (2001). In addition to observing the CMB, BOOMERANG observed three extra-galactic point sources and six Galactic compact HII regions. The flux measurement of these sources are calibrated with the CMB dipole. Follow-up observations of the three extra-galactic sources and two of the Galactic sources were made using the SEST telescope at La Silla Observatory in Chile, January 8-10, 2000. A list of sources and coordinates are given in Table 1.
2 BOOMERANG Observations and Results
The BOOMERANG telescope features a 1.2m primary mirror and a cryogenic bolometric array receiver. There are two 90 GHz detectors, both with a FWHM of 181 arcmin, six 150 GHz detectors, with FWHMs of 9.20.5, 9.20.5, 9.70.5, 9.40.5, 9.90.5, and 9.50.5 arcmin, three 240 GHz detectors with a FWHM of 14.11 arcmin, and four 400 GHz detectors with a FWHM of 12.11 arcmin. The main lobes of the beams from the 90, 150, and 400 GHz channels are well-characterized by single Gaussians. The 240 GHz beams have a supressed central region, accurately modeled by the superposition of one Gaussian to fit the full beam plus an inverted Gaussian that improves the fit in the central region. Long term random pointing drift does not add significantly to the beam size for the Galactic sources, since each of those observations were made on a short timescale. The extra-galactic sources however, are affected by long-term random pointing drifts, because those observations were made throughout the flight. A pointing uncertainty of 2.5 arcmin rms adds in quadrature to the effective beam size and adds 1.4 arcmin rms to the beam uncertainty for the extra-galactic sources. See Netterfield et al. (2002) for a more detailed discussion of pointing uncertainty. The 90, 150, and 240 GHz channels are calibrated using the CMB dipole, with an uncertainty of 10% to diffuse beam-filling sources. The 400 GHz channels are calibrated using interstellar dust and degree-scale CMB anisotropy, with an uncertainty of 30% (Crill et al. 2002).
Observations with BOOMERANG are made by scanning the telescope at an angular velocity of 2 degrees/sec in azimuth for the first half of the flight and 1 degree/sec in azimuth for the second half of the flight. Interspersed between CMB observations are observations of the Galactic plane. The Galactic sources were observed at the same scan speeds as the CMB observations, but with shorter scans (10 degrees peak-to-peak in azimuth for the source scans vs. 60 degrees peak-to-peak for the CMB scans). In total there were 15 Galactic source scans: one of the Carina Nebula, four of RCW38, four of IRAS1022, five of IRAS08576 and one which included both NGC3603 and NGC3576. Nearly (but not quite) all of the data for all of the detectors was good for each scan; Table 1 lists the number of good observations (which includes the number of good scans and channels) at each frequency. Scans of the Galactic sources were flagged as bad for a particular channel for example if the source was on the edge of the scan in that channel. The extra-galactic sources were observed serendipitously during the CMB scans during the entire flight. The total number of good observations of the extra-galactic sources in Table 1 reflects the number of channels at each frequency in which the source was detected.
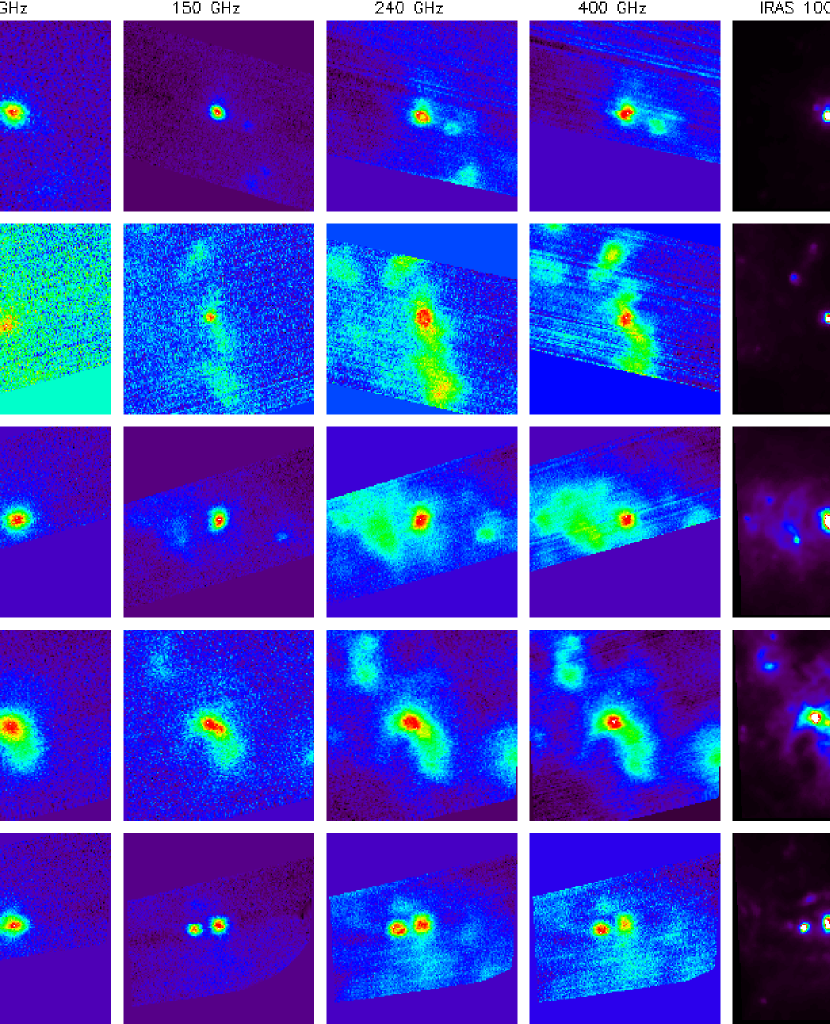
BOOMERANG maps of the Galactic sources are shown in Figure 1. Each of the maps shown are 3 degrees 3 degrees in extent and represent only one channel of data for one scan (approximately 15 minutes of data). Other scans are similar and the total number of observations for each source at each frequency are given in Table 1 The maps are flat space projections centered on the source, with coordinates given by (, )), where (, ) are the Right Ascension and declination of the sources given in Table 1. IRAS 100 maps (data obtained through the Skyview website) of the same regions are included for comparison. From the Galactic source maps, NGC3576 is the most compact of our sources, followed by RCW38. IRAS1022 and especially the Carina Nebula show significant extended emission. IRAS08576 shows significant extended emission along a line; this is unexpected from IRAS 100 data, which shows IRAS08576 as a compact object. In the maps there are bright, compact sources typically surrounded by more diffuse clouds. Fluxes are measured for the bright, compact sources in each map.
The Galactic source maps for each scan and channel are binned in radius around the centroid of the source to obtain the integrated flux as a function of radius. A sample radial flux profile for one source and frequency is shown in Figure 2. Following the notation of Puchalla et al. (2002), we calculate the total integrated flux within radii of 1 and 2 (hereafter 1 and 2 fluxes). The beam size is given by and the FWHMs of the detectors are given above. When computing fluxes for NGC3603 and NGC3576, the companion source is masked out in the map.
Table 2 lists the 1 and 2 fluxes for all sources and frequencies. The flux and uncertainty for the Galactic sources in Table 2 are the mean and standard deviation of all of the good channels and scans at the given frequency. Only the statistical uncertainty is given in the table. Uncertainty in the flux due to calibration is not included. The and flux results are systematically dependent on beam at approximately the 10% and 5% level, respectively. The fluxes are dependent on background subtraction at about the 1% level. The uncertainty in the flux due to the inherent S/N of the data is approximately 2%.
Since the S/N on the extra-galactic sources is much lower than the S/N on the Galactic sources, maps are not used in this analysis; fluxes are computed directly by binning the timestream data in radius, after filtering at 0.2 Hz. Since there are relatively few observations of each source (see Table 1) and since the S/N of each observation is low, weighted means and standard deviations are given in Table 2. Background subtraction systematically affects the 1 and 2 fluxes by about 10% and 25% respectively. Uncertainty in the beam systematically affects the 1 and 2 fluxes by approximately 30% and 25% respectively.
If the flux of the source scales as , then the spectral index, , between frequencies and , is given by:
| (1) |
Spectral indices for the BOOMERANG 1 and 2 fluxes are given in Table 3.
3 Wavelet Analysis of the Extra-galactic Sources
In addition to the analysis in the previous section, a wavelet approach is also used, following Vielva et al. (2001), to evaluate the fluxes and the spectral indices for the three extra-galactic point sources observed by BOOMERANG. The main advantages of using this method are the amplification of the signal to noise ratio and that the result is only sensitive to sources of size equal to or smaller than the beam, so the measured fluxes are much less affected by the background signal.
The isotropic wavelet transform for a two-dimensional map is defined by:
| (2) |
where is the wavelet coefficient of the map associated with a scale and centered at the point . The function is called the wavelet mother function. If the beam profile is Gaussian it is found that Mexican Hat wavelet is the optimal one. The mother function is then
| (3) |
and has zero integral. Substituting eq. 3 into eq. 2, for a point source centered on yields
| (4) |
where is the area under the Gaussian beam, is the beam dispersion and is the flux of the point source. In order to estimate the point source flux, , a multi-scale fit is performed computing the wavelet coefficients of our map, centered in the nominal coordinates of the source, at a number of scales . The results are compared with the theoretical curve given by eq. 4 using the statistic:
| (5) |
where the covariance matrix is computed using real data:
| (6) |
and the average is performed over random positions .
In order to check the effect of a non-Gaussian beam on the results, the analysis has been done on simulated point sources with different beam shapes. The error in the flux recovery is smaller than even for a highly non-Gaussian beam, such as a square or triangular beam, if there is a good estimation of the integrated beam, , in eq. 4.
4 SEST Observations and Results
Point source observations of the three extra-galactic sources and images of the Galactic sources RCW38 and NCG3576 at 90 and 150GHz were made with the SEST telescope at La Silla Observatory in Chile on January 8-10, 2000. The FWHM of the SEST 90 GHz beam is 57 arcsec, the FWHM of the SEST 150 GHz beam is 35 arcsec and the chop is 11 arcmin. Calibration was done using the chopper wheel method. The antenna temperature scale, given in , was converted to a flux density scale through observations of planets (SEST web page).
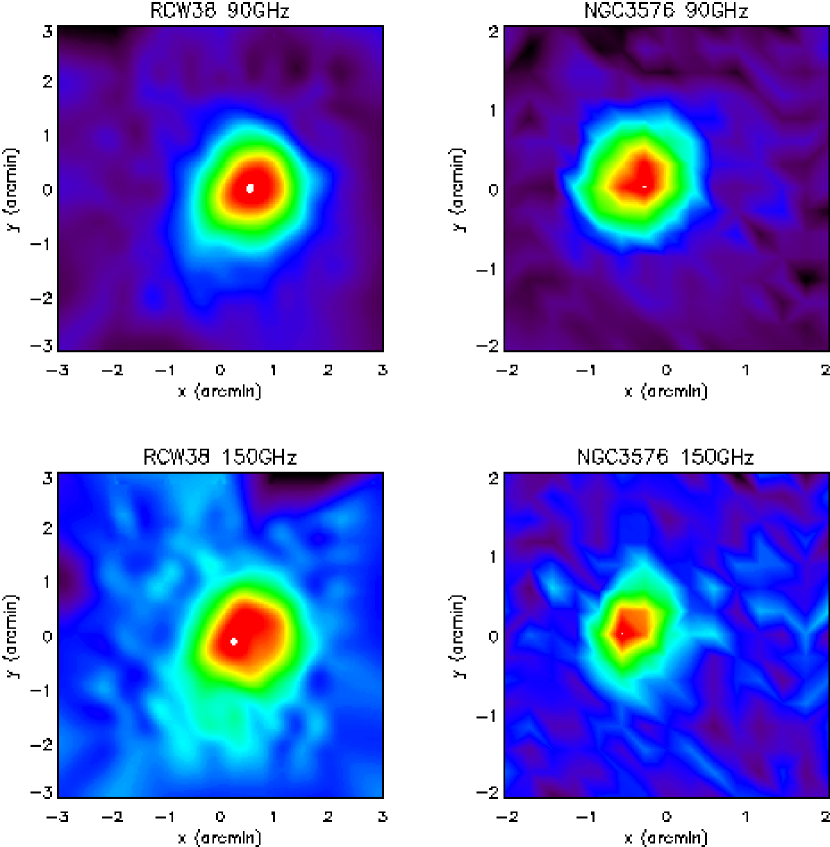
For the Galactic sources NGC3576 and RCW38, observations were made in a region 4’x4’ in extent centered on each source with a grid spacing of 17.5 arcsec (hereafter center maps). Additional observations were made with a wider grid spacing (35 arcsec) covering a larger region around each source (10 arcmin x 10 arcmin in extent for NGC3576, 6 arcmin x 6 arcmin in extent for RCW38) (hereafter extended maps). For RCW38, the more extended of the two sources, the center and extended observations were combined. For NCG3576 only the center maps were used, since the data far from the source are noisy or could be contaminated by objects outside the field.
Maps are shown in Figure 3 and fluxes are given in Table 5. Again, maps are a flat-space projection centered on the source, as in Figure 1. Fluxes for RCW38 and NGC3576 are computed within the map regions. Fluxes for the extra-galactic sources are from point source observations. Spectral indices are computed from the fluxes using eq. 1 and are also given in Table 5.
The SEST observations can be convolved with the BOOMERANG beam in order to check the BOOMERANG calibration. For RCW38 and NGC3576, the SEST maps are convolved with the BOOMERANG beam and flux profiles are obtained from the convolved maps. A numerical convolution is not necessary for the extra-galactic sources since the analytic convolution of a point source with a Gaussian is simple; the 1 and 2 fluxes should be 0.393 and 0.865 of the point source flux. Flux ratios are given in Table 6, where the BOOMERANG fluxes used are those from Table 2. The extra-galactic sources may be time variable, and since the BOOMERANG and SEST observations were made approximately a year apart, they could have different intensities not only because of calibration but because of intensity variations. From a weighted mean of the numbers in Table 6, the current BOOMERANG calibration relative to SEST is 0.970.07 for the 90 GHz channels and 1.040.06 for the 150 GHz channels. In other words, the BOOMERANG and SEST calibrations agree with each other to within the uncertainties.
The MAT team has published fluxes for NGC3576 at 150GHz (Puchalla et al. 2002). For MAT, = 5.16 arcmin. The ratio MAT/(SEST*MAT) for the NGC3576 150 GHz observations is 1.010.14 and 1.000.15 for their and fluxes respectively, implying that SEST and MAT agree well. Therefore, the calibrations of BOOMERANG, SEST and MAT are all consistent for NGC3576 at 150 GHz.
5 Conclusions
A comparison with the SEST data for the Galactic sources NGC3576, RCW38 and extra-galactic sources 0537-441, 0521-365 and 0438-43 implies that the current BOOMERANG calibration and SEST agree to within 8% at 90 GHz and 6% at 150 GHz. Additionally, BOOMERANG, MAT, and SEST fluxes of NGC3576 at 150 GHz are all consistent with each other.
The Galactic sources typically show a flat to inverted spectrum from 90 to 150 GHz and a rising spectrum from 150 to 240 GHz and from 240 to 400 GHz. This is consistent with a combination of free-free and dust emission, with free-free dominating at the lower frequencies and dust dominating at higher frequencies. Our spectral indices are consistent with the typical expected for millimeter observations of HII regions. While the uncertainties on the spectral indices of the extra-galactic sources from BOOMERANG are large, the SEST measurements imply a falling spectrum with increasing frequency. To place these measurements in context, Figure 4 shows the extra-galactic source fluxes along with measurements from a wide range of the electromagnetic spectrum.
Acknowledgments:
We gratefully thank the night assistants at SEST for helping us with the observations. We thank Paula Ehlers for valuable input. The BOOMERANG program has been supported by NASA (NAG5-4081 & NAG5-4455), the NSF Science & Technology Center for Particle Astrophysics (SA1477-22311NM under AST-9120005) and NSF Office of Polar Programs (OPP-9729121) in the USA, Programma Nazionale Ricerche in Antartide, Agenzia Spaziale Italiana and University of Rome La Sapienza in Italy, and by PPARC in UK. The Swedish-ESO Submillimetre Telescope, SEST, is operated jointly by ESO and the Swedish National Facility for Radioastronomy, Onsala Space Observatory at Chalmers University of Technology. KC is supported by NSF grant AST-0104465 under the AAPF program.
References
- (1) Arnold, E. M., Kreysa, E., Schultz, G. V., Sherwood, W. A. 1978, A&A, 70, L1
- (2) Brooks, K. J., Whiteoak, J. B., & Storey, J. W. V. 1998, PASA, 15, 202
- (3) Cheung, L. H., Frogel, J. A., Gezari, D. Y., & Hauser, M. G. 1980, ApJ, 240,74
- (4) Condon, J. J., Griffith, M. R., & Wright, A. E. 1993, AJ, 106, 1095
- (5) Cox, P., Mezger, P. G., Sievers, A., Najarro, F., Bronfman, L., Kreysa, E., & Haslam, G. 1995, A&A, 297, 168
- (6) Crill, B. P., et al. 2002, submitted to ApJ, astro-ph/0206254
- (7) deBernardis, P. et al. 2000, Nature, 404, 955
- (8) DePree, C. G., Nysewander, M. C., & Goss, W. M. 1999, AJ, 117, 2902
- (9) Masi, S., et al. 2001, astro-ph/0101539
- (10) NASA/IPAC Extra-galactic Database (NED), http://nedwww.ipac.caltech.edu
- (11) Netterfield et al. 2002, ApJ, 571, 604
- (12) Puchalla, J. et al. 2002, AJ, 123, 1978
- (13) Ruhl, J. E., et al. 2002, astro-ph/0212229
- (14) SEST web page: http://www.ls.eso.org/lasilla/Telescopes/SEST/SEST.html
- (15) Sokasian, A., Gawiser, E. & Smoot, G. F. 2001, ApJ, 562, 88
- (16) Skyview, IPAC, http://skyview.gsfc.nasa.gov/
- (17) Toffolatti, L., De Zotti, G., Argueso, F., & Burigana, C. 1999, astro-ph/9902343, invited review in ”Microwave Foregrounds”, eds. A. de Oliveira-Costa and M. Tegmark (ASP, San Francisco, 1999)
- (18) Vielva, P., et al. 2001, MNRAS, 328, 1


| Source | RA | Dec | Object Type | ||||
|---|---|---|---|---|---|---|---|
| Carina | 161.06 | -59.58 | HII Region | 2 | 6 | 3 | 4 |
| RCW38 | 134.77 | -47.51 | HII Region | 8 | 24 | 12 | 16 |
| IRAS1022 | 156.05 | -57.80 | HII Region | 7 | 22 | 11 | 13 |
| NGC3603 | 168.79 | -61.29 | HII Region | 2 | 6 | 3 | 4 |
| NGC3576 | 167.98 | -61.33 | HII Region | 2 | 6 | 3 | 4 |
| IRAS08576 | 134.86 | -43.76 | HII Region | 10 | 29 | 15 | 19 |
| 0537-441 | 84.71 | -44.09 | Blazar | 2 | 6 | 1 | 0 |
| 0521-365 | 80.74 | -36.46 | BL Lac | 2 | 5 | 2 | 0 |
| 0438-43 | 70.07 | -43.55 | QSO | 1 | 4 | 0 | 0 |
| Source | 90 GHz | 90 GHz | 150 GHz | 150 GHz | 240 GHz | 240 GHz | 400 GHz | 400 GHz |
|---|---|---|---|---|---|---|---|---|
| 1 (Jy) | 2 (Jy) | 1 (Jy) | 2 (Jy) | 1 (Jy) | 2 (Jy) | 1 (Jy) | 2 (Jy) | |
| Carina | 72.48.2 | 214 | 37.94.1 | 13113 | 13218 | 41056 | 446145 | 1324419 |
| RCW38 | 60.86.2 | 13716 | 51.74.0 | 12212 | 12617 | 29842 | 406115 | 1002298 |
| IRAS1022 | 60.74.6 | 14315 | 42.22.9 | 11911 | 10715 | 28238 | 32094 | 904278 |
| NGC3603 | 55.66.1 | 12614 | 421.2 | 1074.4 | 10114 | 24935 | 30899 | 802256 |
| NGC3576 | 32.63.6 | 74.69.1 | 32.71.5 | 70.16.0 | 87.910 | 20124 | 360102 | 727196 |
| IRAS08576 | 9.10.7 | 20.62.6 | 11.80.7 | 31.92.2 | 55.26.3 | 15818 | 23059 | 667173 |
| 0537-441 | 1.80.4 | 3.81.1 | 1.50.2 | 3.10.6 | 1.30.8 | 2.32.1 | – | – |
| 0521-365 | 1.50.5 | 2.91.4 | 1.30.3 | 2.90.7 | 1.30.7 | 2.60.4 | – | – |
| 0438-43 | 1.40.5 | 3.21.3 | 1.20.2 | 2.90.6 | – | – | – | – |
| Source | ||||||
|---|---|---|---|---|---|---|
| 1 | 2 | 1 | 2 | 1 | 2 | |
| Carina | -1.30.3 | -1.00.3 | 3.30.5 | 3.00.5 | 2.00.6 | 2.00.6 |
| RCW38 | -0.30.3 | -0.20.3 | 2.30.5 | 2.30.5 | 2.00.6 | 2.00.6 |
| IRAS1022 | -0.70.2 | -0.40.3 | 2.40.4 | 2.30.5 | 1.80.6 | 1.90.6 |
| NGC3603 | -0.60.3 | -0.30.3 | 2.30.4 | 2.20.4 | 1.90.6 | 2.00.6 |
| NGC3576 | 0.00.3 | -0.10.3 | 2.60.4 | 2.70.4 | 2.40.5 | 2.20.5 |
| IRAS08576 | 0.50.2 | 0.90.3 | 4.00.4 | 4.20.4 | 2.40.5 | 2.40.5 |
| 0537-441 | -0.40.5 | -0.50.7 | -0.41.6 | -0.72.5 | – | – |
| 0521-365 | -0.30.8 | 0.01.0 | 0.11.5 | -0.12.0 | – | – |
| 0438-43 | -0.40.8 | -0.20.9 | – | – | – | – |
| Source | 90 GHz (Jy) | 150 GHz (Jy) | 240 GHz (Jy) | ||
|---|---|---|---|---|---|
| 0537-441 | |||||
| 0521-365 | |||||
| 0438-43 |
| Source | 90 GHz (Jy) | 150 GHz (Jy) | |
|---|---|---|---|
| RCW38 | 12510 | 1167 | -0.150.20 |
| NGC3576 | 757 | 788 | 0.080.27 |
| 0537-441 | 7.210.31 | 4.590.35 | -0.90.2 |
| 0521-365 | 3.760.30 | 2.550.41 | -0.80.4 |
| 0438-43 | 2.210.31 | 1.330.41 | -1.00.7 |
| Source | B/S 90 GHz | B/S 90 GHz | B/S 150 GHz | B/S 150 GHz |
|---|---|---|---|---|
| 1 | 2 | 1 | 2 | |
| RCW38 | 1.250.17 | 1.270.19 | 1.150.12 | 1.220.15 |
| NGC3576 | 1.110.16 | 1.150.17 | 1.090.12 | 1.050.15 |
| 0537-441 | 0.650.14 | 0.620.18 | 0.850.13 | 0.770.15 |
| 0521-365 | 1.020.34 | 0.870.42 | 1.270.30 | 1.330.37 |
| 0438-43 | 1.610.60 | 1.690.73 | 2.200.79 | 1.950.72 |