The Host Galaxies of Optical Bright QSOs : Molecular Gas in Z 0.1 PG QSOs
Abstract
We present results of a CO(1-0) line survey in a complete sample of 12 low redshift (Z 0.1), optically bright QSOs (PG QSOs with M mag). Six new CO detections are reported here at levels exceeding ICO 2 Jy km s-1. Combined with three previously reported detections, we find that 9 of the 12 QSOs have abundant, dense ISMs characteristic of late type galaxies. In all 9 of the detected QSOs, the derived molecular gas masses are M M⊙ , with the most massive being 1010 M⊙ (PG 0050+124 – I Zw 1). In the three sources not yet detected in CO, the upper limits on the gas masses are M⊙ and thus we cannot rule out abundant ISMs even in these objects. Since our sample was chosen entirely on the basis of low redshift and optical luminosity (and not selected for strong infrared emission), we conclude that the majority of luminous, low redshift QSOs have gas-rich host galaxies and therefore can not be normal elliptical galaxies.
1 Introduction
Despite numerous optical and near infrared studies, the nature of the host galaxies of luminous QSOs has remained a matter of considerable debate since quasars were first discovered in 1964. The host galaxy type provides important clues to the origin and fueling of the supermassive black holes , presumed to be the source of activity and luminosity in QSOs.
Powerful radio galaxies and radio loud quasars appear to be associated with massive elliptical galaxy hosts (L L∗; see Dunlop (2001), Percival et al. (2001)). Both their light distributions and dominant old stellar populations are similar to massive E galaxies, consistent with the well-established empirical correlation that nuclear black holes have approximately 0.2 – 0.5 % of the bulge mass (Magorrian et al. (1998), Merritt & Ferrarese (2001)). Thus the black hole growth and feeding appears linked to the stellar bulge population which is dominant in elliptical galaxies.
On the other hand, evidence has also accumulated for an evolutionary link between merging ultra-luminous IR galaxies (ULIRGs) and UV/optical QSOs ( Sanders et al. 1988). The evidence includes : similar local space densities for ULIRGs and QSOs; FIR SEDs smoothly transitioning between the two classes (Sanders et al. 1989 & Neugebauer et al. 1986); AGN-like emission lines (Veilleux, Kim & Sanders (1999)) and significant point-like nuclei (less than 0.2 – Scoville et al. (2000)) in 30-40% of the ULIRGs ; and the association of both ULIRGs and some QSOs with galactic interactions (MacKenty & Stockton (1984), Bahcall et al. (1997)). In addition, at least one radio-loud QSO, 3C48, shows strong Balmer absorption lines in its extended nebulosity indicating a luminous young stellar population (Boroson & Oke (1984)) and mm-CO emission (Scoville et al. (1993)).
Perhaps the clearest discrimant between early and late type host galaxies is the host galaxy ISM, particularly the dense ISM probed by mm-CO emission. It is well established that normal E galaxies have molecular gas masses M M⊙ while virtually all late type galaxies have M and most have M⊙ (Young & Scoville (1991); Young & Knezek (1989); Casoli et al. (1998); Georgakakis et al. (2001)). In contrast to optical/IR imaging, the detection of CO from the host galaxy is not hampered by suppression of the bright quasar nucleus. We report here the results of an extensive survey to detect CO(1-0) emission associated with optically luminous QSOs in order to assess their host galaxy type.
Our sample QSOs are from the Palomar-Green (PG) QSO survey including all PG QSOs at z 0.1, MB mag and ∘ (Schmidt & Green (1983)). This redshift-limited QSO sample contains 12 objects. The sample was entirely selected based on optical brightness and is not biased toward IR-excess QSOs. As IR-excess QSOs clearly have a large ISM dust mass to produce the IR excess (Haas et al. (2000); Evans et al. (2001)); choosing QSOs by IR selection obviously will not yield an unbiased sampling of luminous QSO host galaxies. Three sources have already been observed and detected in CO (I Zw 1 – Barvainis, Alloin & Antonucci (1989); Schinnerer, Eckart & Tacconi (1998), PG 1351+640 – Evans et al. (2001), PG 1440+356 – Evans et al. (2001)). The previous detection experiments for these sources were initiated on the basis of their IR excesses and they are not reobserved here.
2 OVRO CO Observations and Calibration
The PG QSOs listed in Table 1 were observed at 2.6 mm using the Owens Valley millimeter array during the period of 1999 September – 2001 May. The array consists of 6 10.4 m telescopes and most of the data were obtained in the low resolution and equatorial configurations (as this was a detection experiment needing highest sensitivity). The typical SSB system temperatures were 250-400 K, corrected for antenna and atmospheric losses. Spectral resolution was provided by a digital correlator configured with four bands, each with 32 x 4 MHz channels, yielding a total velocity coverage km s-1 at the redshifted CO(1-0) line. The total integration time and spatial resolutions on the different sources varied depending on system scheduling and source declination (see Table 1). In addition to the spectral line correlator, the continuum was measured in a 1 GHz bandwidth analog correlator.
Nearby radio loud quasars were used for gain and passband calibration. The data were calibrated using the standard Owens Valley array program (Scoville et al. (1992)) and mapped using the NRAO AIPS package.
3 CO Results
Out of the nine new PG QSOs observed for CO emission, six were detected at 3 levels. These detections along with upper limits for the remaining sources, are listed in Table 2. In all but one case, the CO(1-0) detections are at lower flux levels than any achieved previously (e.g. Barvainis, Alloin & Antonucci (1989), Evans et al. (2001)). Maps of the integrated CO flux are shown for the six detected sources in Fig. 1. In no case was there detectable continuum emission, so the emission excesses are clearly CO line emission. In all cases except PG 2214+139, the CO peak coincides within less than half the synthesized beamwidth of the optical QSO position; in PG 2214+139, the displacement is 4″ and thus the detection here needs further confirmation. Lastly, we note that the non-detected sources have limits only a factor 2 below the detected sources; the non-detections should not therefore be interpreted as evidence that the molecular gas content of those sources is necessary very low. In PG 2130+099 the CO emission contours appear extended to the north of the nucleus at the 2 –3 level; in all other sources, the CO is unresolved. HST optical imaging (Surace, Sanders, & Evans (2001)) for PG2130+099 shows the host galaxy to be an inclined spiral with major axis PA 45∘ . No other optical feature is seen in the north direction.
3.1 H2 Mass Estimates
From the CO line flux integrated over the emission line (S), we calculate the H2 mass (MH2) using
(Solomon et al. (1992)). DL is the luminosity distance (with H0 = 75 km s-1 Mpc-1 and q0 = 0.5). The CO-to-H2 conversion factor is taken to be M⊙ (K km s-1 pc2)-1 based on studies of molecular gas in the Galaxy (Scoville & Sanders (1987), Strong et al. (1988)). In a few nearby ULIRGs, there is some evidence that the conversion factor could be a factor of 2-3 lower (Scoville, Yun & Bryant (1997), Downes & Solomon (1998)) and if the lower values pertain to the objects observed here, the molecular gas masses would be lower by the same factor.
3.2 Complete PG QSO Sample
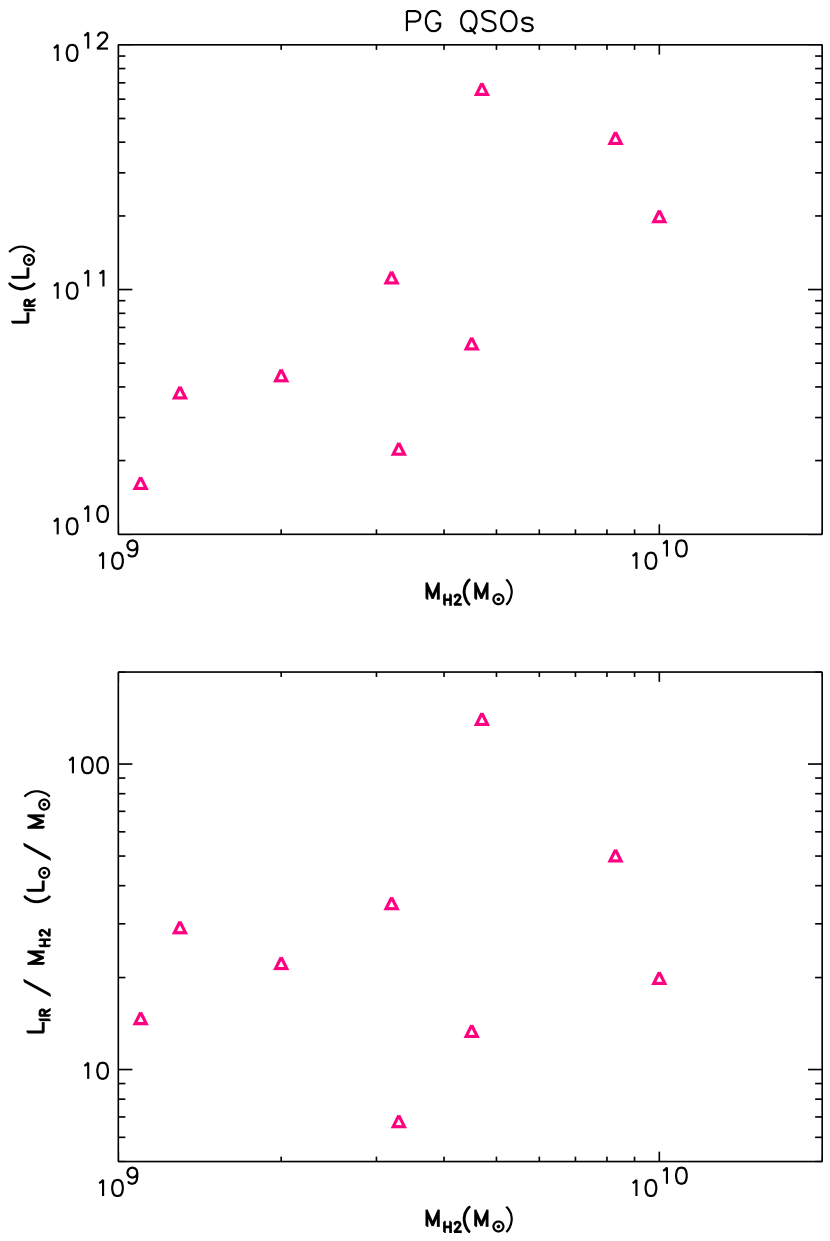
In Table 2, we list the H2 mass estimates for all of the sources in our sample including the three detected previously. The detected QSOs have masses in the range 1.6—10.0 109 M⊙ and the four non-detections have upper limits M⊙ . Nine of the 12 sources have now been detected in CO and therefore have gas-rich ISMs, similar to those of late type galaxies or gas-rich merger remnants. In Fig. 2, the far infrared luminosities and luminosity-to-mass ratios are shown as a function of derived H2 masses for the 9 Palomar-Green QSOs detected in CO. For a normal spiral galaxy like the Milky Way, the luminosity-to-mass ratio is L⊙/ M⊙ and for the most active ULIRG galaxies the ratio is L⊙/ M⊙ ; the observed ratios for the PG QSOs are therefore entirely consistent with those of gas-rich normal and starburst galaxies (10 – 100 , Sanders, Scoville & Soifer (1991)).
As a check on the mass estimates (and the CO-to-H2 conversion factor), we note that one of the sources in our sample, I Zw 1 (PG 0050+124), was detected in the far infrared continuum with ISO (Haas et al. (2000)). The derived dust mass from fitting the SED was 0.98 M⊙ (Haas et al. (2000)), compared with a H2 mass of 1010 M⊙ (Table 2). The implied gas-to-dust ratio of 100 is entirely consistent with that obtained in the Galaxy and other nearby galaxies. None of the other sources in our sample were observed in the ISO study.
4 Discussion
It is important to stress that these PG QSOs in our sample were not IR-selected and therefore, are truly representative of normal optically luminous QSOs with M mag. Two thirds of the sample have molecular gas masses more than a factor 10 greater than any local normal elliptical or S0 galaxy. The peculiar elliptical/radio galaxy Cen A does have a H2 mass M⊙ but it is clear that this is the result of a recent merging with a gas-rich disk galaxy (Mirabel et al. (1999)). The clear implication is that these optically luminous QSOs are preferentially in gas-rich disk galaxies or gas-rich merger systems.
Haas et al. (2000) have reached a similar conclusion based on ISO measurements of the far infrared continuum from a sample of 17 PG QSOs. Although similar in motivation, their results are not as easily interpreted in terms of host galaxy type – 10 of the 17 objects were detected with dust masses 107 M⊙ , corresponding to gas masses M⊙ but the sample was generated ’randomly’ with a very large range of QSO properties and redshifts. None of their objects overlap with our sample. Barvainis & Ivison (2002) recently completed a submillimeter survey of 40 gravitationally lensed QSOs at Z = 1 – 4.4 and detected 23 at 850 m with M M⊙ , implying gas masses of 109-10 M⊙ for standard gas-to-dust ratios. Their important results show no differentiation between radio-loud and quiet AGN and clearly indicate that a significant fraction of high redshift AGNs have very dusty host galaxies. The results obtained here demonstrate that these characteristics persist in the majority of optically luminous AGNs at the present epoch with perhaps a factor of 2-3 lower ISM mass.
How might one reconcile this conclusion with the studies using HST imaging which show light profiles in the hosts of the most luminous radio-loud and radio-quiet quasars similar to those of giant elliptical galaxies (Dunlop (2001))? The Dunlop et al. sample had M mag; however, it would hardly seem reasonable that for a QSO sample with a lower cutoff only 0.5 mag more luminous, the host galaxy properties should change so fundamentally from mostly disk/merger to old elliptical systems. We note that 3 of the galaxies in our sample also have M mag. The Dunlop et al. result is also inconsistent with that of McLeod & Rieke (1994) who obtained H-band light profiles for the host galaxies in 22 out of 24 local QSOs with -24.1 M. THey found that the majority were fit better by disk profiles than r1/4 laws. All of PG QSOs in our study were observed by McLeod & Rieke.
We also note that the r1/4 law profile often used to identify elliptical galaxies is a very imprecise indicator of galaxy type, especially for merging systems which are certainly prevalent in the ULIRG samples (Sanders & Mirabel (1996)). Scoville et al. (2000) found r1/4 law profiles in over 40% of the 24 luminous IR galaxies observed with NICMOS and a similar result was also obtained by Genzel et al. (2001). It is reasonable in the IR luminous galaxies to conclude that the bulge-like light profile was established by dynamical relaxation during the galaxy merging – indeed this is also likely to be the cause of the same light profile in the massive ellipticals which have very likely undergone many merging events. The ULIRG light profiles have typical scale lengths a factor of a few smaller than the largest E galaxies – very likely reflecting the larger mass and larger number of merger events for the most massive E galaxies.
Two possible scenarios linking the ULIRG and AGN phenomena are : 1) that the abundant ISM which fuels the starburst also feeds the central black hole accretion disk or 2) the post starburst stellar population evolves rapidly with a high rate of mass-return to the ISM in the galactic nucleus, leading to sustained fueling of the black hole (e.g. Norman & Scoville (1988)). Whether the entire QSO population had precursor ULIRGs (implying that galactic merging is the predominant formation mechanism for AGNs) or only a small fraction of the QSOs are formed by merging of ISM-rich galaxies, remains an open question. However, the molecular gas detections reported here make it clear that the highest luminosity are generally not in normal (ie. gas-poor) ellipticals. Quite plausibly, the same process (galactic merging) which can lead eventually to a relaxed, bulge stellar population also deposits large masses of ISM in the galactic nuclei to feed and buildup massive AGN. The connection between bulge light and central black hole mass (Magorrian et al. (1998), Merritt & Ferrarese (2001)) might then be indirect rather than a direct causal connection between the bulge stellar population and the buildup of the central massive black holes.
The Owens Valley millimeter array is supported by NSF grant AST 99-81546.
References
- Bahcall et al. (1997) Bahcall, J.N., Kirhakos, S., Saxe, D.H., Schneider, D.P. 1997, ApJ, 479, 642
- Barvainis, Alloin & Antonucci (1989) Barvainis, R., Alloin, D. & Antonucci, R. 1989, ApJ, 337, L89
- Barvainis & Ivison (2002) Barvainis, R. & Ivison, R. 2002, ApJ, 571, 712
- Boroson & Oke (1984) Boroson, T.A. & Oke, J.B. 1984, ApJ, 281, 535
- Casoli et al. (1998) Casoli, F., Sauty, S., Gerin, M., Baseli, A., Fouque, P., Braine, J., Gavazzi, G., Lequeux, J. & Dickey, J. 1998, A&A, 331, 451
- Downes & Solomon (1998) Downes, D. & Solomon, P. M. 1998, ApJ, 507, 615
- Dunlop (2001) Dunlop, J. S. 2001, in ”QSO hosts and their environments”, Dordrecht: Kluwer Academic / Plenum Publishers, xvii, 376
- Evans et al. (2001) Evans, A. S., Frayer, D. T., Surace, J. A. & Sanders, D. B. 2001, ApJ, 121, 3285
- Genzel et al. (2001) Genzel, R., Tacconi, L. J., Rigopolou, D., Lutz, D. & Tecza, M. 2001, ApJ, 563, 527
- Georgakakis et al. (2001) Georgakais, A., Hopkins, A. M., Caulton, A., Wiklind, T., Terlevich, A. I. & Forbes, D. A. 2001, MNRAS, 326, 1431
- Haas et al. (2000) Haas, M., Müller, S. A. H., Chini, R., Meisenheimer, K., Klaas, U., Lemke, D., Kreysa, E. & Camenzind, M. 2000, A&A, 354, 453
- MacKenty & Stockton (1984) MacKenty, J.W. & Stockton, A. 1984, ApJ, 283, 64
- Magorrian et al. (1998) Magorrian et al. 1998, AJ, 115, 2285
- Merritt & Ferrarese (2001) Merritt, D. & Ferrarese, L. 2001, MNRAS, 308, 377
- McLeod & Rieke (1994) McLeod, K. K. & Rieke, G. H. 1994, ApJ, 420, 58
- Mirabel et al. (1999) Mirabel, I. F., Laurent, O., Sanders, D. B., Sauvage, M., Tagger, M., Charmandaris, V., Vigroux, L., Gallais, P., Cesarsky, C. & Block, D. L. 1999, A&A, 341, 667
- Neugebauer et al. (1986) Neugebauer, G. et al. 1986, ApJ, 308, 815
- Norman & Scoville (1988) Norman, C., & Scoville, N. 1988, ApJ, 332, 124
- Percival et al. (2001) Percival, W. J., Miller, L., McLure, R. J. & Dunlop, J. S.Dunlop, J. S. 2001, MNRAS, 322, 843
- Sanders et al. (1988) Sanders, D. B. et al. 1988, ApJ, 328, L35
- Sanders et al. (1989) Sanders, D. B. et al. 1989, ApJ, 347, 29
- Sanders, Scoville & Soifer (1991) Sanders, D. B., Scoville, N. Z. & Soifer, B. T. 1991, ApJ, 370, 158
- Sanders & Mirabel (1996) Sanders, D. B. & Mirabel, F. 1996, ARA&A, 34, 749
- Schinnerer, Eckart & Tacconi (1998) Schinnerer, E., Eckart, A. & Tacconi, L.J. 1998, ApJ, 500, 147
- Schmidt & Green (1983) Schmidt, M. & Green, R. F. 1983, ApJ, 269, 352
- Scoville & Sanders (1987) Scoville, N. & Sanders, D. B. 1987, in ”Interstellar Processes”, ed. D. Hollenbach & H. Thronson (Dordrecht:Reidel), 21
- Scoville et al. (1993) Scoville, N. Z., Padin, S., Sanders, D. B., Soifer, B. T., & Yun, M. S. 1993, ApJ, 415, L75
- Scoville et al. (1992) Scoville, N. Z., Carlstrom, J. C., Chandler, C. J., Phillips, J. A., Scott, S. L., Tilanus, R. P. & Wang, Z. 1992, PASP, 105, 1482
- Scoville, Yun & Bryant (1997) Scoville, N. Z., Yun, M. S. & Bryant, P. M. 1997, ApJ, 484, 702
- Scoville et al. (2000) Scoville, N. Z., Evans, A. S., Thompson, R., Rieke, M., Hines, D., Low, F., Dinshaw, N., Surace, J., & Armus, L. 2000, AJ, 119, 991
- Solomon et al. (1992) Solomon, P. M., Downes, D. & Radford, S.J.E. 1992, Nature, 356, 318
- Strong et al. (1988) Strong, A. W. et al. 1988, A&A,207, 1
- Surace, Sanders, & Evans (2001) Surace, J. A., Sanders, D. B., & Evans, A. S. 2001, AJ, 122, 2791
- Veilleux, Kim & Sanders (1999) Veilleux, D., Kim, D.-C. & Sanders, D. B. 1999, ApJ, 522, 113
- Young & Knezek (1989) Young, J. S. & Knezek, P. 1989, ApJ, 345, L55
- Young & Scoville (1991) Young, J. S. & Scoville, N. 1991, ARA&A, 29, 581
| Source | RA (2000)aaThe coordinates indicate the position obtained from fitting a Gaussian to the detected emission. The offsets in Fig. 1 are relative to these positions. For the undetected QSOs, the optical QSO position is given. | DEC (2000)aaThe coordinates indicate the position obtained from fitting a Gaussian to the detected emission. The offsets in Fig. 1 are relative to these positions. For the undetected QSOs, the optical QSO position is given. | bbThe systemic velocity is given as the heliocentric velocity using the optical convention either denoting the line center for the detections or the middle of the observed spectral band for the non-detections. | BeamccThe fullwidth at half maximum of the final synthesized beam. | tintddThe total effective on-source integration time with 6 telescopes. | rmseeThe rms derived from smoothed (330 km s-1) maps for all sources. |
|---|---|---|---|---|---|---|
| km s-1 | ″ ″ | hr | mJy beam-1 | |||
| Detections : | ||||||
| PG 0804+761 | 08:10:58.78 | 76:02:42.4 | 29918 | 4.34.1 | 28 | 1.0 |
| PG 1229+204 | 12:32:03.64 | 20:09:27.7 | 19207 | 4.73.9 | 27 | 1.3 |
| PG 1404+226 | 14:06:21.60 | 22:23:46.2 | 29337 | 5.13.7 | 23 | 1.2 |
| PG 1426+015 | 14:29:06.53 | 01:17:05.0 | 25990 | 4.54.0 | 15 | 1.5 |
| PG 2130+099 | 21:32:27.77 | 10:08:19.5 | 19010 | 4.93.9 | 28 | 1.4 |
| PG 2214+139 | 22:17:12.04 | 14:14:17.9 | 19517 | 6.15.6 | 29 | 1.4 |
| Non-detections : | ||||||
| PG 0844+349 | 08:47:42.5 | 34:45:04.6 | 19097 | 4.53.7 | 22 | 1.3 |
| PG 1211+143 | 12:14:17.6 | 14:03:12.5 | 24253 | 3.63.4 | 23 | 1.4 |
| PG 1411+442 | 14:13:48.4 | 44:00:13.6 | 26861 | 4.93.9 | 25 | 1.3 |
| Name | MBaaB magnitudes from Schmidt & Green (1983); far infrared luminosities from Sanders et al. (1989). | log[L(IR)]aaB magnitudes from Schmidt & Green (1983); far infrared luminosities from Sanders et al. (1989). | z | DL bbLuminosity distance from Mpc assuming H0 = 75 km s-1 Mpc-1 and q0 = 0.5. | S(CO) | vFWZI | MH2 ccH2 mass calculated using Eq. 1 with = 4 M⊙ [K km s-1 pc2]-1. Upper limits to the line fluxes are 3. PG2214+139 is detected only at the 3 level and therefore this detection should be treated somewhat tentatively. |
|---|---|---|---|---|---|---|---|
| (L⊙) | (Mpc) | (Jy km/s) | km s-1 | (109 M⊙) | |||
| PG1351+640 | -23.2 | 11.82 | 0.088 | 359 | 4.01.0 | 414 | 4.7 ddEvans et al. 2000 |
| PG1440+356 | -23.4 | 11.62 | 0.078 | 318 | 9.01.5 | 600 | 8.3 ddEvans et al. 2000 |
| PG0050+124(I Zw 1) | -23.5 | 11.30 | 0.061 | 248 | 18.02.0 | 650 | 10.2 eeSchinnerer et al. 1998, Barvainis et al. 1989 |
| PG1404+226 | -23.1 | 11.05 | 0.098 | 401 | 2.00.5 | 468 | 3.2 |
| PG1426+015 | -23.6 | 10.78 | 0.086 | 351 | 3.60.6 | 633 | 4.5 |
| PG1211+143 | -23.9 | 10.73 | 0.086 | 351 | |||
| PG2130+099 | -23.2 | 10.65 | 0.061 | 248 | 4.30.6 | 487 | 2.0 |
| PG2214+139 | -23.1 | 10.58 | 0.067 | 272 | 0.5 | 488 | 1.3 |
| PG1411+442 | -23.7 | 10.52 | 0.089 | 363 | |||
| PG0804+761 | -23.8 | 10.35 | 0.100 | 409 | 2.00.5 | 881 | 3.3 |
| PG0844+349 | -24.0 | 10.21 | 0.064 | 259 | |||
| PG1229+204 | -23.3 | 10.21 | 0.064 | 259 | 2.40.6 | 266 | 1.1 |