22institutetext: Dipartimento di Astronomia, Università di Padova, Vicolo Osservatorio 2, I-35122 Padova, Italy
Photometric study of the young open cluster NGC 3293 ††thanks: Based on observations collected at UTSO, ESO (Dutch 0.9 m telescope) and CASLEO. The CCD and data acquisition system at CASLEO has been partly financed by R.M. Rich through U.S. NSF Grant AST-90-15827
Deep and extensive CCD photometric observations were carried out in the area of the open cluster NGC 3293. The new data set allows to see the entire cluster sequence down to , revealing that stars with are evolving off the main sequence; stars with are located on the main sequence and stars with are placed above it. According to our analysis, the cluster distance is () and its nuclear age is . NGC 3293 contains an important fraction of pre–main sequence (PMS) stars distributed along a parallel band to the ZAMS with masses from to and a mean contraction age of . This last value does not differ too much from the nuclear age estimate. Actually, if we take into account the many factors that may affect the PMS star positions onto the colour–magnitude diagram, both ages can be perfectly reconciled. The star formation rate, on the other hand, suggests that NGC 3293 stars formed surely in one single event, therefore favouring a coeval process of star formation. Besides, using the data, we detected nineteen stars with signs of having emission in the region of NGC 3293, giving another indication that the star formation process is still active in the region. The computed initial mass function for the cluster has a slope value , a bit flatter than the typical slope for field stars and similar to the values found for other young open clusters.
Key Words.:
Galaxy: open clusters and associations: individual: NGC 3293 - Stars: imaging - Stars: luminosity function, mass function1 Introduction
Star clusters constitute the most appropriate laboratory to test the stellar evolution theory since all the stars formed in a cluster belong to the same region of space, are all at the same distance and have the same chemical composition. Some of the main tools, tightly related to the history of the star formation processes, are the luminosity function (LF) and the initial mass function (IMF). Regarding the construction of these distributions, open clusters offer two operational advantages when compared to field stars: a) there is no need to assume a time-independent IMF as necessary in deriving the IMF field stars and, b) as cluster stars do not move far from their birth–sites, neither is necessary to consider the IMF is spatially independent (Scalo 1986; Herbst & Miller 1982; Wilner & Lada 1991). Still, after several years of intensive and extensive works on open clusters (in our galaxy and the Magellanic Clouds) applying the powerful CCD techniques, some questions have not found the answer yet:
-
•
Which is the star formation mechanism and how long it keeps active (Sung et al. 1998)? Is it coeval or sequential (Iben & Talbot 1966; Herbst & Miller 1982; Adams et al. 1983)?
-
•
Is the IMF slope universal? Is it bimodal? Why do some open clusters show an apparent deficiency of low mass stars (van den Bergh & Sher 1960; Adams et al. 1983; Lada et al. 1993; Phelps & Janes 1993; Sung et al. 1998; Prisinzano et al. 2001), despite they are young enough to exclude stellar losses by dynamical evolution?
-
•
Does the IMF vary from cluster to cluster even within a same star formation region probably by changes in the initial conditions of the star formation process (Scalo 1986; Lada & Lada 1995)?
The young open cluster NGC 3293 = C1033–579 (,
) is placed in the Carina region north–west of Trumpler
14/16. The three clusters are embedded in the nebulosity of the HII region NGC
3372, although NGC 3293 is relatively free of patches of dust. This cluster is
compact, well populated and not too much reddened. Besides, with an age
, it is surely free from dynamical evolution too. Altogether these
properties make it an excellent target to examine some of the items enumerated
above. Herbst & Miller (1982, hereafter HM82) performed the deepest photometric
study (mostly photographic) of this object to investigate the star–forming
history down to . HM82 found features that deserve confirmation:
a) the low mass stars formed first, b) the cluster LF shows a sharp dip at
and , c) the cluster IMF is not only flatter than the field
star IMF but it varies with time during the cluster formation period and d) the
cluster has a halo structure formed by less massive stars. The need for new deep
photometry is evident as a substantial part of the HM82’s findings may have been
produced by selection effects close to the detection limit of the photographic
plates (Deeg & Ninkov 1996).
Apart from the HM82 study of the star–forming history, a synthesis of the
main investigations carried out in NGC 3293 includes: spectroscopy of bright
cluster members to obtain radial velocities and spectral classification by Feast
(1958); rotational velocity studies undertaken by Balona (1975);
photoelectric photometry and polarimetric measures performed by Feinstein &
Marraco (1980, hereafter FM80); photometry including the cluster and the
surrounding area was also carried out by Turner et al. (1980, hereafter TGHH80);
important contributions including the detection of several Cepheid stars
come from observations (Shobbrook, 1980; Balona & Engelbrecht
1981, 1983; Shobbrook 1983; Balona 1994).
The present investigation aims at defining the lower main sequence structure of
this cluster and detecting the presence of pre–main sequence (PMS) stars. We
understand that a primary (but not concluding) indicator of the existence of PMS
objects comes from the detection of faint cluster members above the ZAMS (Walker
1957, 1961). More recent evidences on PMS stars (cf. Fig. 3 in Preibisch &
Zinnecker 1999) indicate that they conform a band above the ZAMS, to
wide approximately in the HR diagram. However, the determination of this
locus through photometry alone is completely spoiled because of the
contamination by field interlopers. Better defined locations are achieved by
removing the field star contamination through adequate comparison fields. That
implies to obtain a “clean” colour–magnitude diagram (CMD), where the PMS
stars, if they do exist, occupy a well defined place. Another purpose of this
investigation deals with the analysis of the frequency distribution of both,
magnitudes and masses, including not only the brightest (most massive) members
but also the faintest ones. Finally we will attempt to detect
emission stars (indicative of the PMS stage) through an
survey that was conducted in the NGC 3293 region.
In section 2 we describe our observations, the reduction procedure and the
complementary sources of information. Section 3 contains the data analysis
including the estimation of the cluster angular size and the membership
assignment. Section 4 illustrates the determination of the basic cluster
parameters: reddening, distance, linear size and age; it also contains the
cluster LF and IMF determination. Section 5 describes the process to detect
stars with emission. In section 6 we discuss the star formation
process. Finally, the conclusions are included in section 7 along with a
summary of our main findings.
2 Data Set
The main data set comes from CCD photometric observations of stars in the region of NGC 3293 carried out along several observational runs complemented with available information from the literature. Data come then from:
-
1.
The University of Toronto Southern Observatory (UTSO): In two observational runs we obtained photometry using a PM–512 METHACROME UV coated CCD (scale covering on a side) attached to the Hellen–Sawyer 60–cm telescope. The first run was in 1994 April 13, 14 and 16 when three frames were exposed in NGC 3293 using the nitrogen–cooled detector; the second run took place in 1996 February 25 and 26, when three more frames were exposed using a glycol–refrigerated detector. Short (2 to 6 s), mid (100 to 200 s) and long (two series of up to 1100 s) exposure times were used to get photometry of the bright stars and to improve the signal–noise–ratio of the faintest stars respectively. A comparison frame was taken on February 27, north of the cluster, using similar exposure times. Weather conditions at UTSO were always photometric with seeing values ranging from to .
-
2.
The Complejo Astronómico El Leoncito (CASLEO): In 1999 April 15 and 17 we made observations in two frames ( radius) in the area of NGC 3293 using a nitrogen–cooled detector Tek–1024 CCD and focal reducer attached to the 215–cm telescope (scale ). One frame was centred in the cluster and the other west side of it (see Fig. 1). Exposure times in , and filters ranged from (in central frame) or (west side frame) to , and from to for the band. In all the cases, mid exposure frames were also taken.
-
3.
The European Southern Observatory (ESO): We complemented our data set with an unpublished CCD photometric survey conducted by F. Patat and G. Carraro in 1996 at ESO 0.9 m Dutch telescope. Details of these observations and data reductions are given in Patat & Carraro (2001).
-
4.
Other data sources: photometric data for a few bright stars (see Table 1) and available spectral classification were taken from FM80 and TGHH80. Useful complementary information was mainly derived from the Tycho Catalog (ESA 1997) and databases (see Tables 1 and 3).
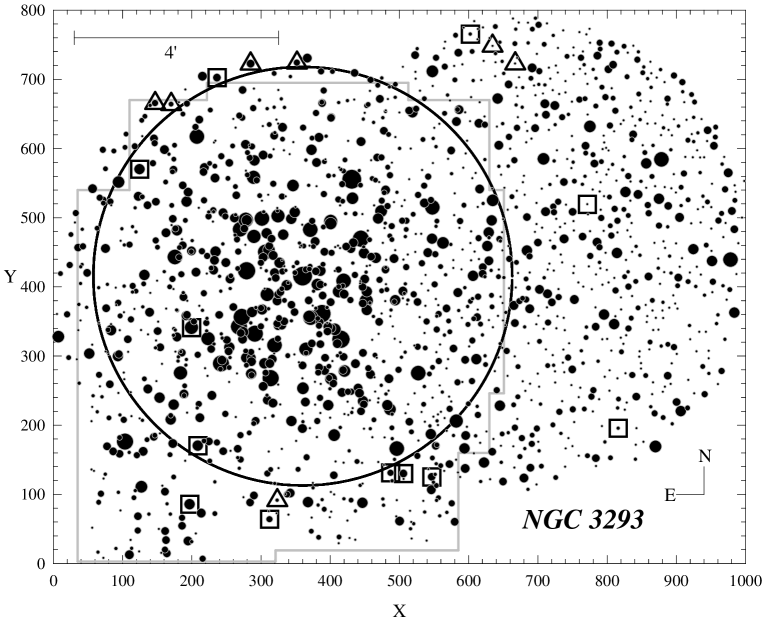
Figure 1 shows the finding chart of all measured stars. The grey line stands for
the area surveyed at UTSO and ESO () and the black circle encloses
the (see section 3.1).
| Remarks | ||||||||||||||||||||
| 1 | 3 | 3 | 3 | - | 431.2 | 555.4 | 6. | 52 | -0. | 81 | 0. | 12 | 0. | 07 FM | 0. | 09 FM | . | lm1 - | HD 91943 | |
| 2 | 4 | 4 | 4 | - | 360.3 | 415.4 | 6. | 54 | -0. | 82 | 0. | 00 | 0. | 04 FM | 0. | 09 FM | . | lm1 - | HD 91969 | |
| : | : | : | : | : | : | : | : | : | : | : | : | : | : | |||||||
| 1689 | - | - | - | - | 339.9 | 70.4 | 21. | 65 :: | . | 1. | 12 :: | . | . | . | – - | – | ||||
| 1690 | - | - | - | - | 585.0 | 131.4 | 21. | 72 :: | . | 0. | 89 :: | . | . | . | – - | – | ||||
| Comment: Table 1 is available in full in an electronic version at the CDS. A brief summary, only indicating its structure, is shown here. |
The reduction process was carried out using IRAF†††IRAF is distributed by
NOAO, which are operated by AURA, under cooperatative agreement with NSF
CCDRED, DAOPHOT and PHOTCAL packages. Instrumental signatures at UTSO and CASLEO
frames were removed using bias and dome flat exposures. Dark currents were
tested to recognise its significance in our observations but they were found
negligible. Instrumental magnitudes were produced via
the point spread function, PSF, (Stetson 1987). Calibration sequences in the
open clusters Hogg 16 and NGC 5606 (Vázquez et al. 1991, 1994) including
several blue and red stars and standard star groups with blue and red stars from
Landolt (1992) were used to produce final colours and magnitudes at UTSO and
CASLEO respectively. The final errors of the respective calibration equations,
adopted as external errors of our photometry, were . Small mean
differences were found between UTSO and ESO measures. However, the
measures made at CASLEO showed a shift relative to UTSO–ESO
photometry that was corrected to bring them into the system defined at
UTSO–ESO. The estimate of the internal errors was done comparing colour and
magnitudes of the stars located in the overlapping zones of our frames. That
yields typical differences , up to . Table 1 contains the
photometric output for 1690 stars; it also includes the star identification,
coordinates, the cross–references with other authors and some astronomical
catalogues, and the membership assignment. Summarising the information available
after our survey we have: 1690 stars with magnitude, 560 stars with
index, 940 stars with , 1550 with , 903 with and 861 with
index.
In relation to our data completeness, we performed an analysis for data
from UTSO (Baume 1999) using IRAF tasks ADDSTAR, DAOFIND and ALLSTAR. Then we
compared those results with ESO and CASLEO data. That analysis yielded us to
the following completeness results: down to , down to
, down to and down to .
A comparison of our photometry with TGHH80, FM80 and HM82, in the sense “our
photometry minus theirs” is shown in Table 2. The influence of
(photoelectrically) unresolved stars, binary and variable stars is reflected in
the large standard deviations of the mean differences. As shown in the second
rows, if the known anomalous stars are discarded, the deviations decrease
substantially and the mean differences and standard deviations reach acceptable
values. The exception is for HM82 photometry where the bulk of their data is
photographic.
| Work | |||||||||||
| FM80 | -0.06 | 0.21 | -0.01 | 0.19 | 0.02 | 0.04 | -0.03 | 0.05 | -0.04 | 0.07 | (35) |
| -0.01 | 0.03 | 0.03 | 0.05 | 0.03 | 0.03 | -0.03 | 0.03 | -0.03 | 0.06 | ||
| TGHH80 | -0.01 | 0.10 | 0.01 | 0.11 | -0.00 | 0.09 | (86) | ||||
| -0.01 | 0.06 | 0.01 | 0.08 | -0.00 | 0.04 | ||||||
| HM82 | 0.04 | 0.16 | 0.01 | 0.16 | 0.00 | 0.12 | (278) | ||||
3 Data Analysis
3.1 Cluster angular radius
To get reliable information on the evolutionary status of an open cluster we
have to precisely know its size. In the present case, to address this issue we
performed stellar counts in a Digitized Sky Survey (DSS) image
centred in NGC 3293. All stars detected above a given threshold were assigned
magnitudes using DAOPHOT task. magnitudes for stars brighter
than were next transformed into our photometric system with an
accuracy of the order of (a procedure already applied in NGC 6231,
Baume et al. 1999). Secondly, assuming the cluster is spherical, the highest
apparent star density was fitted with a bi–dimensional Gaussian function. The
cluster centre, defined by the highest peak (Battinelli et al. 1991), was found
close to star #2 (No. 4 in FM80 notation) and the angular radius was set at
, the distance at which the star density equalises the background level.
A similar procedure but using only our CCD data, that include stars as faint
as (Fig. 1), was applied. We counted stars inside concentric
annuli, 100 pixels width, centred in star #2. As at 650 pixels of star #2, the
annuli are not complete (only small portions of them were observed) we had to
extrapolate the counts within each annulus to complete them. The stellar density
profile coincides with the background density level at from the cluster
centre yielding the same result found with the DSS plates. The black circle of
radius shown in Fig. 1 defines then the area occupied by NGC 3293
(). This agrees with TGHH80’s finding who yielded a cluster
angular diameter of .
3.2 Cluster membership
Proper motions and radial velocities studies yield the more accurate membership
determination in a cluster. Up to now, proper motions are only feasible for
nearby clusters (Sanner & Geffert 2001) and radial velocities are available
mostly for brightest stars. In NGC 3293, forty one of its brightest stars are
listed in the Hipparcos/Tycho catalogues (ESA 1997). Only nine of them have
parallax and proper motions with relative scientific value. They are indicated
in Table 3 although the distance at which NGC 3293 is located makes them,
statistically speaking, meaningless to derive distance and memberships.
Regarding radial velocities, we used Feast (1958) studies for membership
assignment to brightest stars. In particular, star #3 (No. 21 in FM80
notation) is a red super–giant (; IRAS source 10338-5759)
and is a likely cluster member according to its radial velocity value and its
spectrophotometric distance modulus (see Table 3).
In the classical photometric method to address cluster memberships (e.g. Baume
et al. 1999), the consistency of the location of each star is assessed
simultaneously in all the photometric diagrams (the two colour diagram, TCD, and
the different CMDs). Other authors use reddening limits within which cluster
members should lie or they adopt maximum departures from a reference line as the
ZAMS (Deeg & Ninkov 1996; Hillenbrand et al. 1993). Our method works well for
bright members, but it becomes unpractical to detect members among faint stars
in crowded fields. It was mentioned by Abt (1979) that the classical method is
controversial; however, as was stated by TGHH80 and emphasised by Forbes (1996),
it is good enough when it relies on a careful inspection of the TCD and
consistent reddening solutions are applied. The method works well too for
nearby, not much reddened, intermediate and old clusters without traces of
contracting stars (Stahler & Fletcher 1991), but it fails for young clusters
where contracting stars and field interlopers very often occupy the same
location on the CMD. If the reddening is high and the cluster is distant,
results are clearly dubious. Therefore, in order to minimise this problem, we
divided our data set in two groups, stars brighter than and
fainter than that value.
3.2.1 Bright cluster members
For stars brighter than , the method described above was combined with spectroscopic data (whenever possible) to classify stars as likely members (lm1) and probable members (pm1), which are indicated with black filled symbols in our figures. The following main features can be outlined from inspection of the cluster photometric diagrams:
-
•
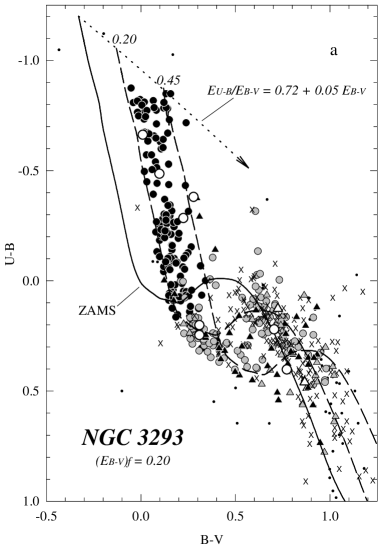
The TCD (Fig. 2a) shows, down to , a well recognisable blue and scattered main sequence composed by stars with spectral types earlier than A0 mostly included inside reddening values (see section 4.1).
-
•
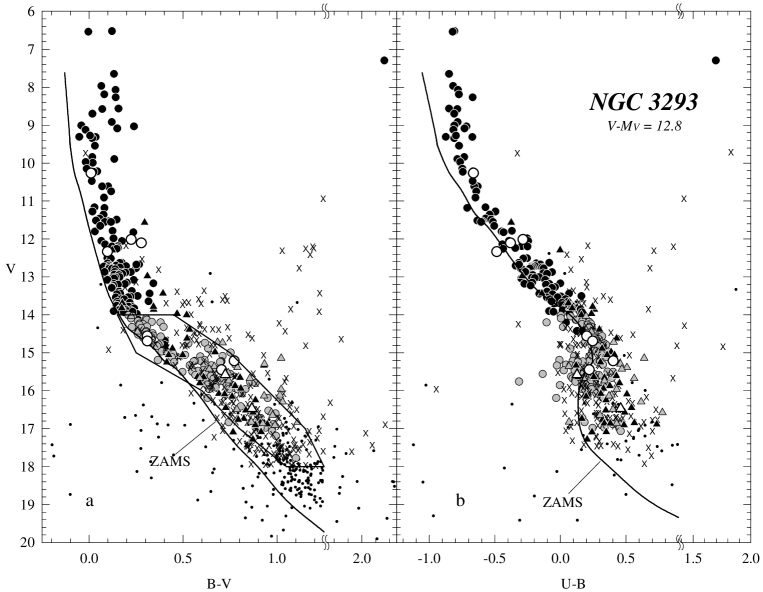
The four CMDs (Fig. 3), in turn, show a clear and well populated upper main sequence slightly widened because of differential reddening. The brightest stars of the cluster main sequence are mostly placed above the ZAMS (Schmidt–Kaler 1982) while stars with are on the ZAMS.
-
•
None of the diagrams show evidences of strong contamination of field stars among bright members. Actually, most of field stars start mixing with cluster members downwards becoming an important obstacle to analyse the faint part of the cluster.
3.2.2 Faint cluster members
Determining memberships for stars with requires a different procedure.
If vs. and/or vs. CMDs are available for the
and a , we can subdivide them into a grid
of boxes ( and ) and build two–dimensional histograms for each CMD.
Subtracting the respective two–dimensional histograms (this mean
- ), we can remove (statistically
speaking) the contamination produced by field stars onto the CMDs of the
. This way, count left on the resulting two–dimensional
histogram define the locus occupied by cluster member stars on the CMDs (Chen et
al. 1998). Naturally, the reliability of the number of members obtained and the
locus they occupy, depend on two factors: a) the adopted must
be representative of the field star distribution over the
and b) the must include the whole extension of the cluster
to account for mass segregation. Actually, the true cluster size will strongly
depend on the extension of the segregation process outward it. If the
is too close to the cluster, it may contain less massive
segregated members; if it is far from the cluster it may not represent the true
field star distribution across it. Finally, dust clouds and emission nebulae
(very frequent in young clusters near the galactic plane) along with
differential reddening lead to wrong estimations of the field star distribution
too (Mermilliod 1976; Prisinzano et al. 2001; see Forbes 1996 for details).
In the remaining of this section all procedures will be applied only to stars in the range with photometric errors . A first point to treat is whether comparison fields around NGC 3293 do show any strong differences produced by random stellar fluctuations and/or the type of stellar data. To ease the analysis we divided our data set into four groups:
-
•
: , and data from stars placed in the cluster area, up to a radius. This sample is the and contains cluster stars plus field stars.
-
•
: , and data for stars placed between radius and the limits of the grey line squared frames shown in Fig. 1.
-
•
: and data from stars placed in the comparison field (see section 2) north of the cluster.
-
•
: and data for stars from the grey line squared frames outwards.
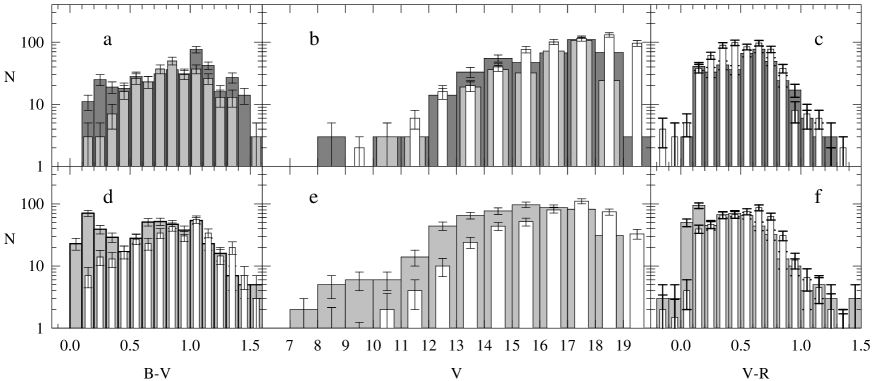
We warn that samples , and are different representations of what we called . As they cover different areas they were adequately scaled to the area to built the two-dimensional histograms of each sample. Any strong spatial variation among the field samples should be revealed by the marginal distributions of the two–dimensional histograms of each sample. A brief inspection of them, shown in Fig. 4, let us say:
-
•
Figures 4b and 4e show a same degree of completeness of the photometry in the and the field samples down to .
-
•
Figs. 4a-c, show that different field samples have not only the same shape (down to ) but also the same number of stars approximately. Aside from uncertainties produced by small number statistics, the actual true distribution of field stars over the cluster surface should not differ too much from these three.
To quantify the last issue, we applied a Kolmogorov–Smirnoff test to the field
distributions confirming that, for , the three field samples are
similar at the level . Thus, the average of their respective
two–dimensional histograms ( vs. and/or vs. ) yields the best
representation of the across NGC 3293. The corresponding
marginal distributions are presented as white histograms in Figs. 4d-f).
Another point to analyse is whether NGC 3293 has undergone mass segregation
and shows a core/halo structure, as suggested by HM82. Although in section 3.1
we did not find evidences of any halo around NGC 3293, we compared the ratios of
stellar densities found in the () and outside
it () as a function of . If an appreciable amount of less massive
(faint) stars were located outside the cluster boundaries due to an active mass
segregation process then the ratio should show that. As
expected, the plots of Fig. 5 do not indicate any appreciable star over excess
outside the cluster area, but just a very slow increasing at very faint
magnitudes (at the level where the completeness starts being questionable). We
conclude that the cluster has not undergone mass segregation and its limits from
section 3.1 are fully reliable.
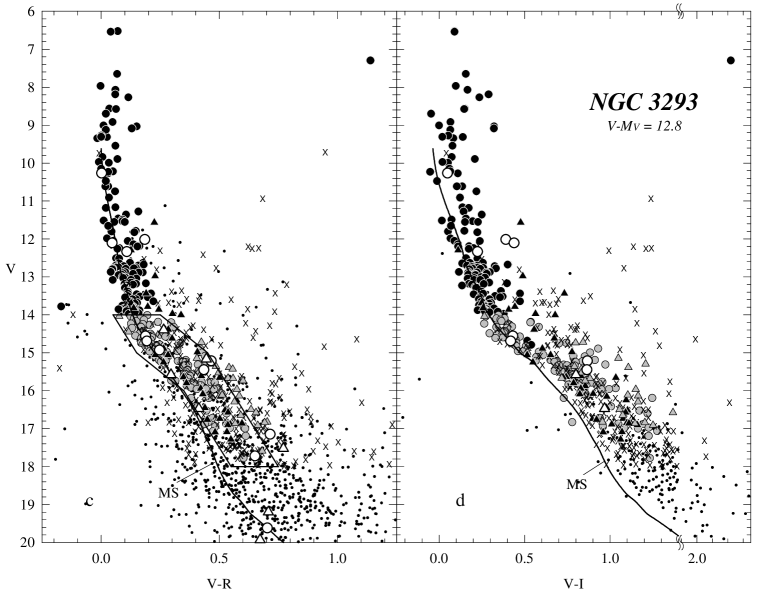
We proceeded then to subtract the average two–dimensional histogram of the from the one of the obtaining the contamination–free vs. and vs. distributions. They revealed then the presence of stellar bands above the ZAMS with confident lower and upper limits. Such limits were used on the CMDs (see Figs. 3a and 3c) to define which stars are (from a statistical point of view) cluster members following the next criteria:
-
•
A star is a cluster likely member (lm2) if it is found inside the cluster boundaries defined in section 3.1 and is simultaneously included inside the band limits in the two CMDs ( vs. and vs. ).
-
•
A star is a probable member (pm2) if, apart from being spatially well located, it fits, at least, in any of high density zones defined in the CMDs and shows slight departures in the other.
Finally, the resulting sample was filtered (following a random distribution) in
order to obtain final CMDs with an amount of stars in each colour–magnitude box
similar to that obtained after the subtraction of the two–dimensional
histograms. The adopted memberships are shown with grey filled symbols in the
photometric diagrams of our figures. Notice in advance member stars with
mainly placed above the ZAMS line in the vs. and vs.
diagrams (we will return to this point in subsection 4.3 and section
6).

4 Cluster Parameters
4.1 Corrected colours and magnitudes of cluster members
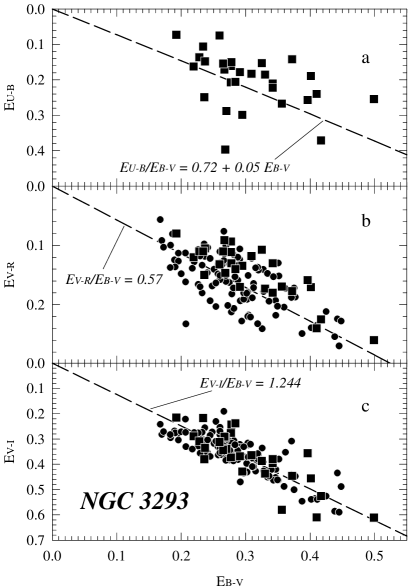
For the estimation of the cluster mean colour excesses, we used firstly the 14
stars with known spectral classification and luminosity class IV–V (see Table
3) using the Schmidt–Kaler (1982) relations of spectral types and intrinsic
colours (Be stars were excluded). The plot of excesses is shown in Fig. 6a
together with the standard relation. The fitting is poor
probably because of colour anomalies of the many variable stars present in
the sample. Mean value excesses of these stars were and . Secondly, we applied the well
known relations and to get the intrinsic colours of those stars with
adopted as likely members and without spectral classification (mostly located at
, see Fig. 2a). When we included this last group of
stars in the mean colour excesses computations, the obtained values were
and , almost
identical to the obtained firstly. We de-reddened cluster members with
(except star #3) using individual excesses, meanwhile other cluster members
and star #3 were de-reddened using these lasts mean excess values. The
estimated foreground colour excesses of NGC 3293 were and
, slightly lower than the typical ones for southern Carina
(Tr 15, Carraro 2002; Tr 14/15/16, Tapia et al. 2002).
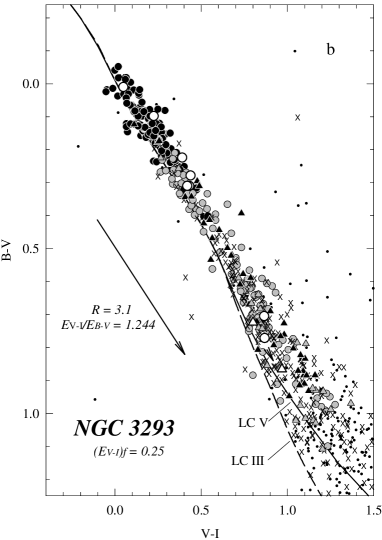
The next step was to know the absorption law valid in NGC 3293 given by
. Galactic regions with normal absorption have a mean of
although larger –values are especially found in regions of
recent star formation. To compute the local –value we obtained individual
, and excesses through the with
and relations for stars without spectral classification
(circles in Fig. 6b-c) and the relation between MK types and and
for stars with spectral types (squares in Fig. 6b-c), both from
Cousins (1978). and ratios depend on the
–values as when and
the interstellar material is normal (Vázquez et al. 1995; Dean et al. 1978).
The plot of 140 stars with , and are depicted in
Figs. 6b and 6c showing an excellent agreement with the typical reddening
relations. The mean ratios found are
and , indicative of a normal reddening
law for which is . The foreground excesses we found were
and . Finally we mention that FM80
claim that can raise up to . That is marginally probable seeing the
plots of Fig. 6b-c, although the scatter around the mean lines may be mainly
caused by circumstellar envelopes, variability and/or binarity instead of
anomalies in the absorption. Therefore, we adopted to obtain corrected
magnitudes as .
| Remarks | ||||||||||
|---|---|---|---|---|---|---|---|---|---|---|
| 1 | 3 | B0..5 Iab | V513 Car - | Hip-Tyc - | 0.34 | 0.22 | 0.18 | 0.38 | 11.86 | |
| 2 | 4 | B0 Ib | - | Hip-Tyc - | 0.24 | 0.25 | 0.15 | 0.38 | 11.91 | |
| 3 | 21 | M1.5 Iab | V361 Car - | IRAS - | 12.00 | |||||
| 4 | 22 | B1 II | - | - | s.d.s. | 0.37 | 0.14 | 0.18 | 0.45 | 11.90 |
| 5 | 20 | B1 III | V439 Car - | - | 0.33 | 0.15 | 0.11 | 0.39 | 11.36 | |
| 6 | 25 | B1 III | - | - | 0.40 | 0.19 | 0.17 | 0.46 | 11.23 | |
| 7 | 6 | B0.5 III | - | - | 0.36 | 0.27 | 0.17 | 0.58 | 11.84 | |
| 8 | 8 | B0.5 III | - | Hip-Tyc - | 0.42 | 0.37 | 0.23 | 0.53 | 11.72 | |
| 9 | 26 | B1 III | V379 Car - | - | Be(3) - Ceph | 0.42 | 0.12 | 0.14 | 0.44 | 11.67 |
| 10 | 7 | B1 III | - | - | b.s.(1) | 0.33 | 0.19 | 0.17 | 0.44 | 11.95 |
| 11 | 16 | B1 IV | V403 Car - | - | Ceph | 0.28 | 0.15 | 0.13 | 0.24 | 11.44 |
| 12 | 27 | B0.5 III | V380 Car - | - | Ceph | 0.40 | 0.26 | 0.16 | 0.36 | 12.44 |
| 13 | 5 | B1 III | V381 Car - | - | Ceph - b.s.(1) | 0.22 | 0.16 | 0.12 | 0.29 | 12.73 |
| 14 | 19 | B1 III | - | - | s.d.s. | 0.50 | 0.25 | 0.26 | 0.61 | 11.89 |
| 15 | 2 | B1 III | - | Hyp-Tyc - | 0.41 | 0.24 | 0.24 | 0.61 | 12.22 | |
| 17 | 18 | B1 V | V406 Car - | - | Ceph | 0.27 | 0.15 | 0.11 | 0.34 | 11.65 |
| 18 | 14 | B0.5 V | V405 Car - | - | Ceph | 0.23 | 0.14 | 0.11 | 0.31 | 12.20 |
| 19 | 24 | B1 III | V378 Car - | - | Ceph | 0.29 | 0.30 | 0.13 | 0.43 | 12.80 |
| 20 | 23 | B1 III | V404 Car - | - | Ceph - s.d.s. | 0.28 | 0.16 | 0.09 | 0.37 | 12.89 |
| 21 | 10 | B1 V | V401 Car - | - | Ceph | 0.29 | 0.18 | 0.17 | 0.37 | 11.84 |
| 22 | 43 | K5 | - | Hip-Tyc - | r.fg.s. | |||||
| 23 | 42 | A0 | - | Hip-Tyc - | ||||||
| 25 | 12 | B1 V | V402 Car - | - | Be(2) - b.s.(1) | 0.39 | 0.16 | 0.18 | 0.50 | 12.77 |
| 27 | 9 | B2 V | - | Hip-Tyc - | b.s.(1) | 0.26 | 0.07 | 0.13 | 0.31 | 11.59 |
| 28 | 13 | B1.5 V | - | - | 0.24 | 0.15 | 0.10 | 0.34 | 12.22 | |
| 30 | 15 | B1 V | - | - | s.d.s. | 0.28 | 0.21 | 0.14 | 0.24 | 12.55 |
| 31 | 28 | B1 V | - | - | - b.s.(1) | 0.27 | 0.29 | 0.11 | 0.34 | 12.63 |
| 33 | 17 | B2.5 V | V440 Car - | - | 0.23 | 0.11 | 0.11 | 0.22 | 11.75 | |
| 34 | 33 | B2 V | - | - | 0.34 | 0.21 | 0.13 | 0.40 | 11.95 | |
| 35 | 29 | B2 V | - | - | 0.31 | 0.18 | 0.12 | 0.36 | 12.06 | |
| 38 | - | B8 | - | Hip-Tyc - | b.bg.s. | |||||
| 47 | 31 | B2 V | - | - | 0.28 | 0.21 | 0.11 | 0.28 | 13.06 | |
| 48 | - | - | Hip-Tyc - | |||||||
| 96 | 30 | B5 V | - | - | 0.27 | 0.40 | 0.15 | 0.29 | 13.01 | |
| 115 | 35 | B7 V | - | - | 0.27 | 0.17 | 0.09 | 0.29 | 12.64 | |
| 116 | 34 | B8 V | - | - | 0.19 | 0.07 | 0.08 | 0.22 | 12.47 | |
| 120 | 32 | B8 V | - | - | Be(1) | 0.19 | 0.21 | 0.13 | 0.27 | 12.50 |
| Remarks: | Notes: | |
| b.s. = binary star | Ceph = beta cepheid star | - indicates numbering from FM80. |
| s.d.s. = star in double system | = likely emission star | - Spectral classification was taken from TGHH80 and FM80. |
| r.fg.s. = red foreground star | Be = Be star | - column contains spectrophotometric distance moduli. |
| b.bg.s. = blue background star | IRAS = Source IRAS 10338-5756 | - Remarks information is mainly from database. |
| Hip-Tyc = Star with paralax and proper motion measurements (see Table 1 for HIP/TYC identification) = Feast (1958); = Schild (1970); = Shobbrook (1980) |
4.2 Cluster distance and size
The distance of NGC 3293 was derived superposing the Schmidt–Kaler’s (1982)
ZAMS onto the reddening–free CMD. The best ZAMS fitting was achieved for a
distance modulus (error from eye–inspection).
We also applied the spectroscopic parallax method to 33 stars to get the cluster
distance modulus (using the relation of spectral types and from
Schmidt–Kaler 1982) that yielded . If only 17 stars of luminosity
class IV–V are used, the distance modulus turns out to be (see
last column in Table 3). The large dispersions of the moduli associated to the
spectroscopic parallax method may be intrinsic for early type stars (Conti &
Underhill 1988) or produced by a high percentage of variable and binary stars
(Feast, 1958). Our distance modulus is a bit larger than the ones given by Feast
(1958), , FM80, , TGHH80 ,
Shobbrook (1983), and lesser than the one from Balona &
Crampton (1974), . Notwithstanding, as at , all of
them are almost coincident, we adopted which
yields a cluster distance . The absolute magnitude scale
shown in Fig. 7 was set with this mean value.
When the above distance modulus is combined with the angular radius obtained in
section 3.1 it yields a linear cluster radius , comparable to
the sizes of other studied young open clusters as Cr 272, ; NGC 6231,
, and H-M 1, (from Vázquez et al. 1997; Baume et al. 1999
and Vázquez & Baume 2001 respectively). This result however disagrees with
the Janes et al. (1988) result that most of young clusters have diameters less
than .
4.3 Cluster age
4.3.1 Nuclear age
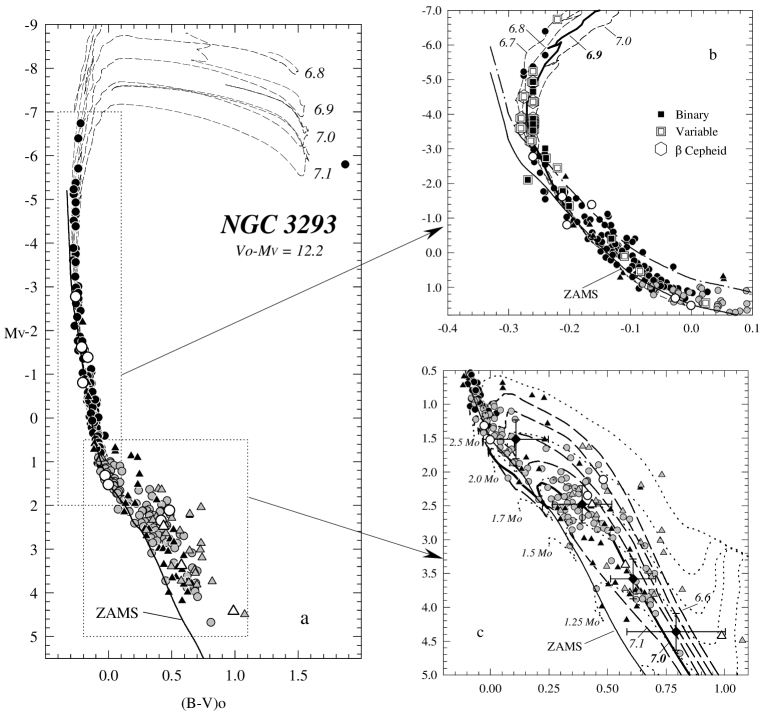
Regarding the nuclear age of NGC 3293, the isochrones derived from Girardi et
al. (2000) evolutionary models (computed with solar metallicity, mass loss and
overshooting) are shown in Fig. 7a-b superposed to the cluster upper main
sequence. Because an important fraction of bright members were de–reddened
using their spectral types some scatter arises that precludes a single
isochrone to fit the bright part of NGC 3293; binaries and fast rotators are
likely to be another source of scatter in upper CMD. The envelope of binaries
above the ZAMS encloses pretty well most of binary stars in the upper
main sequence. We draw the attention on the red super–giant (star #3) which is
not included by any isochrone (Fig. 7a), but it lies close to the isochrones of
. As many other red–supergiant stars, this star is not contained
by any isochrone, a frequent effect already reported in Meynet et al. (1993).
From stars with , the nuclear age of NGC 3293 goes from to
with a probable mean age of . The cluster is thus older than
in previous investigations, by TGHH80 and from HM82.
Such differences may have their origin in different (smaller) distance moduli
estimates and also in the use of different isochrone sets.
4.3.2 Contraction age
As indicated in section 3.2.2, a relevant feature emerging from the cluster
lower sequence (Fig. 7c) is that the left envelope of NGC 3293 does not follow
the shape of the ZAMS. The lower cluster sequence shows a bend at , lower of which it lies above the ZAMS approximately
constituting a parallel sequence that confirms the earlier assertion of HM82
that faint stars are mostly above the ZAMS.
As contamination of field interlopers has been already removed, the stars in
this parallel sequence have to be interpreted as stars in contraction phase
towards the ZAMS. The strong scatter at constant colour is a normal
feature associated to the age spread (Iben & Talbot 1966) among these type of
objects (cf. Fig. 3 in Preibisch & Zinnecker 1999). However, the contrast
between the wide PMS band and the sharp upper main sequence in Fig. 7c is
produced primarily by: a) differential reddening, that was not removed from the
main sequence faint stars (they were de–reddened using the mean excess values
derived in section 4.1) and, b) several intrinsic factors detailed below. In
overlaying in Fig. 7c the accretion evolutionary models developed by Bernasconi
& Maeder (1996) we find that the PMS objects have masses ranging from to
and ages from to , a PMS age range close to
found recently in the other Carina clusters Tr 14, Tr 15 and Tr 16
by Tapia et al. (2002) and confirmed in Tr 15 by Carraro (2002).
We do not find a single isochrone that fits the whole lower sequence; indeed PMS
stars tend to cross several of them. This lack of alignment led Iben & Talbot
(1966) to reject out the hypothesis of coeval star formation in the clusters NGC
2264 and NGC 6530. Recently, the same was done in NGC 2264 by Flaccomio et al.
(1999). Notwithstanding, departures from a single isochrone produced by
differential reddening, binarity/multiplicity, random distribution of accretion
discs around single and multiple systems, photometric errors and physical
uncertainties in the evolutionary models are expected to happen. The influence
of differential reddening is hard to estimate as it affects in different manners
different stars. As for binarity, it is very frequent not only among normal less
massive stars (, Bessell & Stringfellow 1993; Preibisch & Zinnecker
1999) but also among PMS stars (Hartigan et al. 1994). Binarity raises the stars
above a reference line (e.g. the ZAMS) in a way that depends on the mass ratio
of the binaries. As for the accretion stellar discs, their occultation and
emission, and also the random orientation of their angles, coupled with a
possible range of accretion rates (Kenyon & Hartmann 1990) introduce more
scatter among the PMS population.
To smooth these effects, the mean of the stellar distribution in Fig. 7c was
computed. Interestingly, the mean follows closely the isochrone of
shown by a thick line, except at . This is a magnitude point where
very often (Rachford & Canterna 2000, Phelps & Janes 1993; de Bruijne et al.
2000) a gap appears in many open clusters so that the statistics here may be
irrelevant. Therefore we adopt as the mean contraction age of the PMS
population in NGC 3293.
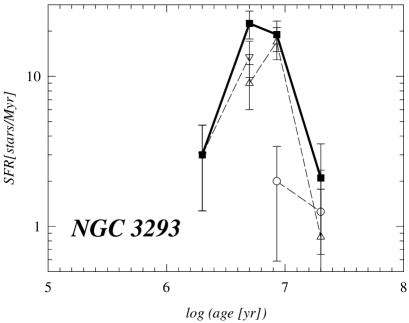
4.3.3 Star formation rate
Does the fact of finding a age spread among PMS objects indicate the
star formation process is not coeval? We examined the point computing individual
present–day masses of PMS stars and giving them the corresponding ages
interpolating among Bernasconi & Maeder (1996) models. Following Iben &
Talbot (1966) and Adams et al. (1983) definitions and procedures, we estimated
the star formation rate (SFR) in the cluster for three different stellar masses
bins. The results, shown in Fig. 8, suggest no dependence of the SFR with
stellar masses when allowing for the uncertainties involved in that kind of
computation (see Stahler 1985). Actually it seems to confirm that the stellar
formation in NGC 3293 took place in a very short period of time, mostly
between and ago.
4.3.4 Nuclear and contraction ages
The mean contraction age of the entire PMS population becomes comparable to the
mean nuclear age deduced from stars with since there is no
substantial difference between the and ages of evolved and PMS
stars respectively. Most important is that the early original age discrepancy of
found by HM82 is now strongly reduced. On the other hand, as mentioned
above, companion stars (Preibisch & Zinnecker 1999) overestimate the luminosity
of a given star (e.g., underestimating the luminosity of an M0 star by a factor
of 2 reduces its age by a factor of 4 and for a factor of 2 for a G5 star).
Also, the net effect of accretion stellar discs, as was mentioned above,
introduce scatter in luminosities that produce uncertainties of a factor of
in the age of an individual object (Kenyon & Hartmann 1990). We are
confident therefore, that the difference found between the mean
contraction age and the nuclear age, results irrelevant in view of the mentioned
effects.
Moreover, the error of the distance modulus can reduce or increase the
difference between both ages without affecting the nuclear age which remains
almost invariable. Besides, the “turn on” point position (see Fig. 7c) is not
very accurately determined but, allowing for the above uncertainties, it can
be placed at corresponding to a stellar mass
with a contraction age of close to the nuclear
age.
4.4 Cluster LF and IMF
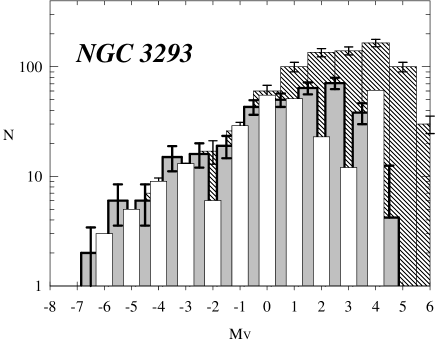
4.4.1 The Luminosity Function
The cluster LF gives the fraction of stars in each absolute magnitude bin of
size . The grey histogram in Fig. 9 shows the LF of NGC 3293
where known cluster binaries (see Table 3) were all corrected by and two
stars were counted instead of one. For comparison purposes we included also the
cluster LF earlier determined by HM82 and the cluster overall LF found by Phelps
& Janes (1993). Except by the strong dip present at in the HM82
LF, there is no important differences among the three LFs down to . From , HM82 LF differs from ours as the sharp dip at
is not revealed by our data. Somehow, that confirms the
suspicion of HM82 that the dip they found is an artifact produced by a
combination of incompleteness and eye-estimate of field faint star magnitudes.
Interesting enough, our LF as well as the HM82’s show an apparent low number of
stars for when comparing with the Phelps & Janes estimation: ours,
in particular, shows a flattening in the range . At this
point it is necessary to notice that all stars below are PMS
objects as we have already stated and their luminosities do not represent the
luminosities they will have in the ZAMS; depending on the star location, the
present star luminosity and the final in the ZAMS will differ for more than
changing the LF shape. Therefore, the cluster LF is only comparable to
another from main sequence objects (Wilner & Lada, 1991) in the range
.
4.4.2 The Initial Mass Function
Stellar masses were derived using an interpolation process (Baume et al 1994)
converting the , and values into and first, where a mass is assigned in this theoretical plane. The code
uses bolometric corrections from Schmidt-Kaler and interpolates among
evolutionary tracks reconstructing the path of a given star backwards to its
original point in the ZAMS. Bernasconi & Maeder (1996) tracks were used for
masses and Girardi et al. (2000) tracks for stars
above that mass limit. Appropriate mass bins were adopted to distribute stellar
masses as shown in Table 4 and the mass points are depicted on top of Fig. 10
with the count bars. To get the slope of the cluster IMF () we
used a weighted least squares method applied to different mass ranges whose
results are included at bottom of Table 4. The lowest mass bin has been excluded
of any calculations as it may be affected by effects described below. The
fitting of the most massive stars gives a steep slope with a high error value
(), however the portion that includes low and intermediate mass
stars yields a flatter slope (). The last value is closer to
the typical slope for field stars () and only marginally comparable
to the found by HM82.
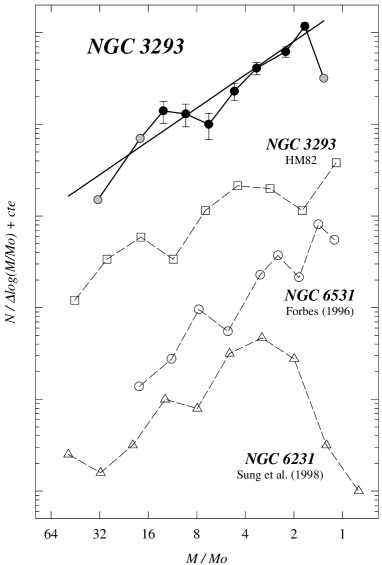
Figure 10 also includes IMFs of cluster of similar ages and the earlier IMF of
NGC 3293 determination made by HM82. Interesting common features are shown by
the three clusters in the figure. There is always an increasing star number till
a dip or flat zone appears. The mass range of the dip is not the same in the
three clusters. While ours happens at , it happens at
in the HM82 IMF. Coincident with ours is the dip at
in NGC 6231 but the most strange location corresponds to the
IMF of NGC 6531 whose dip happens at . The pattern is not easy
to explain but the differences in the mass may reflect differences in the method
of assigning masses on the ZAMS according to the evolutionary models used.
Notes: (a) Approximated values valid for the evolutionary status of NGC 3293. (b) Known binaries and incompleteness effects were considered.
4.4.3 Uncertainties in the LF and the IMF
There are three main sources of uncertainties in the determination of both, the
LF and the IMF: the field star correction, the incompleteness of the photometry
and the unresolved binaries. Other effects of course do contribute, but the
mentioned are the most difficult to assess. As for the removal of the star field
contamination we are confident on the goodness of our method and the choice of
the areas. Incompleteness is a bit more complex phenomenon to quantify. An
analysis of the completeness factors was presented in section 2 and to remove
in part this effect, we applied those factors to the amount of stars in each
bin of our LF. However, our conclusions may still be affected for incompleteness
at the lowest luminosity bin. This uncertainty was minimised in our estimation
of the LF that was set in the range from to and was also minimised in
the computation of the IMF by excluding the lowest mass bin. Unresolved
binaries, however, may influence the entire mass range. We will just describe
the probable effect on our determination as the issue has been treated by many
worker and detailed calculation have been already performed. Under the
hypothesis that stellar masses of binary components are randomly distributed
Sagar & Richtler (1991) studied the mass range finding
that, if a fraction of binaries is present in a given cluster, its IMF
slope undergoes a flattening of for an initial slope of . Lower
initial slopes are less flattened according to these authors. Another analysis
made by Kroupa et al. (1991, 1992) and Kroupa & Gilmore (1992) also dealt with the
point reaching the conclusion that if a Salpeter model is assumed, results lead
to an apparent deficiency of low mass stars. This effect is probably the one
producing the apparent deficiency of stars in the LF of NGC 3293 when compared
to the overall LF of Phelps & Janes (as marginally shown in Fig 9).
5 The search for stars with emission
| Likely emission stars. | ||||||||||||||||
| 31 | 28 | - | 199.7 | 340.9 | 10. | 27 | -0. | 66 | 0. | 01 | 0. | 00 | 0. | 05 | -1. | 33 :: |
| 63 | - | 277 | 196.9 | 85.5 | 12. | 02 | -0. | 28 | 0. | 22 | 0. | 18 | 0. | 39 | -1. | 14 :: |
| 67 | 117 | - | 124.6 | 570.0 | 12. | 10 | -0. | 38 : | 0. | 28 | 0. | 05 | 0. | 44 | -1. | 42 :: |
| 85 | - | 264 | 208.8 | 170.1 | 12. | 34 | -0. | 48 | 0. | 10 | 0. | 11 | 0. | 23 | -1. | 02 :: |
| 297 | - | 287 | 506.0 | 130.0 | 14. | 56 | 0. | 20 | 0. | 31 | 0. | 19 | 0. | 43 | -0. | 72 |
| 324 | - | 286 | 546.9 | 125.0 | 14. | 69 | 0. | 25 | 0. | 31 | 0. | 19 | 0. | 42 | -1. | 21 |
| 361 | - | - | 236.4 | 702.4 | 14. | 93 | . | . | 0. | 25 | . | -0. | 52 | |||
| 397 | - | 288 | 487.3 | 131.0 | 15. | 22 | 0. | 40 | 0. | 77 | 0. | 47 | 0. | 87 | -0. | 81 |
| 438 | - | 275 | 312.3 | 64.0 | 15. | 45 | 0. | 22 | 0. | 70 | 0. | 43 | 0. | 86 | -0. | 56 |
| 819 | - | - | 816.0 | 195.5 | 17. | 15 | . | . | 0. | 72 | . | -2. | 25 :: | |||
| 989 | - | - | 602.4 | 765.1 | 17. | 72 | . | . | 0. | 65 | . | -2. | 33 :: | |||
| 1544 | - | - | 771.5 | 519.2 | 19. | 62 | . | . | 0. | 70 | . | -0. | 86 : | |||
| Probable emission stars. | ||||||||||||||||
| 271 | - | - | 285.0 | 722.4 | 14. | 40 | . | . | 0. | 26 | . | -0. | 45 | |||
| 391 | - | - | 351.9 | 723.8 | 15. | 16 | . | . | 0. | 44 | . | -0. | 39 | |||
| 458 | - | - | 147.0 | 665.3 | 15. | 58 | 0. | 13 : | 0. | 72 : | 0. | 30 | 0. | 80 : | -0. | 43 |
| 648 | - | - | 170.2 | 663.8 | 16. | 47 | 0. | 46 : | 0. | 87 : | 0. | 41 | 0. | 97 : | -0. | 38 |
| 926 | - | - | 323.4 | 91.2 | 17. | 52 | 0. | 95 :: | 1. | 28 | 0. | 77 | 1. | 50 | -0. | 39 |
| 1448 | - | - | 667.3 | 722.6 | 19. | 20 | . | . | 0. | 71 | . | -0. | 55 : | |||
| 1599 | - | - | 634.7 | 748.2 | 19. | 93 : | . | . | 0. | 67 : | . | -0. | 47 :: | |||
Notes: - and means star numbers from TGHH80 and HM82 respectively.
-Colon (:) and double colon (::) indicate data with errors larger than 0.04 and 0.10 respectively.
One of the aims of this work is the detection of stars with
emission. To assess whether a star shows emission, we used the
(hereafter ) index. Similar
indices has been already used in other works (Adams et al. 1983; Sung et al.
1998). We want to mention that due to poor weather conditions, the seeing
during the exposures of frames was large ()
producing distortions in the final photometry of the stars, especially those
with close companions. That, probably, yielded the high errors generated by
DAOPHOT, especially in the frames.
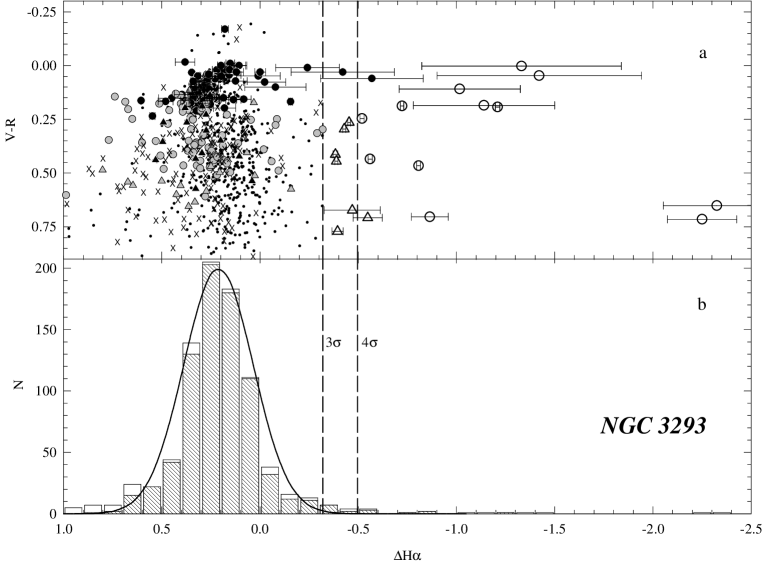
Figure 11b shows the histogram (white) of values including
all stars. The hatched one contains only stars with errors and was
fitted with a Gaussian distribution function over the interval
with mean value
and standard deviation
. The mean value, which is assumed to
correspond to non–emission objects, is close to the values found by Adams et
al. (1983) in NGC 2264 () and NGC 7089 (). However, the dispersion
among our data is over twice the value found in NGC 2264 by them.
Following Adams et al. reasoning, we identify a probable emission
star when its index value is (further than
from the mean value) and a likely emission star if it is
(further than ). All stars showing
evidences of emission were plotted with white symbols in the photometric
diagrams. It is interesting to mention the clear separation of stars with
emission when values are plotted against the
index (see Fig. 11a). We are aware that this procedure only detect stars
with high emission while most of PMS stars show weak
emission making their detection much harder (Preibisch & Zinnecker 1999).
Nineteen stars, listed in Table 5, show evidences of having
emission. Their spatial locations in the NGC 3293 area (shown in Fig. 1) is
interesting as eleven of them lie in the external border of the cluster and just
another three are inside the cluster limits. From the spatial point of view
there is no concentration of emission stars towards the cluster centre what
suggests that the surrounding material of PMS stars in the cluster centre, that
usually should produce emission, has already been swept away by
the powerful radiation field of the most massive stars. Such a possibility has
been suggested for explaining the lack of emission stars in NGC 6231 (Sung et
al. 1998) and in Upper Scorpius OB Association (Preibisch & Zinnecker 1999). If
this is true, the rest of PMS included in the cluster area should be weak–lined
PMS stars only detectable as X–ray emitters (Montmerle 1996).
6 Discussion
Uncertainties in the memberships and also in the stellar age assignment make
difficult the interpretation of the star formation process in an open cluster.
These uncertainties can lead to a wrong estimate of the star formation rate and
therefore to a misinterpretation of the entire process. We attempted to reduce
such uncertainties by verifying the reliability of the field star sample used to
remove the contribution of field stars and proving that no mass segregation is
present in NGC 3293. Moreover, when removing the field contribution from the
CMDs of NGC 3293 we chose limits which define the PMS band in terms of both,
extension and wide at a high level of credibility so that only a few stars must
have been lost by this procedure. So, we do not expect our conclusions are
seriously affected (qualitatively speaking).
As noticed above, the lack of coincidence between the mean stellar distribution
of PMS stars and a given isochrone has been historically used as evidence
against the coeval hypothesis (Iben & Talbot 1966); in the present case there
is a strong coincidence. There is a difference between the mean nuclear
age and the mean contraction age, but it can be explained in terms of the
various effects already mentioned. There is no chance either that the age
difference between massive and PMS stars reaches the high value of
indicated by HM82. That stars in NGC 3293 were all formed in a short period of
time is additionally supported by the “turn–on” mass location at
(compatible with a contraction time ranging from to
) and by the most evolved star in the cluster, the red super–giant,
which is old, thus equalising the mean age of PMS stars.
The computation of the SFR confirms the above suggestions in the sense that no
total increasing SFR, as proposed in other clusters (e.g. NGC 6530 and NGC 2264,
Iben & Talbot 1966) is evident in NGC 3293. Indeed, the picture of this cluster
could be similar to the re–interpretation of NGC 2264 and 6530 data (from Iben
& Talbot 1966) made by Stahler (1985). This author found no obvious mass–age
correlation but that the star formation in these two clusters took place in a
period of time from to . A similar results has been reported for the
Upper Scorpius OB Association (Preibisch & Zinnecker 1999; Preibisch et al.
2002) and for the Scorpius–Centaurus OB Association (Mamajek et al. 2002) where
was not found either evidences for a real age spread among PMS stars as the
stellar formation proceeded during a short but intense burst of a few millions
years, probably triggered by a supernova event.
7 Conclusions
We have investigated the open cluster NGC 3293 area with deep broad band and
photometry obtaining a picture of its main sequence structure down
to . The picture demonstrates that the upper part of its
sequence is composed by stars evolving off the ZAMS, the mid one mostly includes
stars on the ZAMS yet and the lower main sequence consists of stars that are
placed above the ZAMS becoming a PMS population.
Clear indications confirming the existence of a PMS population in this cluster
are presented after a very careful removal of the field star contamination and
also from the finding of emission stars. Our analysis yielded that
NGC 3293 is placed at a distance and has a angular radius
(). The absorption law affecting the cluster is normal although it is
close to the northern part of the HII region NGC 3372. In this last particular
place, abnormal extinction laws have been found (e.g. Vázquez et al. 1996;
Tapia et al. 2002; Carraro et al. 2002). Following the common pattern of
clusters in this galactic region, NGC 3293 shows, however, differential
reddening surely produced by intracluster material.
Superposition of modern isochrones indicates this object has a nuclear age of
and almost a similar mean value of was found among its
faintest, PMS, stars. Therefore, the star formation in NGC 3293 appears to be
coeval. Hints that star formation still continues (although at a probably low
rate) in NGC 3293 is given by the detection of stars showing
emission. These stars are not concentrated towards the cluster centre but they
tend to lie in the cluster periphery determined by star counts. The most likely
explanation for this lack of concentration may be found in the fact that the
radiation field of massive stars has swept away the material that surrounds the
PMS stars.
The computation of the cluster LF did not show the strong dip in its structure
nor the halo structure of faint stars, as previously suggested by HM82. As many
other young clusters (Tr 14, Vázquez et al. 1996; NGC 6231, Baume et al.
1999; or Pismis 20, Vázquez et al. 1995) we found that the IMF of NGC 3293
has a slope value . This value is of the same order than the
one found by Massey et al. (1995) who investigated many open clusters and
associations in the Galaxy, the LMC and the SMC finding a mean slope values of
.
This article is partially based in the Digitized Sky Survey that was produced at the Space Telescope Science Institute under US government grant NAG W-2166. Original plate material is copyright the Royal Observatory Edinburgh and the Anglo–Australian Observatory. This research, also, has made use of the database, operated at , Strasbourg, France.
Acknowledgements.
The authors acknowledge the financial support from the Facultad de Ciencias Astronómicas y Geofísicas de La UNLP and the IALP–CONICET. Special thanks are given to Dr. Garrison for the allocation of telescope time at UTSO and to the CASLEO staff for the technical support. G.B. gratefully acknowledges the collaboration of the Università di Padova (Italy) during a postdoctoral grant.References
- (1) Abt H.A., 1979, ApJ 230, 485
- (2) Adams M.T., Strom K.M., & Strom S.E., 1983, ApJS 53, 893
- (3) Balona L.A. & Crampton D., 1974, MNRAS 166, 203
- (4) Balona L.A., 1975, MmRAS 78, 51
- (5) Balona L.A., 1994, MNRAS 267, 1060
- (6) Balona L.A. & Engelbrecht C., 1981. Workshop on Pulsating B stars, p. 195. Eds. G.V.O.N. & C. Sterken, Nice Observatory
- (7) Balona L.A. & Engelbrecht C., 1983, MNRAS 202, 293
- (8) Baume G., Paoli S., Vázquez R.A., & Feinstein A., 1994, RMxAA 29, 212
- (9) Baume G., 1999, Ph.D. thesis, Universidad Nacional de La Plata
- (10) Baume G., Vázquez R.A., & Feinstein A., 1999, A&A 137, 233
- (11) Battinelli P., Capuzzo–Dolcetta R., & Nesci R., 1991, MemSAIt 62, 915
- (12) Bernasconi P.A. & Maeder A., 1996, A&A 307, 829
- (13) Bessell M.S. & Stringfellow G.S., 1993, ARA&A 31, 433
- (14) Carraro G., 2002, MNRAS 331, 785
- (15) Carraro G., Ventura P., Romanielo M., & Patat F., 2002, (submitted to A&A)
- (16) Conti P.S. & Underhill A.B., 1988, In “O stars, & Wolf–Rayet stars”, Monograph Series of non–thermal phenomena in stellar atmospheres, CNRS and NASA, Conti P.S. and Underhill A.B. (eds.)
- (17) Cousins, A.W.J., 1978, MNSSA 37, 62
- (18) Chen B., Carraro G., Torra J., & Jordi C., 1998, A&A 331, 916
- (19) de Bruijne J.H.J., Hoogerwerf R. & de Zeeuw P.T., 2000, ApJ 544, L65
- (20) Dean J.F., Warren P.R., & Cousins A.W.J., 1978, MNRAS 183, 569
- (21) Deeg H.J. & Ninkov Z., 1996, A&AS 119, 221
- (22) ESA, 1997, The Hipparcos and Tycho Catalogues, ESA SP-1200
- (23) Feast M.W. 1958, MNRAS 118, 618
- (24) Feinstein A. & Marraco H.G., 1980, PASP 92, 266
- (25) Flaccomio E., Micela G., Sciortino S., & Favata F., Corbally C., & Tomaney A., 1999, A&A 345, 521
- (26) Forbes D., 1996, AJ 112, 1073
- (27) Girardi L., Bressan A., Bertelli G., & Chiosi C., 2000, A&AS 141, 371
- (28) Hartigan P., Strom K.M., & Strom S.E., 1994, ApJ 427, 961
- (29) Herbst W. & Miller D.P., 1982, AJ 87, 1478
- (30) Hillenbrand L.A., Massey P., Strom S.E., & Merrill K. M., 1993, AJ 106, 1906
- (31) Iben I. & Talbot R.J., 1966, ApJ 144, 968
- (32) Janes K.A., Tilley C., & LingåG., 1988, AJ 95, 771
- (33) Kenyon S.J. & Hartmann L.W., 1990, ApJ 349, 197
- (34) Kroupa P., Tout C.A. & Gilmore G., 1991, MNRAS 251, 293
- (35) Kroupa P., Gilmore, G. & Tout C.A., 1992, AJ 103, 1602
- (36) Kroupa P. & Tout C.A., 1992, MNRAS 259, 223
- (37) Lada C.J., Margulis M. & Deaborn D., 1984, ApJ 285, 141
- (38) Lada E.A., Strom K.M. & Meyers P.C., 1993, in Prototstars and Planets III, edited by E.H. Levy and J.I. Lunine (University of Arizona Press, Tucson), p. 245
- (39) Lada E .A. & Lada C.J., 1995, AJ 109, 1682
- (40) Landolt, A.U., 1992, AJ 104, 340
- (41) Mamajek E.E., Meyer M.R., & Liebert J., 2002, AJ 124, 1670
- (42) Massey P., Johnson K.E., & DeGioia–Eastwood K., 1995, ApJ 454, 151
- (43) Meynet G., Mermilliod J.-C., & Maeder A., 1993, A&AS 98, 477
- (44) Mermilliod J.-C., 1976, A&A 53, 289
- (45) Montmerle, T., 1996, in ASP Conf. Ser. 109, Ninth Cambridge Workshop on Cool Stars, Stellar Systems, and the Sun, ed. R. Pallavicini & A.K. Dupree (San Francisco: ASP), 405
- (46) Patat F. & Carraro G., 2001, MNRAS 325, 1591
- (47) Phelps R.L. & Janes K.A., 1993, AJ 106, 1870
- (48) Preibisch T. & Zinnecker H., 1999, AJ 117, 2381
- (49) Preibisch T., Brown A.G.A., Bridges, T., Guenther E., & Zinnecker H., 2002, AJ 124, 404
- (50) Prisinzano L., Carraro G., Piotto G., Seleznev A.F., Stetson P.B., & Saviane I., 2001, A&A 369, 851
- (51) Rachford B.J. & Canterna R., 2000, AJ 119, 1296
- (52) Sagar R. & Richtler T., 1991, A&A250, 324
- (53) Sanner J. & Geffert M., 2001, A&A 370, 87
- (54) Scalo J, 1986, Fund. Cos. Phys. 11, 1
- (55) Schild R.E., 1970, ApJ 161, 855
- (56) Schmidt–Kaler Th., 1982, in Landolt–Bornstein VI/2b
- (57) Shobbrook R.R., 1980, MNRAS 192, 821
- (58) Shobbrook R.R., 1983, MNRAS 205, 1215
- (59) Stahler S.W., 1985, ApJ 293, 207
- (60) Stahler S.W. & Fletcher A.B., 1991, MemSAIt 62, 767
- (61) Stetson P.B., 1987, PASP 99, 191
- (62) Sung H., Bessell M.S., & Lee S.-W., 1998, AJ 115, 734
- (63) Tapia M., Roth M., Vázquez R. A., & Feinstein A., 2002, (submitted to MNRAS)
- (64) Turner D.G., Grieve G.R., Herbst W., & Harris W.E., 1980, AJ 85, 1193
- (65) van den Bergh S. & Sher D., 1960, Pub. of the DDO 2, 203
- (66) Vázquez R.A. & Feinstein A., 1991, A&AS 90, 317
- (67) Vázquez R.A., Baume G., Feinstein A., & Prado P., 1994, A&AS 106, 339
- (68) Vázquez R.A., Will J.-M., Prado P., & Feinstein A., 1995, A&AS 111, 85
- (69) Vázquez R.A., Baume G., Feinstein A., & Prado P., 1996, A&AS 116, 75
- (70) Vázquez R.A., Baume G., Feinstein A., & Prado P., 1997, A&AS 124, 13
- (71) Vázquez R.A. & Baume G., 2001, A&A 371, 908
- (72) Walker M.F., 1957, ApJ 125, 636
- (73) Walker M.F., 1961, ApJ 133, 438
- (74) Wilner D.J. & Lada C.J., 1991, AJ 102, 1050