CO Molecular Gas in Infrared Luminous Galaxies
Abstract
We present the first statistical survey of the properties of the 12CO(1-0) and 12CO(3-2) line emission from the nuclei of a nearly complete subsample of 60 infrared (IR) luminous galaxies selected from SCUBA Local Universe Galaxy Survey (SLUGS). This subsample is flux limited at 5.24 Jy with far-IR (FIR) luminosities mostly at 1010 L⊙. We compare the emission line strengths of 12CO(1-0) and (3-2) transitions at a common resolution of 15′′. The measured 12CO(3-2) to (1-0) line intensity ratios vary from 0.22 to 1.72 with a mean value of 0.66 for the sources observed, indicating a large spread of the degree of excitation of CO in the sample. These CO data, together with a wide range of data at different wavelengths obtained from the literature, allow us to study the relationship between the CO excitation conditions and the physical properties of gas/dust and star formation in the central regions of galaxies. Our analysis shows that there is a non-linear relation between CO and FIR luminosities, such that their ratio / decreases linearly with increasing . This behavior was found to be consistent with the Schmidt Law relating star formation rate to molecular gas content, with an index = 1.4 0.3. We also find a possible dependence of the degree of CO gas excitation on the efficiency of star forming activity. Using the large velocity gradient (LVG) approximation to model the observed data, we investigate the CO-to-H2 conversion factor for the SLUGS sample. The results show that the mean value of for the SLUGS sample is lower by a factor of 10 compared to the conventional value derived for the Galaxy, if we assume the abundance of CO relative to H2, = 10-4. For a subset of 12 galaxies with H I maps, we derive a mean total face-on surface density of H2+H I of about 42 M⊙ pc-2 within about 2 kpc of the nucleus. This value is intermediate between that in galaxies like our own and those with strong star formation.
1 Introduction
Knowledge of the properties and evolution of the gas and dust content in IR luminous galaxies is essential for understanding the cause and temporal evolution of starburst activity. In particular, studies of such galaxies in the nearby universe are essential as a step in understanding the role of the starburst phenomenon in the cosmic evolution of galaxies. Therefore, there is a need to investigate large statistical samples of IR luminous galaxies using a multitude of different types of data, including CO, H I, and continuum in the submillimeter (sub-mm), FIR and radio, in order to constrain theories of how the interstellar medium (ISM) evolves (e.g. Eales & Edmunds, 1996, 1997). A significant step was achieved by Dunne et al. (2000) for the nearby universe by investigating the sub-mm properties of the dust in a complete sample of 104 galaxies. The SLUGS survey is based on the Revised Bright Galaxy Sample of IRAS galaxies (Soifer et al., 1987) within -10∘ +50∘ and with 1900 km s-1 and a flux limit of 5.24 Jy. By virtue of the selection, the SLUGS galaxies have the FIR luminosity 1010 L⊙, and hence have greater than the average star formation rate. A study of molecular gas of a complete flux-limited subsample is important to complement the study of the dust.
Low lying CO rotational line transitions at mm and sub-mm wavelengths are often used as tracers of molecular hydrogen. It is valid for molecular clouds in the Galaxy and also for external galaxies. The J = 3 level is at 33 K with a critical density of 1.5 104 cm-3, compared to the J = 1 and 2 levels of 12CO are lying respectively at 5.5 and 17 K above the ground level, and with respective critical densities 7.4 102 and 4.9 103 cm-3 for a kinetic temperature = 30 K in the optically thin limit (Jansen, 1995). Therefore, the 12CO(3-2) transition is a better tracer for the warmer and/or denser molecular gas in star forming regions. Furthermore, the ratio of 12CO(3-2) to (1-0) line emission provides a more sensitive measure of the gas temperature and density than the ratio of 12CO(2-1) to (1-0) lines. The first detection of the 12CO(3-2) line in the nearby starburst galaxy was that in IC 342 reported by Ho (1987). Many observations of the 12CO(1-0) and 12CO(2-1) lines have since been made in local galaxies (e.g. Sanders et al., 1991; Braine & Combes, 1992; Braine et al., 1993; Young et al., 1995; Chini et al., 1996, and many others). Most observations of the 12CO(3-2) line cover the central region of nearby objects (e.g. Devereux et al., 1994; Mauersberger et al., 1999; Dumke et al., 2001), where the physical conditions of molecular gas may be different from those prevailing in molecular clouds in the disk of the Galaxy. Extended maps of 12CO(3-2) line for three nearby normal galaxies were reported by Wielebinski et al. (1999).
The weaknesses of most of the previous studies on CO molecular gas are the small numbers of objects or the lack of uniform selection criteria, whereas their strength is the production of maps with high linear resolution. In this paper, we address the aforementioned weaknesses by presenting the largest statistical survey of 12CO(1-0) and 12CO(3-2) point measurements from the central regions in a complete subsample of 60 IR luminous sources from SLUGS (Dunne et al., 2000). The angular resolutions of the 12CO(1-0) observations at the Nobeyama Radio Observatory (NRO) and the 12CO(3-2) observations at the James Clerk Maxwell Telescope (JCMT) are nearly identical, so that no assumptions need be made about differing beam dilution factors. The beamsize ( 15′′) is also nearly identical to that of the SLUGS survey by Dunne et al. (2000). Together with the 850 m fluxes, plus existing data on H I (Thomas et al., 2002), radio continuum (Condon et al., 1990), and far-IR (Dunne et al., 2000, NED111The NASA/IPAC Extragalactic Database (NED) is operated by the Jet propulsion Laboratory, California Institute of Technology, under contract with the National Aeronautics and Space Administration.), we are able to search for a relationship between the degree of excitation of the CO in this sample and the star forming properties.
It is now suspected that the 12CO(3-2) line emission makes up a substantial fraction of the SCUBA flux at 850 m for starburst galaxies (e.g. Papadopoulos & Allen, 2000; Zhu et al., 2003). Our 12CO(3-2) observations provide an important database for correcting the SCUBA sub-mm data in the SLUGS sample, thus permitting a revised characterization of the dust, which will be presented in a separate paper.
Finally, our investigations on the gas and dust properties in starburst regions provide an opportunity to investigate the controversial parameter , the ratio of molecular hydrogen mass (H2) and the 12CO(1-0) luminosity , based on the LVG method (Goldreich & Kwan, 1974). We obtain an estimate for this parameter which depends on , the abundance of CO relative to H2. We also use our estimate of this parameter to investigate the molecular gas content of our SLUGS subsample.
We assume = 0.5 and = 75 km s-1 Mpc-1 throughout for consistency with previous work on these galaxies (e.g. Dunne et al., 2000).
2 Observations
2.1 12CO(1-0) Observations at NRO
Two observing runs measuring the 12CO(1-0) line at 115.27 GHz for 46 SLUGS galaxies were made with NRO 45m telescope between 2001 April 12 - 19 and 2001 November 28 - December 1, using the SIS receiver S100 (single side band or SSB). The wide band acousto-optical spectrometer (AOS) was used as the back end which provided a total usable bandwidth of 250 MHz and a frequency resolution of 250 KHz. At 115.27 GHz, these correspond to a total velocity coverage of 650 km s-1 and velocity resolution of 0.65 km s-1. The NRO 45m telescope beamsize (FWHM) at this frequency is 14.6′′. The standard source Mars was used for the determination of the main beam efficiency. The measurement yields = 0.34 0.04 after averaging the results from the first and second runs. The average uncertainty in the calibration of spectral line is 10%.
Position switching in azimuth was employed with about 20 seconds each for both ON and OFF positions, 10 sec to move from ON to OFF or from OFF back to ON, so that about one minute was required for each ON-OFF sequence or scan. Since about 30 scans were made for each source, the total integration time per pointing is about 30 minutes. Telescope pointing was checked every half hour by observing strong SiO maser lines from nearby evolved stars with receiver S40 at 43 GHz. The average pointing error was 3.0′′ (r.m.s.) for the first observing run and 2.6′′ (r.m.s.) for the second run at low wind speed. The weather conditions were average during the NRO observing runs and the system temperature for good weather conditions was 535 K. However, half of the observing time was lost for each run due to poor weather conditions. The total number of sources observed at this transition is 51, out of a total sample of 60.
2.2 12CO(3-2) Observations at JCMT
Observations of the 12CO(3-2) line at 345.80 GHz for the selected 60 SLUGS galaxies were obtained with the 15m JCMT on 2001 April 23 - 28 and 2002 June 25. We used the dual-channel receiver B3 in single-sideband mode, and the Digital Autocorrelation Spectrometer (DAS) spectrometer with a bandwidth of 920 MHz ( 800 km s-1) and a frequency resolution of 750 KHz ( 0.65 km s-1). Focus and pointing were monitored frequently by observing bright continuum sources and planets. The average pointing error (r.m.s.) was found to be 3.2′′. The observations were performed by using beam-switching at a frequency of 1 Hz with a beam throw of 180′′ in azimuth. The JCMT beamsize (FWHM) at this frequency is 14.4′′. The main-beam efficiency was determined by averaging four measurements based on observations of Mars, yielding a value of = 0.50 0.05. The spectral line calibration was checked each night by measuring 12CO(3-2) line emission from IRC+10216. The mean calibration error is 10%. The weather conditions for these observations were good, and the average system temperature was 600 K.
3 Results
3.1 The Spectra
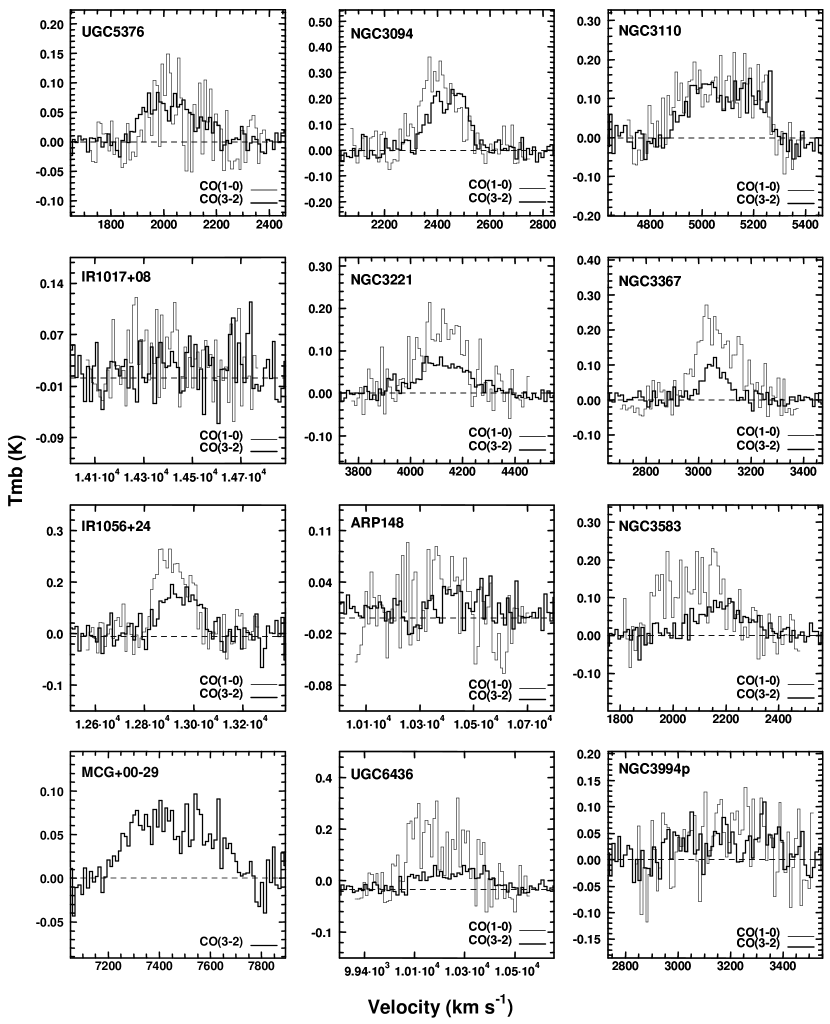
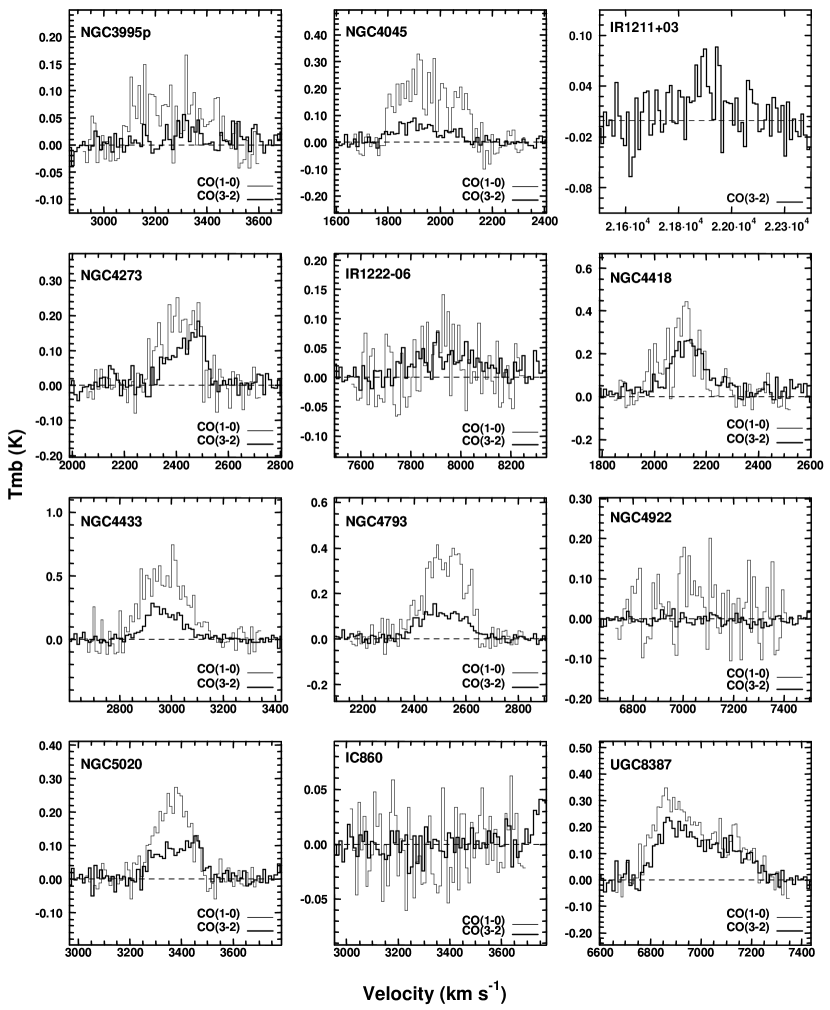
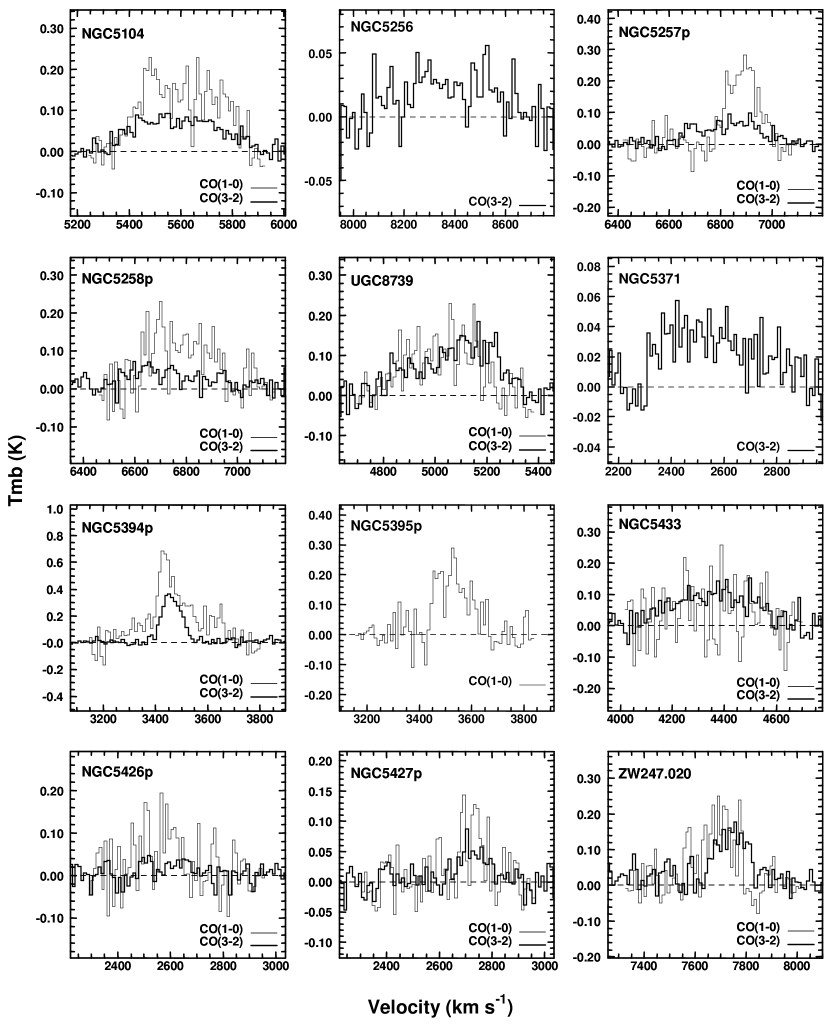
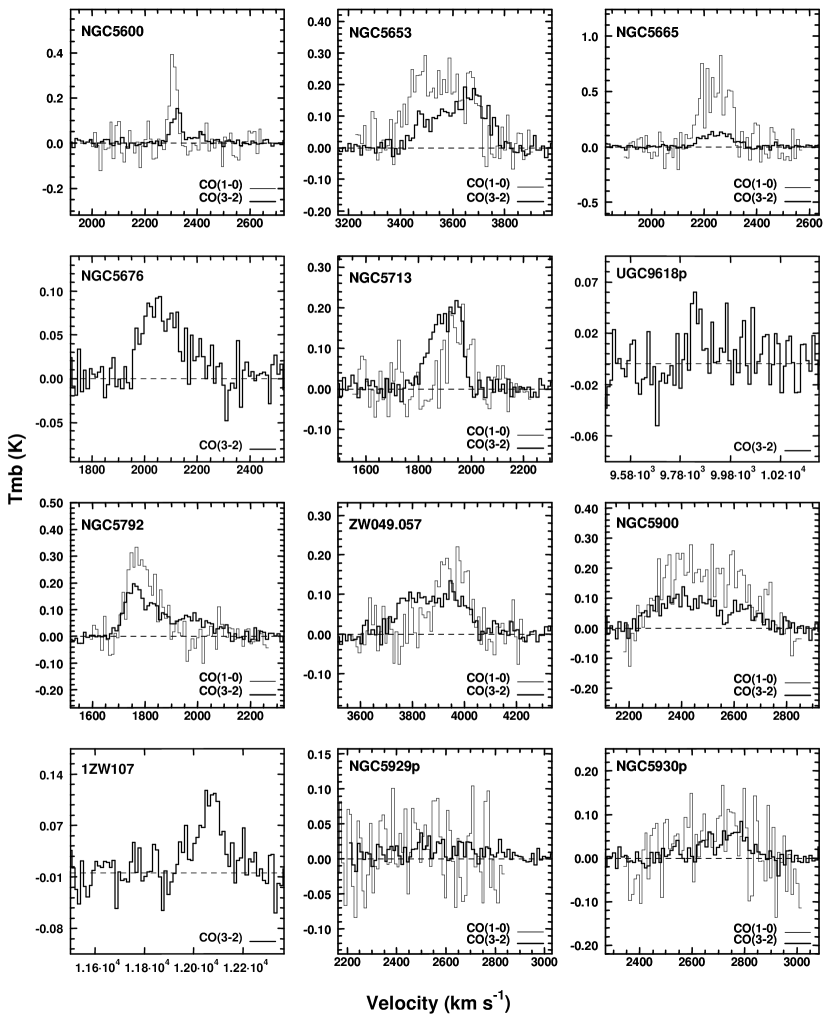
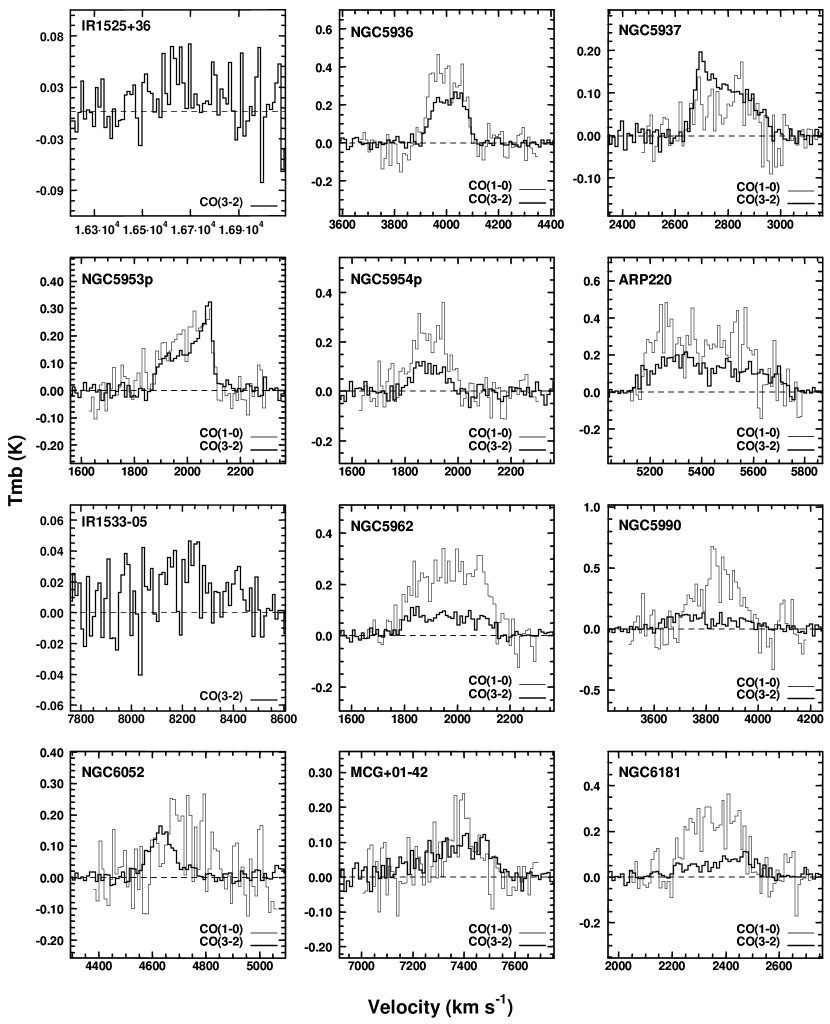
The reduction of the 12CO(1-0) data was performed using the NRO NEWSTAR package, and the 12CO J=3-2 data were reduced using the JCMT SPECX package. The 12CO(1-0) line spectra for 51 galaxies together with the spectra of 12CO(3-2) line emission for 59 galaxies are presented in Fig. 1. A linear baseline was subtracted from each spectrum for both data sets, and the spectra were smoothed to 10.2 km s-1 and 11.2 km s-1 for the NRO and the JCMT data respectively. We converted the measured antenna temperature scale of both spectra to the main-beam temperature scale by using the relation = /. The main-beam efficiencies of NRO and JCMT telescopes are given in § 2. The JCMT and NRO line profile shapes mostly agree with each other. The ones that show discrepancies may in some instances be due to pointing error.
3.2 CO and FIR Luminosities
The velocity-integrated intensities of 12CO(1-0) line emission and 12CO(3-2) line emission corresponding to the common telescope beamsize of 15′′ are shown in Table 1. The uncertainties for the integrated line intensities include components due to noise, the uncertainty in the beam efficiencies and the calibration of spectral line, combined quadratically. The luminosities associated with the beamsize of 15′′, in units K km s-1 Mpc2 , were calculated using equations 1(a) and 1(b) below and are presented in Table 2. Both equations 1(a) and 1(b) were derived by transforming the relevant parameters from the rest frame to the observer frame.
| (1a) | |||||
| (1b) | |||||
where is the luminosity distance of a galaxy in Mpc, = (1+z), and is the proper distance of the galaxy (see Table 1), the integrated line intensities and have units of K km s-1, and is the beam solid angle. The numerical value of is constant for all observations and has been set to unity for simplicity. For conversion to absolute luminosities, the value of = 1.1 10-3 sterradians.
Fig. 2 shows a comparison between the CO luminosities and FIR luminosities for two different FIR color regimes. The quantity here corresponds to the volume marked by a 15′′ beam obtained by applying a scale factor to the total FIR luminosity (from Dunne et al. 2000). This factor is derived from the original SCUBA images which have a resolution of 15′′ and from radio continuum images (Condon et al., 1990) convolved to 15′′. It measures the ratio of flux within the beam to the total flux. It is less than unity if the source is resolved by the telescope beam and equal to unity for an unresolved source. It is assumed here that the FIR brightness distribution is similar to that for the sub-mm/cm and radio continuum. A linear fit to each transition in the log-log plane yields
| (2a) | |||||
| (2b) | |||||
The r.m.s. dispersion for the fits is about a factor of 3 and 2 for 12CO(1-0) and 12CO(3-2) respectively. The scatter is much larger than the errors measured for the telescopes indicated by the error bars in the plots. Variations in the CO-to-H2 conversion factor may be responsible for part of the scatter. The larger scatter seen in the 12CO(1-0) plot may be due to the larger baseline ripple measured at this transition.
It is evident that the CO luminosities at both transitions increase non-linearly with increasing , such that the ratio / decreases with increasing . Fig. 3 shows a plot of the ratio of / versus the projected beamsize on the galaxies, to test whether this effect is introduced by partially resolving the nearby galaxies. No relationship is evident, indicating that the total luminosity of the galaxy is the primary factor. The implications of this result will be discussed in § 4.1.
3.3 The 12CO(3-2)/(1-0) Line Intensity Ratio
For the 48 galaxies with data at both transitions, we calculate the intensity ratios of the two transitions using the equation,
| (3) |
The results along with the asymmetric uncertainties are given in Table 1. The asymmetric errors of are derived analytically, assuming the error distributions of and are Gaussian functions. The asymmetric confidence intervals in Table 1 represent an enclosed probability of 68%.
The values of range from 0.22 (for NGC 5665) to 1.72 (for NGC 5937). There are seven sources with 1, namely UGC 5376, IR 1222-06, UGC 8739, NGC 5433, NGC 5713, NGC 5937, and MCG +01-42, signifying very high excitation coupled with low optical depth. However, UGC 5376, IR 1222-06, and MCG +01-42 have high uncertainties in , leaving only four whose values are significantly greater than 1.0. In our sample, thirteen galaxies have ratios less than 0.4, the average value of derived from the giant molecular clouds in the Galaxy (Sanders et al., 1993).
The mean value of for SLUGS sample is 0.66, close to that of 0.63 measured for 28 galaxies with strong CO emission published by Mauersberger et al. (1999). The quantity ranges from 109 to 1012 L⊙ in the Mauersberger sample, compared to the range 1010 - 1012 L⊙ in SLUGS sample. Fig. 4 shows a comparison between the distributions of for the SLUGS sample and those measured by Mauersberger et al. (1999). The probability of a significant difference between these two distributions is 68% using a Kolmogorov-Smirnov test. This implies that these two distributions are not significantly different. The galaxies observed by Mauersberger et al. (1999) are located between 0.8 and 73 Mpc, much closer, and on average less luminous than our objects in the range 25 - 277 Mpc. Thus there is no evidence that depends on the distance of the galaxies over the range 0.8 - 277 Mpc, because of the different luminosity ranges represented by these two samples.
A search was conducted for relationships between and a number of parameters relating primarily to star formation. The existence of such correlations would be expected to shed light on the factors affecting star formation, or the effects of star formation on gas properties. These are considered below:
3.3.1 Projected Beamsize
Radio continuum maps (Condon et al., 1990), the H I (Thomas et al., 2002), and SCUBA 850m maps (Thomas et al., 2002) show that much of the emission in the SLUGS objects is extended with respect to the beamsize of 15′′, especially for the nearer objects. On average we detect about 45% of all the emission from these galaxies assuming the CO is distributed in a similar way to the 850 m and radio continuum emission. Therefore, the CO measurements may reflect the physical conditions in the center regions for the galaxies at lower . Maps of 12CO(3-2) line emission in 12 nearby galaxies by Dumke et al. (2001) have shown that the 12CO(3-2)/(1-0) line intensity ratio decreases outward from the centers of many galaxies. In principle, for a given beamsize, the average line ratios obtained from the single pixel measurement should therefore decrease with increasing distance, since more emission from lesser excited CO lines arising from the disk regions is detected by the telescope beam. Fig. 5 shows a plot of versus projected beam size. Similar to the relation between the ratio of and the linear size sampled (see Fig. 3), no correlation between these quantities is evident. The lack of such a correlation may be due to sample selection effect, however, since the more distant galaxies may have a larger fraction of highly excited CO molecular gas.
3.3.2 Dust and Gas
Large amounts of FIR emission are generated by the dust heated by young massive stars in starburst systems, in which case the FIR luminosity is a good measurement of the star formation rate () (Kennicutt, 1998a). Fig. 6 shows the 12CO line ratio versus dust temperature and FIR luminosity within a 15′′ beam. The dust temperatures are from Dunne et al. (2000) and the FIR luminosities are scaled to a 15′′ beam using sub-mm and radio maps as described in § 3.2. No significant correlation is evident in these plots. Other indicators are radio continuum luminosity and the optical color index (). Plots for these are not shown, but no obvious correlation was found with the parameter . In Fig. 7, we examine the dependence of on dust mass and molecular hydrogen mass (H2). The dust masses were obtained from Dunne et al. (2000) and scaled to a 15′′ beam as described earlier. The molecular gas masses for the SLUGS sample are derived from our CO luminosities by applying the conversion factor = 2.7 1019 cm-2 [K km s-1]-1 derived in § 4.3.1. The result is (H2) = 1.1 103 /(1+) M⊙ by scaling the result of Kenney & Young (1989), where is the luminosity distance of a galaxy in Mpc, and is the 12CO(1-0) flux measured within a 15′′ beam, = 2.1 Jy km s-1. The values of (H2) are also presented in Table 2. Again, no relationship is evident.
3.3.3 Surface Brightnesses and Color Indices
The average surface brightness for all wavebands is defined here as the ratio of the total flux to the square of the optical diameter. Thus it measures the surface brightness averaged over the optical diameter, and provides a measure of the concentration of star forming activity. Fig. 8 shows a plot of versus the surface brightness for mid-IR, far-IR, sub-mm, and H I emission. We find two possible correlations, one is between and FIR surface brightness, and another one is between the and SCUBA 850 m surface brightness. Fig. 9 shows the line ratio versus different color indices or ratios: and . No significant correlation is found between these ratios.
3.3.4 Star Formation Efficiency
The ratio /(H2) is often used as an indicator of the star formation efficiency () which gives the star formation rate per unit mass of molecular gas. In Table 2, we present the results of calculations for our SLUGS sample. Here the mass of molecular gas has been derived in the same manner as that in § 3.3.2. These values are an order of magnitude higher than what would be obtained if the conventional value of is used. Fig. 10 shows a significant correlation between and the within the telescope beam. The sample shown in Fig. 10 is divided into two ranges by gas mass centered at (H2) = 108 M⊙, and also by dust FIR luminosity centered at = 1010 L⊙ which are indicated by four different symbols in the plot. The linear correlation coefficient is obtained from the data with 200 L⊙/M⊙. The coefficient is 0.74 at a significance level of 1.4 10-7 (i.e. probability that and are unrelated). However, the correlation is diminished at 200 L⊙/M⊙, where the ratios spread between 0.5 and 1.72. The significance of the dependence of on will be discussed in § 4.2.
4 Discussion
4.1 The Relation Between CO and FIR Luminosities
As noted in § 3.2, the non-linear variation of CO with FIR luminosity implies a decrease in the ratio / with increasing (see Fig. 2). For 12CO(1-0) this ratio decreases by more than an order of magnitude over the range = 5 109 - 1012 L⊙. Part of this variation might be attributable to the effect of beamsize if the ratio is dependent on the fraction of the galaxy resolved by the beam. However, as noted in § 3.2, Fig. 3 shows that the beam effects do not seem to influence the / ratio, and that for any plausible gas excitation gradient (i.e. hotter gas confined in the center) such effects would show in the ratio as well, but Fig. 5 shows no evidence that more distant objects have smaller values of (see § 3.3.1). In addition, this effect would be expected to produce an increase rather than a decrease in / with increasing because of the strong sensitivity of to dust temperature. Therefore this ratio depends intrinsically on the total FIR luminosity. It should be noted that our results imply that for high galaxies where is exceedingly high, the corresponding values of will be seriously overestimated if a linear relation between and were assumed.
A possible cause of the variation in the / ratio is an increase in per unit mass of dust with increasing . To investigate this point further, we first plot in Fig. 11 versus to determine this relationship is linear. Linear fits to these relations in the log-log plane yield
| (4a) | |||||
| (4b) | |||||
We see indeed that the slopes are closer to unity than with log versus log (Equation (2a) and (2b)), though there is still a significant departures from a linear relation for . Secondly, we note that Fig. 2 shows a trend that the / ratio decreases with increasing dust temperature which is indicated by the two different FIR color ranges. This implies that the galaxies of the SLUGS sample which have higher luminosity is because they have a higher temperature in addition to simply more dust and gas, which would alone yield a linear relation between and . The correlation found between and dust temperature by Dunne et al. (2000) also support this argument. This effect is consistent with the systematically higher ’s deduced for such objects, with the warmer IRAS colors, and with the saturation of the ratio at high ’s (see Fig. 10).
As noted in § 3.3.2, is widely used as an indicator of the , and (H2) is often computed from the CO flux. Thus, the non-linear relation between and may reflect the behavior of star formation law for the nearby IR luminous galaxies. The star formation law can be represented as a power law that can be expressed in terms of the star formation rate per unit area and the gas density , i.e. = , first introduced by Schmidt (1959). Previous studies have shown that the activity of disk-averaged star formation is correlated with the mean total molecular gas content (Kennicutt, 1989; Boselli, 1994; Boselli et al., 1995), and this correlation is found to be stronger with H2 gas in starburst regions (Kennicutt, 1998b). Fig. 12 shows a possible correlation between the per unit area and the H2 gas density measured within a 15′′ beam for our SLUGS sample. Both and are corrected for the inclination of galaxies in the SLUGS sample. The correction for the galaxy inclination is necessary because the Schmidt Law involves and when viewed normal to the disk. The disperson in the fit is about a factor of 3. The slope based on a linear fit in the log-log plane yields 1.4 0.3. This value is consistent with the Schmidt law applied to the circumnuclear starbursts (Kennicutt, 1998b), though the uncertainty in the slope is too high to obtain a definitive value for the index. A possible reason for this is that our result refers to different regions in different galaxies, depending on the projected beamsize, whereas the work by Kennicutt and others consistently refer to disk-averaged parameters. The Schmidt Law involves H I+H2, but ignoring H I gas, which averages about 30% of the total gas mass measured within a 15′′ beam (see § 4.3.2), is most likely not the cause of the scatter seen in Fig. 12, since a study by Wong & Blitz (2002) with a high angular resolution shows no correlation between H I and star formation rate.
4.2 Correlation between and Star Formation Parameters
We examined in § 3.3 the excitation of CO and its relation with the properties of gas/dust and star formation in the central starburst regions in SLUGS sample. There are no significant correlations between and the distance of galaxies, star formation rate, dust temperature and mass, H2 gas mass, the color indices, and the luminosities of IR and radio continuum. The lack of correlation of with properties relating to total star formation reflects a range of localized conditions in the molecular clouds. The possible dependence of on FIR/sub-mm surface brightness (see Fig. 8) and (see Fig. 10) suggests that the higher degree of CO excitation is related to a higher concentration and efficiency of star forming activity. Such conditions would arise in an intense starburst where the surface density of such activity is high, consuming most of the gas in the region. The saturation effect of seen at higher which is probably due to thermalization of the CO levels, reflecting denser and warmer gas in regions of high star formation efficiency. This interpretation is consistent also with the non-linear relation between and (see Fig. 2), and with higher color temperatures associated with the most IR luminous and most efficient star forming galaxies. It is not clear whether these correlations reflect a high excitation ratio as the underlying cause or the effect of star forming activity.
The regime where 1.0 requires optically thin CO lines from extremely warm and/or dense gas. The relatively small number of galaxies with high values of might be associated with the highly excited gas from a short-lived gas phase in the starburst systems. The lower line ratios may be associated with gas that is cooler and less denser.
4.3 The Molecular Gas Content
The investigation of the gas and dust content depends critically on a reliable estimate of the controversial parameter . Studies have shown that this parameter varies from galaxy to galaxy (Booth & Aalto, 1998; Boselli et al., 2002), and it is thought to be higher in metal-poor galaxies and lower in starburst galaxies than in Galactic molecular clouds, where is about 2.8 1020 cm-2 [K km s-1]-1 (Bloemen et al., 1986; Strong et al., 1988). Thus in starburst galaxies, application of the standard factor can produce a significant overestimate of molecular hydrogen mass (Solomon et al., 1997; Downes & Solomon, 1998; Zhu et al., 2003).
4.3.1 The CO-to-H2 Conversion Factor from An LVG Method
In this section, we examine the molecular gas content and properties using large velocity gradient (LVG) models. The LVG method is capable in principle of yielding the column density of CO, and hence of H2, if an abundance ratio = [CO/H2] is assumed. Hence, this method should yield an estimate of the factor independent of other considerations such as gas-to-dust ratio, which is discussed in the next section. We assume that the ISM comprises molecular clouds characterized by a single set of average physical properties. It is well understood that models incorporating more data for starburst galaxies require at least two components - a prevailing optically thin warm diffuse component, and an optically thick cool dense component with a smaller filling factor (e.g. Aalto et al., 1995). However, comparisons between single and double component models yield approximately the same column density for H2, which is weighted strongly toward the prevailing diffuse component (e.g. Zhu et al., 2003).
The LVG approach can be formulated into an equation yielding the factor from the LVG parameters given by
| (5) |
where (H is the H2 gas density, is the radiation temperature for the 12CO(1-0) line transition, = , and is the velocity gradient associated with the individual clouds (see Appendix A). There are not enough data to uniquely determine the parameters in this equation, which usually require multiple line excitation ratios, measured brightness temperatures, and isotope intensity ratios to fully constrain the conditions in the molecular gas. In our case, it is therefore necessary to make some reasonable assumptions to constrain the LVG solutions.
The highest degree of uncertainty concerns the parameter which is unknown and needs to be addressed. Values widely quoted for starburst galaxies are in the range 10-5 - 10-4 (e.g. Booth & Aalto, 1998; Mao et al., 2000). Unfortunately, there are few if any reliable determinations for starburst galaxies. Within the Milky Way, measurements of and chemical models for dark and star forming clouds yield values within the range 5 10-5 - 2.7 10-4 (Blake et al., 1987; Farquhar et al., 1997; Hartquist et al., 1998; van Dishoeck, 1998; van Dishoeck & Blake, 1998). It seems unlikely therefore that 10-5 for starburst galaxies unless their metallicity is unusually low, which would occur only in low luminosity systems. For the SLUGS sample, therefore, we adopt = 10-4, bearing in mind the dependence of our computed values for on this parameter.
We adopt dust temperatures for each galaxy from Dunne et al. (2000), assuming to be representative of gas kinetic temperature . Fig. 13 shows a series of plots of versus for our subsample combined with theoretical curves based on LVG models. The theoretical curves represent versus for a variety of assumed densities (H2) based on a series of LVG models using = 10-4, and values of = 10-7, 10-6, 10-5, and 10-4 (km s-1 pc-1)-1. In each case it is assumed that = . Note the convergence of the curves at higher densities reflecting the saturation of the line ratios due to thermalization of the optically thick CO transitions. Note also that the ratios 1.0 can not be readily fit by the models with 10-6 (km s-1 pc-1)-1, a point to which we return later.
Thus for each galaxy in one of the data plots, it is possible to derive a molecular gas density and radiation temperature which is dependent upon . Using Equation (5), we then compute a range of parameter for the IR luminous galaxies. For each , only points that fall below the upper limits of due to saturation are used for computing the distribution of . For example, for = 10-5 (km s-1 pc-1)-1, thermalization occurs at = 0.86, corresponding to = 55 K, (H2) = 2.4 103 cm-3, and = 27 K. The resulting range of is 1 - 3 1019 cm-2 [K km s-1]-1. For points falling above the saturation curves ( 0.86) for = 10-5 (km s-1 pc-1)-1 (see Fig. 13), we obtain values in a range 2.4 1019 - 6.7 1019 cm-2 [K km s-1]-1 from the plots corresponding to = 10-6 and 10-7 (km s-1 pc-1)-1. However, the latter value of is virtually unacceptable, since it corresponds to an impossibly high velocity gradient or impossibly low CO abundance. Therefore, would have to be higher than the measured for those points to lie below the saturation curves for 10-6 (km s-1 pc-1)-1. Fig. 14 shows the resulting distribution of the derived and its average values for different . It is clear that regardless of , the values of derived from starburst galaxies are systematically lower than the value = 2.8 1020 cm-2 [K km s-1]-1 derived from the disk of the Galaxy.
In order to further constrain the range of the factor and shown in Fig. 14, we compare the CO isotope intensity ratios = [12CO(1-0)]/[13CO(1-0)] predicted by the LVG model with observed values. We adopted the isotope abundance ratio as = 40 - 75 (Wilson & Rood, 1994). The CO isotope intensity ratios data are taken from Aalto et al. (1995) and Taniguchi et al. (1999) for 34 IR luminous galaxies which have a range of FIR luminosities similar to the SLUGS sample, i.e. 1010 L. Fig. 15 shows a comparison between the distributions of computed and observed isotope ratios for the sample as a whole for each value of , and corresponding value for the mean derived factor. The plots show that the best agreement with the observed distribution of is obtained for = 10-5 (km s-1 pc-1)-1, corresponding to an average value for = 2.7 1019 cm-2 [K km s-1]-1. The other plots assuming other values of show marked disagreement with the observed isotope line ratios.
The resulting value for (2.7 1019 cm-2 [K km s-1]-1) in starburst regions is thus ten times smaller than the conventional value of for GMC’s in the Milky Way. But the result is comparable with = 0.5 1020 cm-2 [K km s-1]-1 estimated from diffuse clouds in the Galaxy by Polk et al. (1988), and with that found for extreme starbursts in nearby galaxies by Downes & Solomon (1998) and for starburst galaxy M 82 by Mao et al. (2000).
We repeated the LVG model calculations for a higher CO isotope abundance ratio of 75 (Wilson & Rood, 1994), and found that the average value of for = 10-4 becomes 8.2 1019 cm-2 [K km s-1]-1. We also repeated the entire analysis by increasing the adopted kinetic temperatures by 50%, and found that the resulting value of remains essentially the same, since for a given , the lower densities required are largely offset by lower values of the radiation temperature (see Equation (5)). Our LVG analysis also shows that the predicted isotope ratios 12CO(2-1)/13CO(2-1) are in satisfactory agreement with the observed ratios reported by Taniguchi et al. (1999). The results do not seem to support the conclusion by Taniguchi et al. (1999) that the comparison between CO(2-1) and CO(1-0) isotope intensity ratios may imply that the unusually large values in starburst systems indicate an isotope abundance anomaly in starburst galaxies. Our results are consistent with effects of excitation and optical depth.
4.3.2 The (H2)/(H I) Ratio
In this section, we briefly consider a small subset of our sample with H I maps available to assess the combined molecular and atomic gas content within the telescope beam. The subset comprises twelve galaxies with an average = 4.1 1010 L⊙ (Thomas et al., 2002). The H I masses for our 15′′ beam were estimated from the peak H I column densities maps at 25′′ resolution by assuming a uniform H I brightness distribution within the 25′′ beam. The mean ( r.m.s.) projected beamsize for the subset is 3.6 ( 1.1) kpc.
The overall mean ( r.m.s.) values for (H2)/(H I) ratio and combined H2+H I face-on surface density are respectively 2.0 1.5 and 42 18 M⊙ pc-2. These quantities must be considered respectively as upper and lower limits however, since the H I masses may be underestimated due to the effects of absorption by H I against the radio continuum in the nuclear regions (Thomas et al., 2002). This is particularly the case for one galaxy, NGC 5900, for which (H2)/(H I) = 21, and this object was omitted from the mean value quoted above. The mean ratio (H2)/(H I) is substantially larger than that found for optically selected late type galaxies (0.15) by Boselli et al (2002). This is partly attributable to the fact that their values are global measures, whereas our values refer to the nuclear regions of galaxies selected according to high star formation rates. The H2+H I surface density is intermediate between the central surface densities for galaxies with lower star forming rates like the Milky Way, which is about 10 M⊙ pc-2 (Elmegreen, 1989) and those for ultra-luminous IR galaxies, which are up to 105 M ⊙ pc-2 (Aalto et al., 1995).
It should be emphasized that these estimates refer to comparatively warm gas heated by star formation in these systems. The outer disks of galaxies may be hiding substantial amounts of cool H2, where the radiative efficiency of CO is low (i.e. is high). The (H2)/ ratio will be discussed in a separate paper (in preparation), where the dust mass of the SLUGS sample (Dunne et al., 2000) will be corrected for the effects of contamination of the SUCBA 850 m filter.
4.3.3 Virial Stability of The Molecular Clouds
Using the virial theorem, the velocity gradient under the virial condition for a spherical cloud with a mean gas density is given by,
| (6) |
where is in the range 0.5 - 2.5 (Papadopoulos, 1998; Bryant & Scoville, 1996) depending primarily on the assumed density profile. For a mean gas density of 1.4 103 cm-3 for 0.8 derived from the LVG model for our IR luminous galaxies (see Fig. 13) with = 10-5 (km s-1 pc-1)-1 and = 10-4, we estimate a virial velocity gradient of 1.1 km s-1 pc-1 for = 2.5. This virial value is about 9 - 90 times smaller than the velocity gradient of 10 - 100 km s-1 pc-1 also derived from LVG modeling using = 10-5 - 10-6 (km s-1 pc-1)-1 and = 10-4. The same calculation was made for a lower using the source UGC 6436 with = 0.35, and a corresponding gas density of 7.5 102 cm-3. It was found that is still about 11 times smaller than the LVG velocity gradient. Since such low values of are more sensitive to density than more saturated values near unity, this result provides a strong confirmation of the non-virial expansion velocities. As noted earlier, there are a number of galaxies with high 12CO line ratios ( 0.8 - 1.72) seen in Fig. 13, where may be lower than 10-5 (km s-1 pc-1)-1. The above estimates imply that the molecular clouds in the starburst regions are not gravitationally bound, confirming the suggestion recently made by Zhu et al. (2003, ApJ in press) for the Antennae galaxies, unless one is willing to accept a significantly lower value for . The cause could be the destruction by the stellar winds and expanding shells of new-born massive stars. We note that the non-virialized component emanates from the gas phase that dominates the 12CO emission, and not necessarily from the entire cloud mass, in accordance with two-phase gas models (Aalto et al., 1995; Papadopoulos & Seaquist, 1999).
5 Conclusions
The main conclusions of this work are:
1. The / ratios measured from the SLUGS sample decrease with increasing FIR luminosity. The non-linearity between / and implies that the more IR luminous galaxies have higher dust temperatures than those at the low luminosity end. This non-linear relation was found to be consistent with that expect for the Schmidt Law for star formation with an index = 1.4 0.3, though the index is too uncertain to provide a new and definitive Schmidt relation.
2. The degree of CO excitation measured by the 12CO(3-2)/(1-0) line intensity ratios vary greatly from galaxy to galaxy in the SLUGS sample. There is a trend for the ratios to increase with increasing concentration and efficiency of star forming activity. The saturation of seen at higher implies that the gas is denser and warmer in regions of high which is consistent with the non-linearity between / and .
3. Our 12CO line measurements together with dust and CO isotope data taken from the literature are modeled using the LVG method to estimate that the CO-to-H2 conversion factor lies between 2.7 1019 and 6.6 1019 cm-2[K km s-1]-1 for SLUGS galaxies, which is about 4 - 10 times lower than the conventional derived from the Galaxy.
4. For a subset of 12 galaxies with available H I maps, the total gas face-on surface density within about 2 kpc of the center averages about 42 M⊙ pc-2, which is intermediate between that for disk galaxies with low and high star formation rates.
5. Our Virial analysis shows that the molecular clouds in starburst regions are not gravitationally bound unless one is willing to accept a 9 - 90 times lower [CO/H2] abundance ratio. Most of the 12CO line emission originates from the non-virialized warm and diffuse gas clouds.
Appendix A Derivation of The CO-to-H2 Conversion Factor From LVG Model
From the LVG model for a spherical molecular cloud, the column density per unit velocity range in the average cloud is given by
| (A1) |
where (H2) is the density of H2, = , is the CO abundance ratio [CO/H2], and is the velocity gradient within the cloud. The total CO column density per cloud , integrated over velocity is then
| (A2) |
where is the velocity width of an individual cloud.
The column density averaged over the beam area can be written as
| (A3) |
or,
| (A4) |
where is the number of clouds in the beam, is the cloud cross section area, is the beam area, and is the line width of all emission detected in the beam.
The quantity inside inside the brackets of Equation (A4) is the brightness dilution factor representing the product of the geometric and velocity filling factors within the beam.
Assuming for simplicity, a rectangular line profile, then
| (A5) |
where the radiation temperature is calculated from LVG modeling for 12CO(1-0) or (3-2) line emission, and is the corresponding main-beam temperature.
The quantity can be replaced by , the line flux in units of brightness. Thus
| (A6) |
Setting = , where is the corresponding column density of H2, and = , where
| (A7) |
for 12CO (1-0) line emission. We obtain
| (A8) |
References
- Aalto et al. (1995) Aalto, S., Booth, R. S., Black, J. H., & Johansson, L. E. B. 1995, A&A, 300, 369
- Blake et al. (1987) Blake, G. A., Sutton, E. C., Masson, C. R., & Phillips, T. G. 1987, ApJ, 315, 621
- Bloemen et al. (1986) Bloemen, J. B. G. M., et al. 1986, A&A, 154, 25
- Booth & Aalto (1998) Booth, R. S. & Aalto, S. 1998, in The Molecular Astrophysics of Stars and Galaxies, T. W. Hartquist & D. A. Williams (eds.), Oxford Science Publications, 437
- Boselli (1994) Boselli, A. 1994, A&A, 292, 1
- Boselli et al. (1995) Boselli, Gavazzi, G., A., Lequeux, J., Buat, V., Casoli, F., Dickey, Z., & Donas, J. 1995, A&A, 300, L13
- Boselli et al. (2002) Boselli, A., Lequeux, J., & Gavazzi, G. 2002, A&A, 384, 33
- Braine & Combes (1992) Braine, M. & Combes, F. 1992, A&A, 264, 433
- Braine et al. (1993) Braine, M., et al. 1993, A&AS, 97, 887
- Bryant & Scoville (1996) Bryant, P. M. & Scoville, N. Z. 1996, ApJ, 457, 678
- Chini et al. (1996) Chini, R., Krügel, E., & Lemke, R. 1996, A&AS, 118, 47
- Condon et al. (1990) Condon, J. J., Helou, G., Sanders, D. B., & Soifer, B. T. 1990, ApJS, 73, 359
- Devereux et al. (1994) Devereux, N., Taniguchi, Y., Sanders, D. B., Nakai, N., & Young, J. S. 1994, AJ, 107, 2006
- Downes & Solomon (1998) Downes, D. & Solomon, P. M. 1998, ApJ, 507, 615
- Dumke et al. (2001) Dumke, M., Nieten, Ch., Thuma, G., Wielebinski, R., & Walsh, W. 2001, A&A, 373, 853
- Dunne et al. (2000) Dunne, L., Eales, S., et al. 2000, MNRAS, 315, 115D
- Eales & Edmunds (1996) Eales, S. A. & Edmunds, M. G. 1996, MNRAS, 280, 1167
- Eales & Edmunds (1997) Eales, S. A. & Edmunds, M. G. 1997, MNRAS, 286, 732
- Elmegreen (1989) Elmegreen, B. G. 1989 ApJ, 338, 178
- Farquhar et al. (1997) Farquhar, P. R. A., Millar, T. J., & Herbst, E. 1997, MNRAS, 269, 641
- Goldreich & Kwan (1974) Goldreich, P. & Kwan, J. 1974, ApJ, 189, 441
- Hartquist et al. (1998) Hartquist, T. W., Caselli, P., Rawlings, J. M. C., Ruffle, D. P., & Williams, D. A. 1998, in The Molecular Astrophysics of Stars and Galaxies, T. W. Hartquist & D. A. Williams (eds.), Oxford Science Publications, 101
- Ho (1987) Ho, P. T. P., Turner, J. L., & Martin, R. N. 1987, ApJ, 322, L67
- Jansen (1995) Jansen, D. 1995, PhD Thesis, Leiden Observatory, Netherlands
- Kennicutt (1989) Kennicutt, R. C., Jr. 1989, ApJ, 344, 685
- Kennicutt (1998a) Kennicutt, R. C., Jr. 1998, ARA&A, 36, 189
- Kennicutt (1998b) Kennicutt, R. C., Jr. 1998, ApJ, 498, 541
- Kenney & Young (1989) Kenney, J. D. P. & Young, J. S. 1989, ApJ, 344, 171
- Mao et al. (2000) Mao, R. Q., et al. 2000, A&A, 358, 433
- Mauersberger et al. (1999) Mauersberger, B., Henkel, C., Walsh, W., & Schulz, A. 1999, A&A, 341, 256
- Papadopoulos (1998) Papadopoulos, P. P. 1998, PhD Thesis, University of Toronto, Canada
- Papadopoulos & Seaquist (1999) Papadopoulos, P. P. & Seaquist, E. R. 1999 ApJ, 514, 95
- Papadopoulos & Allen (2000) Papadopoulos, P. P. & Allen, M. L. 2000 ApJ, 537, 631
- Polk et al. (1988) Polk, K. S., Knapp, G. R., Stark, A. A., & Soifer, B. T. 1991, ApJ, 370, 158
- Sanders et al. (1991) Sanders, D. B., Scoville, N. Z., & Wilson, R. W. 1988, ApJ, 332, 432
- Sanders et al. (1993) Sanders, D. B. et al. 1993, in Back to the Galaxy, edited by F. Verter (Kluwer, Dordrecht), 311
- Schmidt (1959) Schmidt, M., 1959, ApJ, 129, 243
- Soifer et al. (1987) Soifer, B. T., et al. 1987, ApJ, 320, 238
- Solomon et al. (1997) Solomon, P. M., Downes, D., Radford, S. J. E., & Barrett, J. W. 1997, ApJ, 478, 144
- Strong et al. (1988) Strong, A. W., et al. 1988, A&A, 207, 1
- Taniguchi et al. (1999) Taniguchi, Y., Ohyama, Y., & Sanders, D. B. 1999, ApJ, 522, 214
- Thomas et al. (2002) Thomas, H. C., Dunne, L., et al. 2002, MNRAS, 329, 747T
- van Dishoeck (1998) van Dishoeck, E. F. 1998, ARA&A, 36, 53
- van Dishoeck & Blake (1998) van Dishoeck, E. F. & Blake, G. A. 1998, ARA&A, 36, 317
- Wielebinski et al. (1999) Wielebinski, R., Dumke, M., & Nieten, Ch. 1999, A&A, 347, 634
- Wilson & Rood (1994) Wilson, T. L., & Rood, R. T. 1994, ARA&A, 32, 191
- Wong & Blitz (2002) Wong, T. & Blitz, L. 2002, ApJ, 569, 157
- Young et al. (1995) Young, J. S., et al. 1995, ApJS, 98, 219
- Zhu et al. (2003) Zhu, M., Seaquist, E. R., & Kuno, N. 2003, ApJ, in press


| SourceaaGalaxy name, the letter p denotes those galaxies that belong to a pair. | RA2000bbRight ascension J2000 epoch from NED | Dec2000ccDeclination J2000 epoch from NED. | ddRecession velocity from NED. | eeGalaxy proper distance to the object at the present time. | ffThe 12CO(1-0) line intensity = in K km s-1. Upper limits refer to 3 times the standard error due to the noise. | ggStandard error of . | hhThe 12CO(3-2) line intensity = in K km s-1. Upper limits refer to 3 times the standard error due to the noise. | iiStandard error of . | jjThe line intensity ratio . | -kkThe negative uncertainty in . | +llThe positive uncertainty in . |
|---|---|---|---|---|---|---|---|---|---|---|---|
| h m s | ∘ ′ ′′ | (km s-1) | (Mpc) | (K km s-1) | (K km s-1) | ||||||
| UGC 5376 | 10 00 27.1 | +03 22 28 | 2050 | 27.2 | 13.0 | 3.3 | 15.8 | 3.3 | 1.21 | -0.45 | 0.33 |
| NGC 3094 | 10 01 26.0 | +15 46 14 | 2404 | 31.9 | 48.5 | 10.1 | 37.5 | 7.7 | 0.77 | -0.25 | 0.20 |
| NGC 3110 | 10 04 01.9 | -06 28 29 | 5034 | 66.3 | 50.6 | 10.7 | 39.6 | 8.2 | 0.78 | -0.26 | 0.21 |
| IR 1017+08 | 10 19 59.9 | +08 13 34 | 14390 | 185.2 | 16.1 | 4.6 | 7.4 | 3.2 | 0.46 | -0.28 | 0.22 |
| NGC 3221 | 10 22 20.0 | +21 34 10 | 4110 | 54.2 | 33.5 | 7.1 | 16.9 | 3.5 | 0.51 | -0.17 | 0.13 |
| NGC 3367 | 10 46 34.8 | +13 45 02 | 3037 | 40.2 | 38.0 | 7.9 | 12.0 | 2.5 | 0.32 | -0.11 | 0.08 |
| IR 1056+24 | 10 59 18.1 | +24 32 34 | 12921 | 166.9 | 38.1 | 8.0 | 24.3 | 5.3 | 0.64 | -0.22 | 0.17 |
| ARP 148 | 11 03 53.9 | +40 51 00 | 10350 | 134.5 | 8.8 | 2.9 | 5.5 | 1.4 | 0.62 | -0.29 | 0.21 |
| NGC 3583 | 11 14 10.8 | +48 19 03 | 2136 | 28.3 | 44.0 | 9.4 | 18.7 | 4.0 | 0.43 | -0.14 | 0.11 |
| MCG +00-29 | 11 21 10.9 | -02 59 13 | 7646 | 100.0 | 27.5 | 5.8 | |||||
| UGC 6436 | 11 25 45.0 | +14 40 36 | 10243 | 133.2 | 53.3 | 11.1 | 18.4 | 3.8 | 0.35 | -0.11 | 0.09 |
| NGC 3994p | 11 57 36.8 | +32 16 39 | 3118 | 41.3 | 21.2 | 6.3 | 14.9 | 3.6 | 0.70 | -0.31 | 0.23 |
| NGC 3995p | 11 57 44.1 | +32 17 40 | 3254 | 43.0 | 23.2 | 5.1 | 6.3 | 1.8 | 0.27 | -0.11 | 0.09 |
| NGC 4045 | 12 02 42.3 | +01 58 38 | 1981 | 26.3 | 57.3 | 11.7 | 14.8 | 3.1 | 0.26 | -0.08 | 0.07 |
| IR 1211+03 | 12 13 46.1 | +02 48 40 | 21885 | 276.7 | 11.0 | 3.0 | |||||
| NGC 4273 | 12 19 56.0 | +05 20 34 | 2378 | 31.5 | 32.9 | 6.9 | 21.5 | 4.5 | 0.65 | -0.22 | 0.17 |
| IR 1222-06 | 12 25 03.9 | -06 40 53 | 7902 | 103.3 | 9.1 | 3.6 | 11.2 | 2.5 | 1.23 | -0.63 | 0.44 |
| NGC 4418 | 12 26 54.7 | -00 52 39 | 2179 | 28.9 | 54.8 | 11.5 | 47.4 | 9.7 | 0.86 | -0.28 | 0.22 |
| NGC 4433 | 12 27 38.6 | -08 16 45 | 3000 | 39.7 | 108.9 | 22.7 | 40.8 | 8.4 | 0.37 | -0.12 | 0.10 |
| NGC 4793 | 12 54 40.7 | +28 56 19 | 2484 | 32.9 | 71.5 | 14.5 | 26.2 | 5.3 | 0.37 | -0.12 | 0.09 |
| NGC 4922 | 13 01 24.8 | +29 18 36 | 7071 | 92.6 | 12.3 | 5.1 | 2.04 | ||||
| NGC 5020 | 13 12 39.9 | +12 35 59 | 3362 | 44.5 | 39.2 | 8.0 | 20.2 | 4.3 | 0.52 | -0.23 | 0.18 |
| IC 860 | 13 15 03.5 | +24 37 08 | 3347 | 44.3 | 5.07 | 2.67 | |||||
| UGC 8387 | 13 20 35.3 | +34 08 22 | 7000 | 91.7 | 90.6 | 18.4 | 63.3 | 12.9 | 0.70 | -0.21 | 0.16 |
| NGC 5104 | 13 21 23.1 | +00 20 32 | 5578 | 73.4 | 62.6 | 12.7 | 33.6 | 6.8 | 0.54 | -0.15 | 0.12 |
| NGC 5256 | 13 38 17.5 | +12 35 58 | 8353 | 109.1 | 12.3 | 2.9 | |||||
| NGC 5257p | 13 39 53.0 | +00 50 22 | 6757 | 88.6 | 33.1 | 7.1 | 20.7 | 4.3 | 0.63 | -0.35 | 0.28 |
| NGC 5258p | 13 39 57.9 | +00 49 58 | 6798 | 89.1 | 37.7 | 8.4 | 16.1 | 3.5 | 0.43 | -0.12 | 0.09 |
| UGC 8739 | 13 49 14.2 | +35 15 23 | 5032 | 66.3 | 44.2 | 9.0 | 48.3 | 9.9 | 1.09 | -0.05 | 0.05 |
| NGC 5371 | 13 55 39.0 | +40 27 31 | 2553 | 33.8 | 15.5 | 3.3 | |||||
| NGC 5394p | 13 58 33.6 | +37 27 13 | 3472 | 45.9 | 101.5 | 21.1 | 36.0 | 7.3 | 0.35 | -0.63 | 0.44 |
| NGC 5395p | 13 58 37.6 | +37 25 32 | 3491 | 46.1 | 30.4 | 6.6 | |||||
| NGC 5433 | 14 02 36.0 | +32 30 38 | 4354 | 57.4 | 24.1 | 7.2 | 40.6 | 8.6 | 1.69 | -0.27 | 0.20 |
| NGC 5426p | 14 03 25.1 | -06 04 09 | 2621 | 34.7 | 18.2 | 4.8 | 5.0 | 1.7 | 0.27 | -0.31 | 0.24 |
| NGC 5427p | 14 03 25.6 | -06 01 42 | 2678 | 35.5 | 12.1 | 3.1 | 7.7 | 2.0 | 0.64 | -0.26 | 0.19 |
| ZW 247.020 | 14 19 43.2 | +49 14 12 | 7666 | 100.3 | 28.5 | 6.2 | 25.9 | 5.5 | 0.91 | -0.20 | 0.16 |
| NGC 5600 | 14 23 49.4 | +14 38 21 | 2319 | 30.7 | 11.0 | 3.0 | 7.2 | 1.5 | 0.65 | -0.07 | 0.06 |
| NGC 5653 | 14 30 10.4 | +31 12 54 | 3562 | 47.1 | 61.1 | 12.6 | 38.4 | 7.7 | 0.63 | -0.61 | 0.45 |
| NGC 5665 | 14 32 25.8 | +08 04 45 | 2228 | 29.5 | 78.0 | 16.6 | 16.8 | 3.5 | 0.22 | -0.30 | 0.23 |
| NGC 5676 | 14 32 46.7 | +49 27 29 | 2114 | 28.0 | 14.7 | 3.2 | |||||
| NGC 5713 | 14 40 11.3 | -00 17 27 | 1900 | 25.2 | 16.4 | 4.1 | 27.2 | 5.5 | 1.65 | -0.29 | 0.22 |
| UGC 9618p | 14 57 00.5 | +24 36 42 | 9900 | 128.8 | 5.2 | 1.7 | |||||
| NGC 5792 | 14 58 22.8 | -01 05 27 | 1924 | 25.5 | 35.0 | 7.4 | 31.6 | 6.5 | 0.90 | -0.15 | 0.11 |
| ZW 049.057 | 15 13 13.1 | +07 13 27 | 3897 | 51.5 | 27.4 | 6.0 | 22.8 | 4.9 | 0.83 | -0.57 | 0.42 |
| NGC 5900 | 15 15 05.0 | +42 12 32 | 2511 | 33.3 | 74.8 | 15.4 | 33.6 | 6.9 | 0.45 | -0.22 | 0.16 |
| 1 ZW 107 | 15 18 06.1 | +42 44 45 | 12039 | 155.8 | 14.6 | 3.3 | |||||
| NGC 5929p | 15 26 06.1 | +41 40 14 | 2492 | 33.0 | 5.9 | 3.4 | 5.1 | 1.2 | 0.87 | -0.22 | 0.17 |
| NGC 5930p | 15 26 07.9 | +41 40 34 | 2672 | 35.4 | 21.5 | 5.7 | 11.7 | 2.6 | 0.54 | -0.60 | 0.46 |
| IR 1525+36 | 15 26 59.4 | +35 58 37 | 16602 | 212.6 | 10.3 | 3.3 | |||||
| NGC 5936 | 15 30 00.8 | +12 59 21 | 4004 | 52.9 | 56.4 | 11.8 | 37.8 | 7.6 | 0.67 | -0.28 | 0.22 |
| NGC 5937 | 15 30 46.2 | -02 49 45 | 2807 | 37.2 | 18.8 | 4.3 | 32.2 | 6.5 | 1.72 | -0.13 | 0.10 |
| NGC 5953p | 15 34 32.3 | +15 11 38 | 1965 | 26.1 | 45.7 | 9.8 | 38.7 | 7.9 | 0.85 | -0.19 | 0.15 |
| NGC 5954p | 15 34 35.0 | +15 12 00 | 1959 | 26.0 | 38.6 | 8.3 | 14.4 | 3.2 | 0.37 | -0.10 | 0.08 |
| ARP 220 | 15 34 57.1 | +23 30 11 | 5434 | 71.5 | 126.3 | 26.2 | 74.2 | 14.9 | 0.59 | -0.11 | 0.09 |
| IR 1533-05 | 15 36 11.7 | -05 23 52 | 8186 | 107.0 | 8.9 | 2.2 | |||||
| NGC 5962 | 15 36 31.7 | +16 36 29 | 1958 | 26.0 | 86.2 | 17.6 | 26.9 | 5.5 | 0.31 | -0.22 | 0.16 |
| NGC 5990 | 15 46 16.5 | +02 24 56 | 3839 | 50.7 | 86.7 | 20.0 | 28.1 | 5.9 | 0.32 | -0.38 | 0.29 |
| NGC 6052 | 16 05 12.9 | +20 32 32 | 4716 | 62.1 | 30.6 | 8.0 | 17.8 | 3.7 | 0.58 | -0.12 | 0.09 |
| MCG +01-42 | 16 30 56.5 | +04 04 59 | 7342 | 96.1 | 26.4 | 6.3 | 27.6 | 5.7 | 1.05 | -0.37 | 0.28 |
| NGC 6181 | 16 32 21.0 | +19 49 36 | 2375 | 31.5 | 60.0 | 12.8 | 21.3 | 4.4 | 0.36 | -0.12 | 0.09 |
| SourceaaGalaxy name, the letter p denotes those galaxies that belong to a pair. | P.B.bbThe projected beamsize (P.B.) at the source. | log10ccThe 12CO(1-0) luminosity measured within a 15′′ beam, = 1 beam area. | log10ddThe 12CO(3-2) luminosity measured within a 15′′ beam, = 1 beam area. | log10(H2)eeMolecular hydrogen gas mass measured within a 15′′ beam. | ffStar formation efficiency measured within a 15′′ beam. |
|---|---|---|---|---|---|
| (kpc) | (K km s-1 Mpc2 ) | (K km s-1 Mpc2 ) | (M⊙) | (L⊙/M⊙) | |
| UGC 5376 | 1.99 | 3.98 | 4.06 | 7.34 | 177 |
| NGC 3094 | 2.34 | 4.69 | 4.58 | 8.05 | 102 |
| NGC 3110 | 4.90 | 5.34 | 5.23 | 8.71 | 98 |
| IR 1017+08 | 14.12 | 5.72 | 5.39 | 9.12 | 96 |
| NGC 3221 | 4.00 | 4.99 | 4.69 | 8.36 | 43 |
| NGC 3367 | 2.95 | 4.78 | 4.28 | 8.15 | 32 |
| IR 1056+24 | 12.66 | 6.01 | 5.81 | 9.40 | 197 |
| ARP 148 | 10.12 | 5.19 | 4.98 | 8.57 | 302 |
| NGC 3583 | 2.07 | 4.54 | 4.17 | 7.91 | 68 |
| MCG +00-29 | 7.46 | 5.43 | |||
| UGC 6436 | 10.02 | 5.96 | 5.50 | 9.35 | 94 |
| NGC 3994p | 3.03 | 4.55 | 4.40 | 7.92 | 61 |
| NGC 3995p | 3.16 | 4.63 | 4.07 | 7.99 | 59 |
| NGC 4045 | 1.92 | 4.59 | 4.01 | 7.96 | 82 |
| IR 1211+03 | 21.59 | 5.89 | |||
| NGC 4273 | 2.31 | 4.51 | 4.33 | 7.87 | 84 |
| IR 1222-06 | 7.71 | 4.98 | 5.07 | 8.36 | 142 |
| NGC 4418 | 2.12 | 4.66 | 4.59 | 8.02 | 461 |
| NGC 4433 | 2.92 | 5.23 | 4.80 | 8.60 | 46 |
| NGC 4793 | 2.41 | 4.89 | 4.45 | 8.25 | 28 |
| NGC 4922 | 6.90 | 5.01 | 8.39 | 40 | |
| NGC 5020 | 3.27 | 4.88 | 4.60 | 8.25 | 68 |
| IC 860 | 3.25 | ||||
| UGC 8387 | 6.83 | 5.87 | 5.72 | 9.25 | 130 |
| NGC 5104 | 5.43 | 5.52 | 5.25 | 8.89 | 96 |
| NGC 5256 | 8.15 | 5.16 | |||
| NGC 5257p | 6.59 | 5.41 | 5.20 | 8.78 | 27 |
| NGC 5258p | 6.63 | 5.47 | 5.10 | 8.84 | 24 |
| UGC 8739 | 4.90 | 5.28 | 5.32 | 8.65 | 73 |
| NGC 5371 | 2.48 | 4.25 | |||
| NGC 5394p | 3.38 | 5.32 | 4.87 | 8.69 | 15 |
| NGC 5395p | 3.39 | 4.81 | 8.17 | 8 | |
| NGC 5433 | 4.24 | 4.89 | 5.12 | 8.26 | 160 |
| NGC 5426p | 2.55 | 4.34 | 3.77 | 7.70 | 14 |
| NGC 5427p | 2.60 | 4.18 | 3.98 | ||
| ZW 247.020 | 7.48 | 5.45 | 5.40 | 8.82 | 169 |
| NGC 5600 | 2.25 | 4.01 | 3.83 | 7.37 | 121 |
| NGC 5653 | 3.46 | 5.13 | 4.92 | 8.49 | 68 |
| NGC 5665 | 2.16 | 4.83 | 4.16 | 8.19 | 11 |
| NGC 5676 | 2.05 | 4.06 | |||
| NGC 5713 | 1.85 | 4.02 | 4.24 | 7.38 | 282 |
| UGC 9618p | 9.68 | 4.92 | |||
| NGC 5792 | 1.87 | 4.36 | 4.31 | 7.72 | 127 |
| ZW 049.057 | 3.79 | 4.85 | 4.77 | 8.22 | 517 |
| NGC 5900 | 2.44 | 4.91 | 4.57 | 8.28 | 53 |
| 1 ZW 107 | 11.79 | 5.53 | |||
| NGC 5929p | 2.42 | 3.80 | 3.74 | ||
| NGC 5930p | 2.60 | 4.43 | 4.16 | 7.79 | 99 |
| IR 1525+36 | 16.31 | 5.64 | |||
| NGC 5936 | 3.90 | 5.19 | 5.02 | 8.56 | 82 |
| NGC 5937 | 2.73 | 4.41 | 4.64 | 7.77 | 469 |
| NGC 5953p | 1.91 | 4.49 | 4.42 | 7.85 | 58 |
| NGC 5954p | 1.90 | 4.41 | 3.99 | 7.78 | 61 |
| ARP 220 | 5.29 | 5.80 | 5.57 | 9.17 | 467 |
| IR 1533-05 | 7.99 | 5.00 | |||
| NGC 5962 | 1.90 | 4.76 | 4.26 | 8.12 | 13 |
| NGC 5990 | 3.73 | 5.34 | 4.85 | 8.71 | 58 |
| NGC 6052 | 4.59 | 5.07 | 4.83 | 8.44 | 102 |
| MCG +01-42 | 7.16 | 5.38 | 5.40 | 8.75 | 247 |
| NGC 6181 | 2.31 | 4.77 | 4.32 | 8.13 | 26 |