A deep Chandra observation of the cluster environment of the radio galaxy 3C294
Abstract
We report the results from a 200 ks Chandra observation of the radio galaxy 3C294 and its cluster environment, increasing by tenfold our earlier observation. The diffuse emission, extending about 100 kpc around the nucleus, has a roughly hourglass shape in the N-S direction with surprisingly sharp edges to the N and S. The spectrum of the diffuse emission is well fitted by either a thermal model of temperature 3.5 keV and abundance (), or a power-law with photon index 2.3. If the emission is due to hot gas then the sharp edges mean that it is probably not in hydrostatic equilibrium. Much of the emission is plausibly due to inverse Compton scattering of the Cosmic Microwave Background (CMB) by nonthermal electrons produced earlier by the radio source. The required relativistic electrons would be of much lower energy and older than those responsible for the present radio lobes. This could account for the lack of detailed spatial correspondence between the X-rays and the radio emission, the axis of which is at a position angle of about . Hot gas would still be required to confine the relativistic plasma; the situation could parallel that of the radio bubbles seen as holes in nearby clusters, except that in 3C294 the bubbles are bright in X-rays owing to the extreme power in the source and the sixty fold increase in the energy density of the CMB. The X-ray spectrum of the radio nucleus is hard, showing a reflection spectrum and iron line. The source is therefore an obscured radio-loud quasar.
keywords:
X-rays: galaxies – galaxies: active: clusters: individual (3C294) – intergalactic medium1 Introduction
3C294 is a powerful Fanaroff-Riley II radio source (FR II) at a redshift of 1.786. A high resolution image of the radio emission shows it to have a Z-shaped morphology, which may be explained by a precessing or torqued jet (McCarthy et al. 1990). Extended Lyman emission was found to be associated with the source, with a luminosity of (McCarthy et al. 1990). The source was later observed by Stockton et al. (1999) in the K′ band using an adaptive optics system on the Canada-France-Hawaii Telescope, resolving it into a number of knots arranged over an approximately triangular region. They interpreted this pattern as a set of dusty dwarf galaxy-like clumps illuminated in a cone by an obscured nucleus. Quirrenbach et al. (2001) observed the system at higher resolution with an adaptive optics system on the Keck telescope in K′ and H bands, finding emission from two components with a separation of arcsec. One component was identified as the active nucleus, the other as the core of a colliding galaxy.
X-ray emission was detected from the position of 3C294 by Crawford & Fabian (1996), using ROSAT proportional counter data. The data quality was insufficient to conclude whether the emission was spatially extended or thermal in origin. Their favoured model was for X-ray emission from a rich cluster of galaxies. Hardcastle & Worrall (1999) later examined a long ROSAT observation taken with its High Resolution Imager (HRI), concluding that the source was possibly spatially extended.
We first observed 3C294 with Chandra in 2000, for a total of 20 ks with the ACIS-S detector (Fabian et al. 2001). The X-ray emission was spatially extended about the central core X-ray source in a distinctive hourglass shape. The hourglass was aligned in the north-south (N-S) direction and extended to radii of at least 100 kpc. A spectrum of the diffuse emission was fitted using a thermal model, giving a best-fitting temperature of 5 keV. The emission could have been due to inverse Compton scattering, but since there was little excess emission associated with the radio jet of the source, except on the southern hotspot, this emission mechanism was considered unlikely. The most likely explanation for the observed diffuse emission was a thermal one, generated by the intracluster medium (ICM) of the inner parts of a cluster. The existence of such a hot cluster at this redshift is consistent with a low-density universe.
Here we present the results of a ten times deeper Chandra exposure of 3C294, for almost 200 ks. Luminosities and distances were calculated in this paper by assuming , and . Relative abundances were calculated assuming the results of Anders & Grevesse (1989).
2 Data analysis
The observation was split into two sections: one period beginning on 2002 Feb 25 with an exposure of 69.8 ks, and the second on 2002 Feb 27 with an exposure of 122.0 ks. Visual inspection of the lightcurves for the two observations in the band 0.3 to 5 keV showed no evidence for contamination by flares, therefore the total effective length of observations was 191.8 ks.
Both of the data sets were taken using the ACIS-S3 detector in VFAINT mode. This mode of observation grades events using a matrix of detector pixels around the centroid of each event, rather than the standard matrix for the FAINT observation mode, and yields a dataset with a substantially lower background.
In order to take advantage of the VFAINT observation mode, the data were reprocessed using the CAIO acis_process_events tool with the check_vf_pha option switched on. The gain file applied to the reprocessed dataset was acisD2000-08-12gainN0003.fits from CALDB version 2.12.
Since the two data sets were taken over only a few days, the roll angles of the spacecraft were within a couple of degrees of each other. Therefore we merged the two events files together into a single file, reprojecting the position of the events (in sky aligned detector coordinates) of the first data set to match that of the second. To test whether this step was valid we generated spatially-weighted response and ancillary matrices for the diffuse emission for the two data sets individually and compared the differences in fitting the spectra using the two responses on both data sets. There was no significant difference in either the quality of the fits or their best-fitting parameters.
The weighted responses for each region were created from the appropriate FEF calibration file (acisD2000-01-29fef_piN0002) and the CIAO mkwarf and mkrmf tools, weighting the response using the number of counts in the 0.3 to 7.5 keV band.
Creating a suitable background spectrum is an important part of the analysis of low surface brightness objects such as the diffuse emission here. Given that the emission is small in extent and the observation is long, it is preferable to use a background spectrum generated from the observation itself rather than different observations. A blank-sky background dataset would have a different instrument response and galactic absorption to our observation. We therefore used blank regions of the S3 detector in the merged events file to provide the background. Too small a region gives uncertain background subtraction, and too large risks introducing systematics from the variation of the background over the chip. We used a background field along the CCD node which harbours the diffuse emission, subtracting a circle of radius centred on the central source.
2.1 The diffuse emission
| Region | Fit-type | Best-fitting parameters and reduced |
|---|---|---|
| Core | Power-law | , |
| pexrav∗ | rel. refl, | |
| cover. , | ||
| cover. fract.%, | ||
| NE | Power-law | , |
| Par. Cover.† | cover. , | |
| cover. fract.%, , | ||
| Diffuse | mekal | keV, , |
| , | ||
| Power-law | , | |
| , | ||
| mekal‡ | keV, , | |
| Power-law‡ | , |
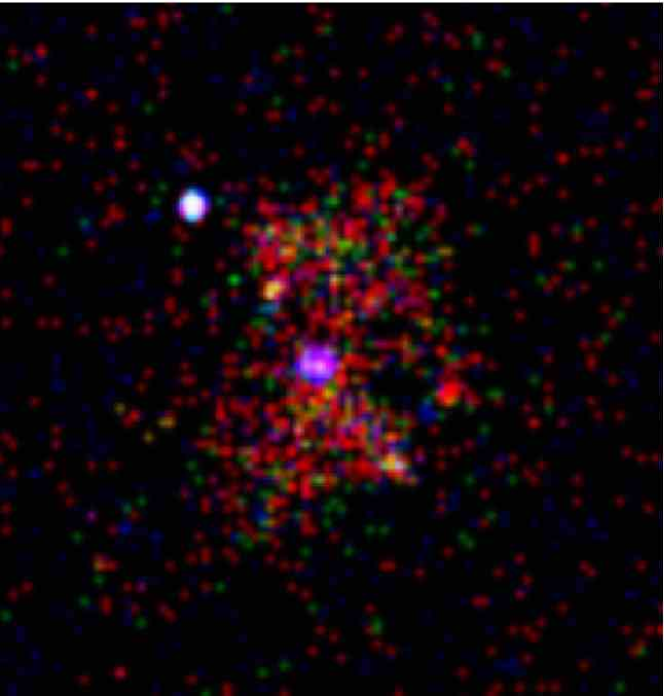
The diffuse X-ray emission has the distinctive hourglass shape seen in our earlier observation of this object (Fabian et al. 2001). In Fig. 1 we show images of the emission, smoothed by a Gaussian, in three observed energy bands (0.3-1.0, 1.0-1.5 and 1.5-5.0 keV), superimposed as red, green and blue.
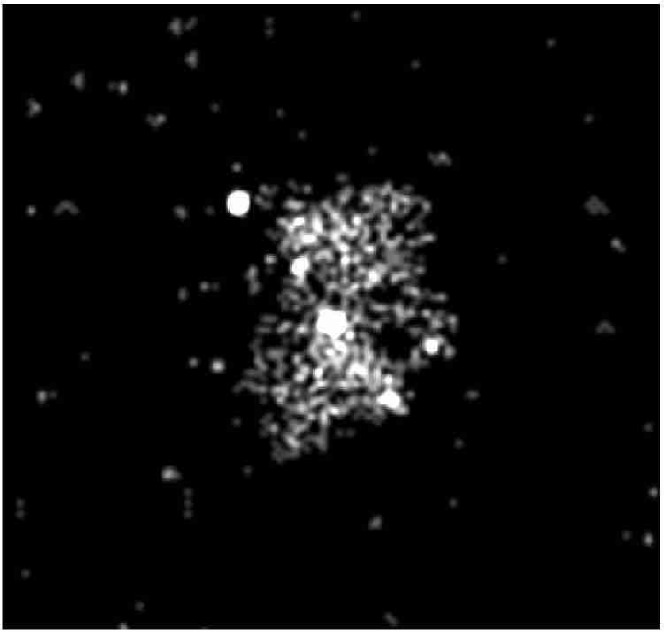
In order to see the diffuse emission above the background easily we have applied a background-reduction technique (analogous to applying a cut in brightness to an image with many photons), the result of which shown in Fig. 2 (top). We removed those photons which did not have 3 or more neighbouring photons within a radius of 1 arcsec from them. The removed photons were in a flat distribution around the diffuse emission.
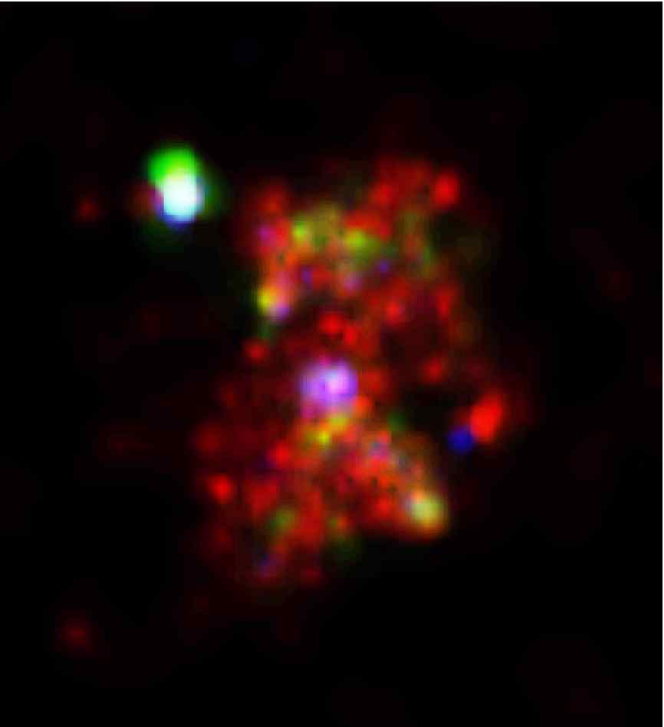
To highlight the main features of the three-colour image (Fig. 1) we show a smoothed version of it in Fig. 2 (bottom). We used the bin accretion algorithm of Cappellari & Copin (2002) to create a tessellated image in each of the three bands with a ratio of signal to Poisson noise of 0.8. The centroids of the cells formed by tessellation were then interpolated with the natgrid natural neighbour interpolation library111http://ngwww.ucar.edu/ngdoc/ng/ngmath/natgrid/nnhome.html to form images, which were superimposed as red, green and blue layers.
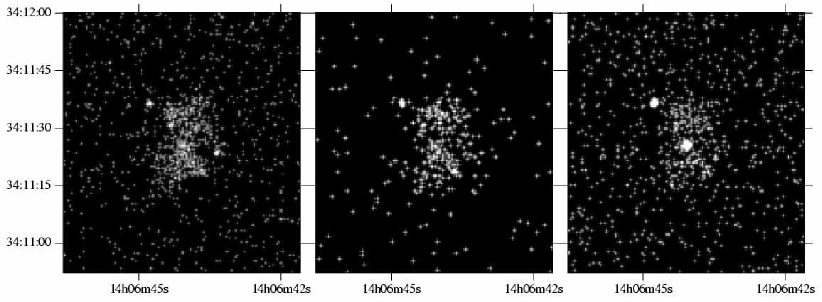
The raw images are shown individually in Fig. 3, emphasizing that the emission is extended in each of the three bands. The diffuse emission is still visible in a 3-5 keV image, corresponding to 8.4-13.9 keV in the rest frame. Binning the data into 16 arcsec bins shows there is no evidence for any low intensity emission surrounding the central diffuse emission (we calculate limits for the outlying gas in Section 4.1.1).
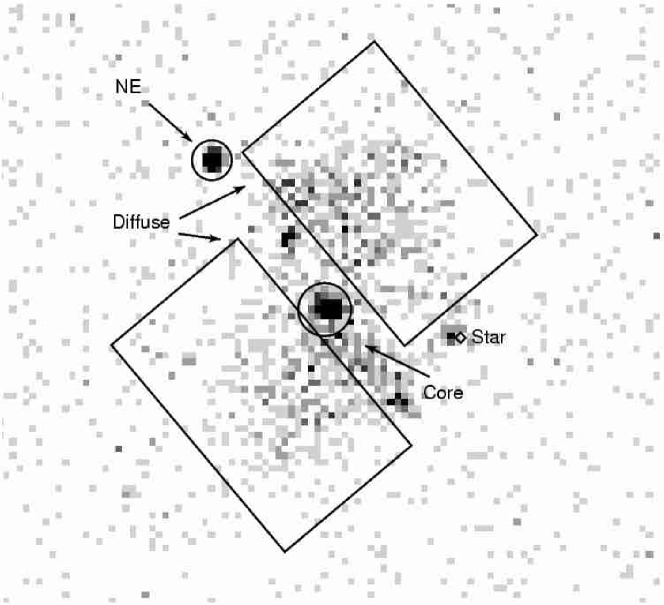
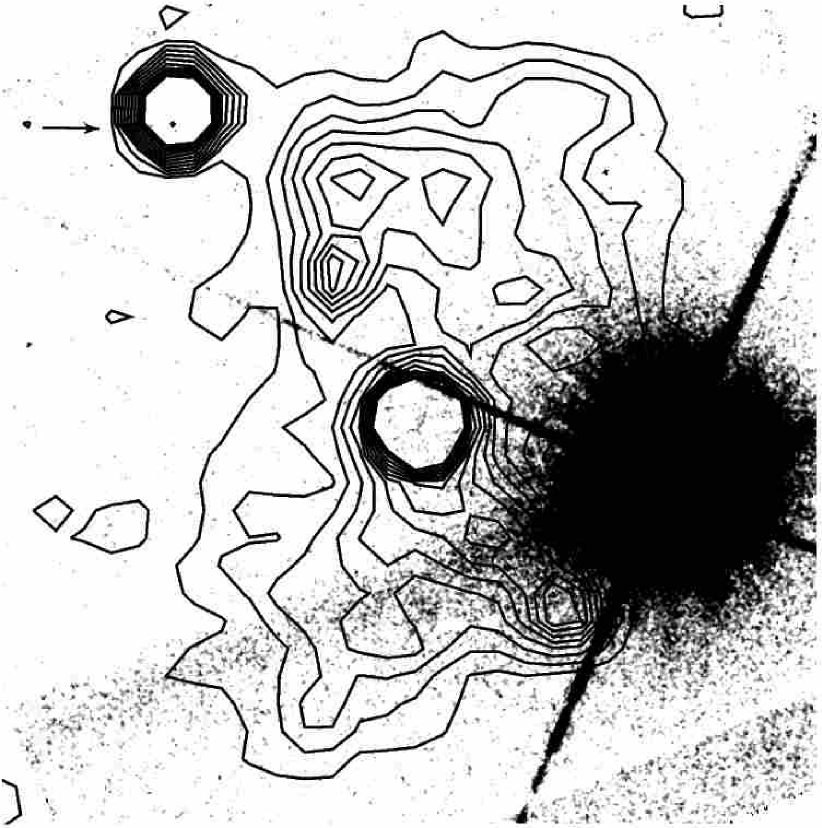
The images also show several point sources: a central hard source corresponding to the position of the radio core, another hard source 14 arcsec to the north-east (NE), a soft source 9 arcsec to the west-south-west (WSW), and two fairly soft sources along the direction of the radio axis (6 arcsec to the NE and 8 arcsec to the SW) corresponding to the position of the radio hotspots. We will discuss these point sources in later sections.
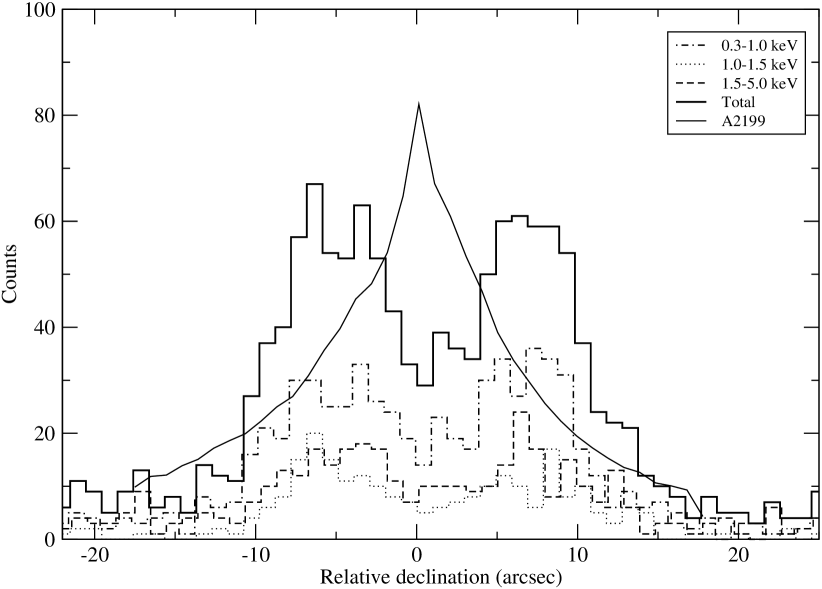
The surface brightness declines sharply at the edge of the hourglass shape. Fig. 4 shows a surface brightness cut in a north-south direction, measured by moving a box along that axis, excluding the point source in the centre, the NE and the WSW. We show the number of counts in the three observed bands: 0.3-1.0, 1.0-1.5 and 1.5-5.0 keV. The profile appears box-like with the number of counts dropping from about 60 to 10 in around 5 arcsec at the N and S edges.

The profile in the east-west direction declines more smoothly than that in the north-south direction. In the southernmost lobe the diffuse emission declines slowly to the east. In the northernmost lobe it declines slowly to the west.
We fitted the 0.3-6 keV spectrum of the diffuse emission from the regions shown in Fig. 5 by a mekal model (Mewe, Gronenschild & van den Oord 1985; Liedahl, Osterheld & Goldstein 1995) with a phabs absorbing screen (Balucinska-Church & McCammon 1992), giving best-fitting parameters of keV, , (with uncertainties). At 2, the uncertainty on the temperature was keV. The data were binned into spectral bins containing at least 20 counts. The spectrum is shown in Fig. 6, with the contributions to from each spectral bin. The reduced of the fit was 1.00 (33.0/33). The regions were chosen to exclude the emission from along the radio axis of the source, an area which could be contaminated by inverse Compton emission. We summarise the results of spectral fits in Table 1.
We also fitted the spectrum of the diffuse emission using a power-law absorbed by a phabs model. This model fitted the spectrum well (reduced ) with a photon index of , however it required strong absorption of which would be unreasonable if it were distributed over the whole volume of the diffuse emission.
Although both models fitted so far require excess absorption, there is a known degradation of the ACIS soft X-ray response222http://cxc.harvard.edu/cal/Links/Acis/acis/Cal_prods/qeDeg/ which may account for this. We have refitted the spectra making use of the preliminary response model acisabs of Chartas & Getman (2002). Fitting the spectrum from 0.4-6 keV by a power-law model (increasing the lower energy bound of the spectral fit as suggested by the documentation of this model) and absorbing it with the acisabs model plus a phabs model (fixed to the Galactic value of ), the reduced of the best-fit was . The best-fitting photon index was (), and the intrinsic luminosity of the power-law was between 1 and 10 keV in the restframe. There was no indication of an iron line in the residuals of the power-law fit. We note, however, that the energy of an iron line would lie close to the iridium M-edge of the mirror, which could cause a problem if the spectral calibration is not perfect.
We also fitted a mekal model absorbed by the acisabs and phabs models as above, allowing the abundance and temperature to be free. In that case the best-fitting temperature of the gas was keV () or keV (). The best-fitting abundance was () or (). A plot of space shows the errors in temperature and abundance to be largely orthogonal. The reduced of the best-fitting parameters was . Separate spectra of the northern and southern lobe were made, and fitted simultaneously with the absorbed mekal model above. There was no evidence in the residuals of the fit indicating that the spectra of the two lobes were different.
As a final check, we refitted the spectrum of the diffuse emission by minimizing a modified version of the C-statistic (allowing background subtraction; Arnaud 2002) rather than the -statistic. With the mekal model, we found temperature and abundance of and (), fitting the spectrum from 0.4-6 keV. Fitting from 1-6 keV, we obtained a temperature of keV, confirming the result above using the -statistic. A power-law model gave the best-fitting spectral index . The C-statistic does not provide a goodness-of-fit.
In summary, providing that we assume that the acisabs model is appropriate for correcting the ACIS-S low energy response, both mekal and power-law models give acceptable fits to the spectrum of the diffuse emission. The best-fitting mekal temperature is keV and the abundance is (), with a reduced of 0.98. The best-fitting power-law spectral index is , with a reduced of 0.64.
2.2 The source to the West-South-West (WSW)
We extracted archival Hubble Space Telescope (HST) Wide Field Planetary Camera 2 (WFPC2) data of four observations of 3C294 (datasets U27LFC0{1,2,3,4}T). The observations were taken using a filter with a central wavelength of 6895Å, and each had an exposure time of 140 s. The data were combined using the iraf task crrej.
The HST field in Fig. 7 is dominated by a star known as U1200-07227692 in the USNO-A2.0 catalogue (Monet et al. 1998). The star has B and R-band magnitudes of 13.0 and 11.5 in that catalogue, and a V band magnitude of 12.0 (Hubble Guide Star Catalogue 1.2, Lasker et al. 1990). Quirrenbach et al. (2001) discuss the various disagreeing measurements of the position of this star, but state that the USNO-A2.0 position is the most accurate. The position in this catalogue (14:06:43.3, +34:11:23.5) matches within an arcsec the position of the soft X-ray source to the south-east-east of the central nucleus (Figs. 3 & 5).
This star was reported to be an F-type star by Wyndham (1966; spectrum taken by F. Zwicky 1965). Stockton, Canalizo & Ridgway (1999) found the star to be a double with a separation of 0.13 arcsec, and an intensity ratio of 1.5:1 in . McCarthy et al. (1990) from its spectrum find it to be a subgiant K star, with a spectral break at 4000Å.
The flux of this source is between 0.3 and 5 keV. This flux is low (relative to its optical luminosity) when compared with the fluxes of optically bright main-sequence stars (Hünsch, Schmitt & Voges 1998). The low flux is more typical of subgiant K stars than F-type stars.
2.3 The North-East (NE) source

The X-ray spectrum of the source to the NE of the core is shown in Fig. 8. It is well fitted by an absorbed () power-law model, but the best-fitting photon index is unphysical at 0.7. A partial covering model fits better, with an absorption of , a partial covering fraction of per cent, a power law index of ( errors). The reduced for the fit was . The model was fitted to the data in spectral bins of at least 20 counts, and between the energies of 0.5 and 7 keV. We added Galactic absorption and corrected the data with the acisabs model, although the correction makes no difference to the best-fitting parameters. The source contains very few counts below 0.8 keV, suggesting it is heavily absorbed. If this source lies at the same redshift as 3C294 its intrinsic luminosity is between 1 and 10 keV.
The HST image of 3C294 in Fig. 7 contains a very-faint point source at the location of the NE source. We estimated a photometric redshift for this source using the publicly available code hyperz (Bolzonella, Miralles & Pelló 2000), and calibrated, archival imaging data from the HST (F702 filter), INT Wide-Field Camera (i´Sloan filter) and UKIRT (K filter). The best solution is consistent with , though we emphasize that this is based on three filters only. The best-fitting solution is , and there is a secondary solution (90 per cent confidence intervals).
The flux from this source in X-rays varied between the original Chandra observation and the one we present here. In the original observation on 2000 October 29 the count rate between 0.5-7 keV was . The combined count rate from the merged datasets here is . Therefore the flux of the source declined by a factor of in s.
2.4 The core spectrum


A power law model is not a good fit to the spectrum of the core source, associated with the central active nucleus. The best-fitting photon index was not physical at , and the reduced was 2.7. The data were fit between 0.5 and 7 keV.
A much better fit is found using a partially-obscured pexrav (Magdziarz & Zdziarski 1995) reflection model plus emission from a neutral iron line at 6.4 keV (Fig. 9), with Galactic absorption. acisabs correction had little effect on the best fitting values, although the uncertainties on the best-fitting parameters were lower since we did not fit for Galactic absorption, instead fixing it. We quote the values corrected by acisabs absorption here. The partial coverer was placed at the redshift of the source.
The relative ratio of the reflected to direct component was found to be (). The covering model had a column density of and a covering fraction of per cent (). Solar abundance was assumed, as was an inclination angle of , and the width of the iron line was set to zero. The reduced of the fit was . The flux in the iron line was photon. Using an F-test, we estimate there is only a 3.5 per cent probability of an intrinsic spectrum without the added neutral iron line giving as a good a fit as a model with the line.
Fig. 10 shows the spectrum of the best-fitting model, with the width of the iron line set to 0.05 keV. The intrinsic luminosity of the underlying power law is between 1 and 10 keV in the rest frame, after correction for absorption. We note that the direct emission leaking to our line of sight below 1.5 keV (Fig. 10) need not be due to partial covering, but just to some of the radiation being scattered by ionized gas. In this case the above nucleus luminosity is a lower limit.
The HST image in Fig. 7 shows a faint elongated structure at the position of the X-ray nucleus, aligned roughly in the north-south direction.
2.5 Radio hotspots
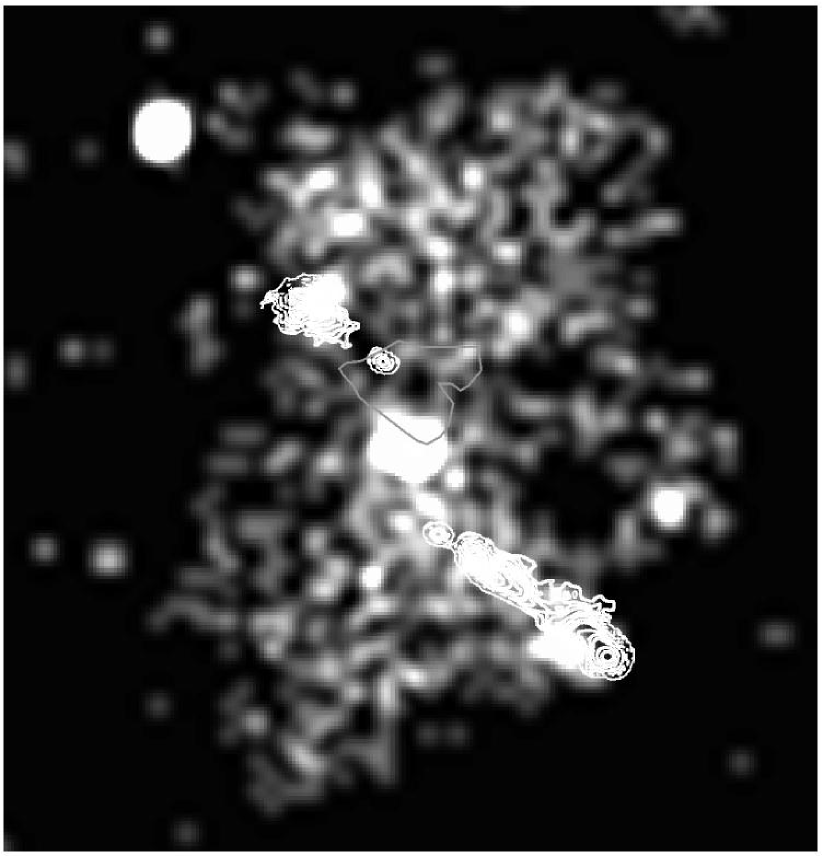
Fig. 11 shows an overlay of the X-ray emission between 0.3 and 5 keV, overlayed with 6 cm radio and a Lyman- contour taken from Fig. 2 of McCarthy et al. (1990). To make this image, the McCarthy et al. data were converted to J2000 coordinates, and the central radio source was aligned with the Chandra X-ray source. The radio hotspots are in a similar position to the two X-ray point sources along the radio axis, but the X-ray sources are rotated by about 6 degrees clockwise about the core from the radio hotspots, and appear to be closer in. Each spot is displaced by about 1.8 arcsec. The X-ray sources contain too few counts to generate a spectrum, but can easily be seen in the 0.3-1 and 1-1.5 keV images, but not from 1.5-5 keV, indicating that they have soft spectra (, the value of the diffuse flux, Section 2.1). If we assume a photon index for the spectrum of the hotspots of 2.3, the unabsorbed flux emitted in a 1.2 arcsec radius circle about the NE hotspot from 1-10 keV is (rest frame 1-10 keV luminosity ). The intrinsic flux for the SW hotspot is ().
3 Interpretation of the point sources
3.1 The NE source
This source is bright in the X-ray band and has a low optical flux. The X-ray spectrum indicates that it is highly absorbed. The source has also varied in X-ray brightness strongly over 18 months. It is therefore likely to be a Seyfert II galaxy (of an intrinsic luminosity of between 1 and 10 keV), harbouring a highly obscured AGN. The galaxy may be a member of the cluster, a possibility supported by its photometric redshift.
3.2 Radio axis features
Four sources appear to lie along the direction of the radio axis: the core (§2.4), two sources coincident with the radio hot spots, and the NE source (§2.3). Indeed, the NE source is on a direct line joining the lower hotspot and the core. It is tempting to directly connect the NE source with the radio axis, but it is difficult to suggest a mechanism describing how the radio axis could trigger activity in the NE source, which appears to be a Seyfert II. The hotspots, the core, and the NE source are probably aligned by chance.
3.3 The central source
The spectrum of the central source is fit well with a model of a highly obscured, reflection-dominated, AGN. The intrinsic luminosity of the nucleus is of the order of .
4 Interpretation of the diffuse emission
4.1 Thermal
4.1.1 Hydrostatic models
If we approximate the emitting volumes as two spheres of radius 6.4 arcsec, then the total emitting volume is . Using the normalisation of the mekal model (with the acisabs correction), we find the electron density to be approximately . The energy content of the hot gas is therefore of the order (assuming keV), where is the total particle density. If this were delivered over , this would require a power of , not including work.
If we are observing gas in hydrostatic equilibrium, the sharp edges at 100 kpc mean that the scale height there is kpc. The virial temperature of the cluster then has to be times the temperature of the gas. Therefore if this is a cluster in hydrostatic equilibrium it must be very hot, extremely massive, and more massive than RX J1347-1145 (Allen, Schmidt & Fabian 2002).
Sharp X-ray edges are seen in many nearby clusters in a phenomenon known as a cold front (Markevitch et al. 2000). The gas temperature decreases sharply across these features, with the cooler gas being closer to the centre; pressure is continuous across the front. If this is the explanation for the sharp edges to the diffuse X-ray emission of 3C294, there must be hotter surrounding gas. Assuming pressure equilibrium across the front, then the ratio of the temperatures of the gas either side of the front is approximately equal to the inverse of the ratio of their densities. If we estimate the density drop as a factor of 2.5 (estimated from Fig. 4), then the outer temperature should be roughly 8 keV. This again makes the cluster very hot and rare at its redshift (Fabian et al. 2001). Moreover, the interiors of nearby clusters with cold fronts do not show brightness profiles as flat as we see here.
We can place a limit on the luminosity of any gas that lies outside of the observed diffuse emission. We calculated the flux limit in a shell between radii of 16 and 55 arcsec from the core, assuming a temperature for the gas of 3.5 keV, an abundance of , and Galactic absorption, and find the upper limit on the intrinsic luminosity of that gas between 1 and 10 keV to be . Using this limit we can say that the mean density of gas in the shell must be less than of the average density of gas making the observed extended X-ray source. This is inconsistent with the cold front hypothesis.
Fabian et al. (2001) concluded that the diffuse emission found around the point source in 3C294 was most likely direct X-ray emission from the core of a cluster. Unfortunately our analysis of this longer observation presents some difficulty for this interpretation. In particular, the sharp drops observed at the edges of the diffuse emission are in contrast to the expected profile from intracluster gas. We plot a surface brightness cut of Abell 2199 (taken from data in Johnstone et al. 2002), a cluster at a redshift of 0.0309, on Fig. 4. This cut was produced by enlarging the size of the moving box by a factor of 13.7, corresponding to the relative angular diameter distance of 3C294 compared to A2199, and examining an energy range of 0.82 to 2.71 keV, corresponding to an energy range of 0.3 to 1 keV at the redshift of 3C294. The cut through A2199 has a large central peak, indicating gas with a short cooling time in the centre, and no sharp drops in brightness. The cut through 3C294 is quite unlike A2199, with a largely flat profile and sharp drops at the edges. Note, however, that the diffuse emission has a less abrupt edge to the east and west. The sharpness of the N and S edges to the X-ray emission mean that the gas is disturbed and not in complete hydrostatic equilibrium. Transonic motion may be sufficient to account for what is seen.
Unfortunately we cannot distinguish between a thermal and non-thermal source of the diffuse emission on spectral grounds, nor identify an iron line.
4.1.2 Shocks and mergers
Alternatively, if the central engine underwent a massive explosion in the past we may be observing the shocked material behind two shock fronts travelling to the north and south. In that case the AGN must be embedded in a dense environment such as a cluster, as is shown by the calculated electron density. A factor of 4 density increase by the shock would imply in the preshocked gas, unless adiabatic expansion was already strong. The preshock temperature is unknown but must be such that the gas outside the shock is undetectable (e.g. keV). The total thermal energy in the gas is . The shock velocity must be greater than . Therefore the time since the explosion is . The total energy in the expanding gas (thermal plus kinetic) must be , and the power greater than .
Simpson & Rawlings (2002) make the hypothesis that the diffuse X-ray emission in 3C294 is produced by two shocks propagating in opposite directions from the site of a collision of two clusters. In this model the powerful radio source in the core of 3C294 would have been triggered by the merger. If the collision velocity were then there would be enough energy to raise the temperature of the cluster from 2 to 5 keV. One problem with this model is that the surface brightness profile we observe does not match that expected from simulations of merging galaxies (e.g. Ritchie & Thomas 2002). The region of emission is not expected to have a flat brightness profile and the edges of the heated region are not sharp.
It is interesting that although the diffuse emission from 3C294 does not appear to have the same morphology as some clusters of galaxies thought to be merging (e.g. Markevitch & Vikhlinin 2001), there is a resemblance with Abell 2256 which has subcomponents of keV and keV in an early state of merger at redshift 0.058 (Sun et al. 2002). The core of A2256 has two sharp and smooth edges like 3C294. However the physical scale of the core is about twice as large than that of the emission from 3C294, and the profile not as flat.
Carilli et al. (2002) argue that diffuse X-ray emission seen around the narrow-line radio galaxy PKS 1138-262 is caused by the radio source shocking a cocoon of gas. The morphology of the X-ray emission from 3C294 suggests this is not the case in this object, as the emission does not have the ellipsoidal shape of a radio cocoon (e.g. Cygnus-A, Smith et al. 2002).
In summary, the evidence suggests that a thermal origin for the diffuse emission is implausible unless the gas is in a dynamically active state, and requires significant gas extending beyond that seen.
4.2 Non-thermal
A different interpretation is that we are observing X-rays from the central AGN scattered by the electrons in a surrounding cluster (see Sazonov, Sunyaev & Cramphorn 2002). In this model the central source switched on only recently, and the flux rise time was short so the furthest edges are sharp. A toroidal dust cloud around the nucleus could collimate the radiation into the two cones seen to either side of the nucleus. This model has difficulty in producing the observed surface brightness profile. Since the flux drops as the square of the radius, and the density of any plausible scattering medium will decrease with distance from the AGN, the brightest part of the scattered radiation should be closest to the AGN, with the brightness declining quickly with radius.

The brightness profile can be flattened by inclining the radiation cone towards the observer. To test whether this is a viable explanation for the observed surface brightness profile, we made a simple numerical scattering model. We assumed the optical depth was low enough so that only single scattering events were important. The emission along a line of sight was calculated by integrating along that line the product of the density of the scattering material (taken to be proportional to the reciprocal of the distance from the centre), and the flux at that position at the time when the observer sees it (originally emitted from a central source, but taking into account light travel time). The emission is integrated along positions which lie inside the radiation cones. The cones have an opening angle of and are inclined at an angle of towards and away from the observer, rotated about the -axis. The central source was switched on at for yr. The emission along each line of sight was then integrated along the -axis to simulate the surface brightness cut in Fig. 4.
We show in Fig. 12 the calculated profiles for three different times. Although the profiles appear fairly flat, in linear terms they fall steeply from the centre. There is also a gap in the centre, which is caused by the growing shell of photons moving along the cones. The gap may be avoided by modifying the burst of radiation from the core to have a longer-living tail. 3C294 has a dip in surface brightness to the north of the core, but it is shallow. This model has difficulty in reproducing the flat brightness profile across the cluster. If the density profile in the cluster were inverted (as for a bubble, see Section 4.3), or if the radiation was confined close to the plane of the sky in a fan-like shape, then the brightness profile could be flattened.
A further problem with this model is that only a small fraction of the photons emitted will be scattered by the cluster. We can estimate what the required power for the central source is. The luminosity of the cones (excluding the radio axis) is . If a third of the sky is subtended by the cones (approximately correct if the opening angles of the cones are ), and 1 per cent of the radiation is scattered by the electrons, then this would require an X-ray luminosity between 1 and 10 keV from the central source of . The total bolometric power of the source would be significantly larger. This luminosity is much higher than that seen (Section 2.4) but the source may be variable. It would need to be powered by accretion onto a black hole.
A different non-thermal model is that we are observing inverse Compton scattered radiation from relativistic electrons. In that case the electrons could either be a population scattering CMB (Cosmic Microwave Background) photons requiring energies of (in order to scatter photons into the 1 keV band), or to scatter UV-IR radiation from the central source (e.g. Brunetti, Setti & Comastri 1997). The energy density in the CMB at that redshift was , and the energy density from the nucleus would be ( is the luminosity of the source in units of , and is the distance from the source in units of ). The inverse Compton cooling time of the CMB-scattering electrons would be and the cooling time of the UV-scattering electrons longer by a factor of . We therefore require the total energy in relativistic electrons to be if the radiation was scattered from the CMB, and a factor 1000 times greater if it was scattered from the UV radiation field. We now ignore the UV case given its energy requirements. The total energy in relativistic particles may be 10 to 100 times larger than if we account for other particles such as low energy electrons and protons. To provide an equivalent energy density to the CMB magnetically would require a field of G, which is much more than that found in low-redshift clusters (G; Clarke, Kronberg & Böhringer 2001). Providing the magnetic field is of a similar strength to that in low redshift clusters, inverse Compton losses are expected to dominate over synchrotron losses. electrons will radiate at around in a G field, but otherwise would be undetectable. Such an ‘inverse Compton cloud’ model would be the most energetically efficient way of explaining the data. In order to confine this relativistic plasma the gaseous medium of at least a group would be required in order not to lose the energy by adiabatic expansion.
An inverse Compton origin for the diffuse X-rays surrounding 3C294 therefore appears to be energetically feasible. Such a component in lower redshift clusters will not be dominant, owing to the sixty-fold lower energy density of the CMB. It may however be detectable (e.g. the Coma cluster, Fusco-Femiano et al. 1999; see also the theoretical discussion by Sarazin 1999). Inverse Compton scattering is also invoked to explain the hotspots in several other radio sources (Celotti, Ghisellini & Chiaberge 2001; Hardcastle, Birkinshaw & Worrall 2001), and may account for the excess emission from the radio hotspots in 3C294 (Section 2.5). The X-ray morphology of the diffuse emission does not match that of the radio source (Fig. 11; McCarthy et al. 1990) or of deeper radio images (K. Blundell, priv. comm.). In particular, the X-ray emission to the NW and SE of the nucleus has no radio counterpart. That need not be a major problem though, since the higher energy electron population () necessary for radio emission would have a lifetime of yr and so be absent. We could simply be seeing the older electron population in a source where the jet direction has changed by over the past yr.
4.3 A hybrid model
Many clusters seen at low redshift with central radio sources have bubbles of radio plasma displacing the X-ray emitting gas (e.g. Perseus cluster, Fabian et al. 2000; Hydra A, McNamara et al. 2000; Cygnus A, Wilson, Young & Shopbell 2000). Perhaps the powerful radio source 3C294 has created exceptionally large bubbles in the NS direction in the surrounding ICM on a timescale of yr. As for the bubbles in Hydra A and Perseus, the expansion may be subsonic. The gas will fall back when the radio source drops in intensity. The X-ray emission can then be partially thermal, at large distances from the centre, and non-thermal nearer the centre, particularly along the radio axis.
If we are observing bubbles, the pressure of non-thermal particles in the bubbles will be close to the pressure of the surrounding thermal gas. If we assume a cooling time for the electrons of yr, emitting a power of , then the total energy in the bubbles would be (where is a factor to account for energy in particles not emitted in the band we are observing in). Assuming a volume of , the pressure inside the lobes would be . This pressure is consistent with the pressure found in many clusters.
In this picture, were 3C294 to be at , the inverse Compton emission would be 60 times weaker, and thermal emission from the surrounding cluster would dominate the X-ray image. The bubbles could appear as holes in the X-ray emission.
5 Conclusions and Discussion
3C294 is a powerful, type II, radio-loud quasar, surrounded by extensive diffuse X-ray emission. A diffuse ICM is likely to be present, at least as the working surface for the radio lobes and providing at least some the X-ray emission via bremsstrahlung. The sharp N and S edges to the X-ray emission mean, for a thermal origin, that the gas is not in complete hydrostatic equilibrium. It may have been displaced within the inner third by a bubble of relativistic plasma. Inverse Compton emission from relativistic electrons with probably accounts for emission from the radio hotspots, and possibly all the diffuse emission if such a population exists well beyond the radio structure. The X-ray spectrum of the diffuse emission mildly favours a power-law of non-thermal origin, provided that the preliminary acisabs model for the correction of the soft X-ray degradation of the detector is adequate.
3C294 is an exceptional object, and may be revealing an energetic phase relevant to many rich clusters of galaxies in which a powerful active nucleus transfers considerable energy, and a relativistic particle population, into the ICM. This may be crucial for explaining the properties of present-day clusters (see e.g. Wu, Fabian & Nulsen 2000).
Acknowledgements
ACF and CSC thank the Royal Society for their support. The authors are also grateful to Poshak Gandhi for his analysis of the available optical data for the NE source.
The HST data presented in this paper were obtained from the Multimission Archive at the Space Telescope Science Institute (MAST). STScI is operated by the Association of Universities for Research in Astronomy, Inc., under NASA contract NAS5-26555.
References
- [1] Allen S.W., Schmidt R.W., Fabian A.C., 2002, MNRAS, 335, 256
- [2] Anders E., Grevesse N., 1989, Geochimica et Cosmochimica Acta, 53, 197
- [3] Arnaud K.A., 2002, ApJ, submitted
- [4] Balucinska-Church M., McCammon D., 1992, ApJ, 400, 699
- [5] Bolzonella M., Miralles J.-M., Pelló R., 2000, A&A, 363, 476
- [6] Brunetti G., Setti G., Comastri A., 1997, A&A, 325, 898
- [7] Cappellari M., Copin Y., 2002, in Rosado M., Binette L., Arias L., eds, ASP Conf. Ser., Galaxies: the Third Dimension, astro-ph/0202379
- [8] Carilli C.L., Harris D.E., Pentericci L., Röttgering H.J.A., Miley G.K., Kurk J.D., van Breugel W., 2002, ApJ, 567, 781
- [9] Celotti A., Ghisellini G., Chiaberge M., 2001, MNRAS, 321, L1
- [10] Chartas G., Getman K., 2002, http://www.astro.psu.edu/users/chartas/xcontdir/xcont.html
- [11] Clarke T.E., Kronberg P.P, Böhringer H., ApJ, 547, L111
- [12] Crawford C.S., Fabian A.C., 1996, MNRAS, 282, 1483
- [13] Ettori S., Fabian A.C., Allen S.W., Johnstone R.M., 2002, MNRAS, 331, 635
- [14] Fabian A.C. et al., 2000, MNRAS, 318, L65
- [15] Fabian A.C., Crawford C.S., Ettori S., Sanders J.S., 2001, MNRAS, 322, L11
- [16] Fusco-Femiano R., dal Fiume D., Feretti L., Giovannini G., Grandi P., Matt G., Molendi S., Santangelo A., 1999, ApJ, 513, L21
- [17] Hardcastle M.J., Worrall D.M., 1999, MNRAS, 309, 969
- [18] Hardcastle M.J., Birkinshaw M., Worrall D.M., 2001, MNRAS, 323, L17
- [19] Johnstone R.M., Fabian A.C., Allen S.W., Sanders J.S., 2002, MNRAS, 336, 299
- [20] Lasker B.M., Sturch C.R., McLean B.J., Jenker H., Shara M.M., 1990, AJ, 99, 2019
- [21] Liedahl D.A., Osterheld A.L., Goldstein W.H., 1995, ApJ, 438, L115
- [22] Magdziarz P., Zdziarski A.A., 1995, MNRAS, 273, 837
- [23] Markevitch M., et al., 2000, ApJ, 541, 542
- [24] Markevitch M., Vikhlinin A., 2001, ApJ, 563, 95
- [25] McCarthy P.J., Spinrad H., van Breugel W., Liebert J., Dickinson M., Djorgovski S., Eisenhardt P., 1990, ApJ, 365, 487
- [26] McNamara B.R. et al., 2000, ApJ, 534, L135
- [27] Mewe R., Gronenschild E.H.B.M., van den Oord G.H.J., 1985, A&AS, 62, 197
- [28] Monet D., et. al., 1998, USNO-A2.0 (Washington: USNO)
- [29] Quirrenbach A., Roberts J.E., Fidkowski K., de Vries W., van Breugel W., 2001, ApJ, 556, 108
- [30] Ritchie B.W., Thomas P.A., 2002, MNRAS, 329, 675
- [31] Sarazin C.L., 1999, ApJ, 520, 529
- [32] Simpson C., Rawlings S., 2002, MNRAS, 334, 511
- [33] Sazonov S.Yu., Sunyaev R.A., Cramphorn C.K., 2002, A&A, 393, 793
- [34] Smith D.A., Wilson A.S., Arnaud K.A., Terashima Y., Young A.J., 2002, ApJ, 565, 195
- [35] Stockton A., Canalizo G., Ridgway S.E., 1999, ApJ, 519, L131
- [36] Sun M., Murray S.S., Markevitch M., Vikhlinin A., 2002, ApJ, 565, 867
- [37] Wilson A.S., Young A.J., Shopbell P.L., 2000, ApJ, 544, L27
- [38] Wu K.K.S. Fabian A.C., Nulsen P.E.J, 2000, MNRAS, 318, 889
- [39] Wyndham J.D., 1966, ApJ, 144, 459