2002 \SetConfTitleTexMex 8
About the emission line sequence of H II galaxies
Abstract
We consider 400 H ii galaxies in which the oxygen abundances were obtained by electron temperature based methods. We split the sample in three metallicity bins. In each bin, a narrow sequence is found not only in pure emission line ratio diagrams but also in terms of H equivalent width, indicating the existence of an evolutionary sequence. Our diagrams show unambiguously the existence of an evolution on a timescale of a few Myr. We compare the observed sequences with photoionization models of appropriate metallicity. In order to understand the evolution of H ii galaxies one needs to consider the evolution of the gas as well as that of the stars. The observations require EW(H) to decrease more rapidly than predicted by the passive evolution of a starburst. A photoionized adiabatic expanding bubble with a covering factor decreasing with time reproduces most diagrams. However, the question of the heating of H ii galaxies and the origin of the nebular He ii 4686 emission are not settled. We find evidence for self-enrichment in nitrogen on a time scale of several Myr.
H II regions
0.1 Introduction
It has been known for years that giant H ii regions form a narrow sequence in various emission line ratio diagrams (e.g. McCall, Rybski & Shields 1985). The reasons for the existence of such a sequence are not yet fully understood. The first interpretations, based on single star photoionization models,concluded that metallicity is driving the sequence, but variation of an additional parameter – either the effective temperature of the stars or the ionization parameter – is needed to reproduce the observed sequence (McCall et al. 1985; Dopita & Evans 1986). More recent studies using stellar population synthesis have shown that the spectral energy distribution of the ionizing radiation depends naturally on metallicity, both through stellar structure and evolution and through the effect of opacities in the stellar atmospheres (e.g. Mc Gaugh 1991).
However, star formation proceeds by bursts and giant H ii regions are powered by clusters of coeval stars (e.g. Sargent & Searle 1970, Mas-Hesse & Kunth 1999). Stellar evolution produces a gradual modification of the integrated stellar energy distribution. Spectra of H ii regions whose ionization is dominated by one single cluster can then be caught at different cluster ages. This is the case of blue compact dwarf galaxies or dwarf irregular galaxies, which are referred to under the common name of H ii galaxies. These objects make up invaluable tools to study the evolution of stellar systems and their interaction with the surrounding interstellar medium during the phase where massive O stars are present.
Several studies (see references in Stasińska & Izotov 2003, hereafter SI2003) have been devoted to this question, based on various samples and somewhat different approaches. Here, we give an account of the SI2003 paper, which aimed at finding what conditions are needed to reproduce the observed sequence of H ii galaxies with models of H ii regions surrounding evolving starbursts. The success of this enterprise has greatly benefited from the fact that we were able to construct a homogeneous sample of H ii galaxies of unprecedented size, in which the oxygen abundances were derived in a model-independent way. This allowed us to divide the sample into three metallicity bins, and study each of them independently.
We describe the data sample, comment on the observational trends and present some model sequences. Details about the sample and the modeling procedure can be found in SI2003. We take the opportunity of this conference to develop on some aspects that were only briefly mentioned in SI2003. In particular, we refer to the viewpoint presented by R. Terlevich at this conference.
0.2 The observational sample
Ideally, the sample should be as much as possible relevant, homogeneous, complete (or with well understood biases) and large (since there are at least two independent parameters: age and metallicity).
Metal-poor H ii galaxies are the best candidates to study the evolution of giant H ii regions. As opposed to giant H ii regions in spiral galaxies, their spectra are not affected by the light from the stars located in the disk. Also, the high enough electron temperature allows detection of the [O iii] 4363 line and therefore direct determination of the oxygen abundance by the electron temperature method (this is not the case of giant H ii regions found in the inner parts of disk galaxies). In addition, the dust content in H ii galaxies is small, which makes the interpretation of the data easier and more robust.
Our sample of H ii galaxies was obtained by merging 100 blue compact galaxies from the First and Second Byurakan surveys and 300 emission-line galaxies from the early data release of the SLOAN digital sky survey (SDSS, Stoughton et al. 2002). Only objects with a detected [O iii] 4363 emission line were included. The spectra of the entire sample were reduced and reddening-corrected with identical procedures and the abundances were derived in the same way.
The spectra of the Byurakan survey galaxies were obtained by Izotov and coworkers to determine the pregalactic helium abundance, therefore the signal-to-noise is high and the H equivalent widths, (H), are large by observer’s selection. The SDSS galaxies reach larger distances, but their H luminosities are rougly similar to those of the Byurakan galaxies. For the majority of the objects, the extinction is small ().
0.3 Diagnostic diagrams
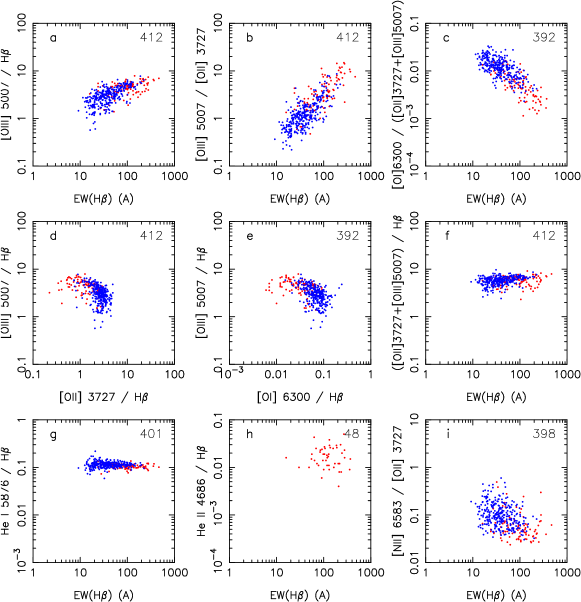
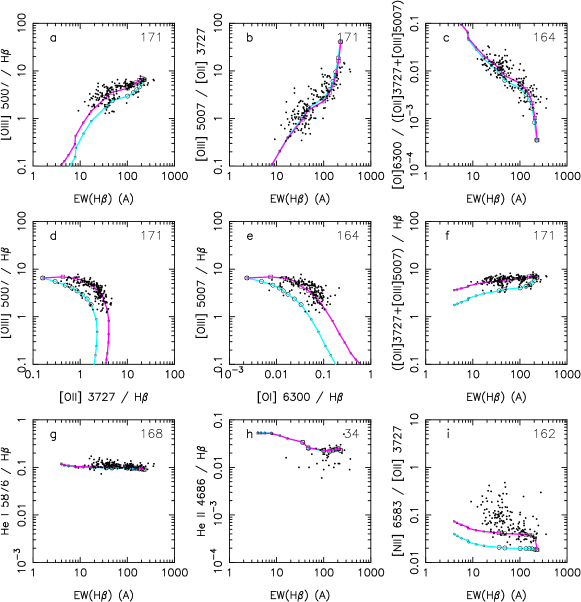
The diagrams were carefully chosen to provide strong constraints on the evolution of the ionizing clusters and of their surrounding H ii regions. The relatively high quality of the data for the entire sample allowed us to use not only the classical strong lines, i.e. [O ii] 3727, [O iii] 5007, and H, but also weaker lines such as [O i] 6300, He i 5876 and He ii 4686 (the latter, being at the level of 0.003 – 0.03 of H, is detected only in the Byurakan sample). These weak lines should not be discarded as they provide very important diagnostics. We also consider a diagram involving [N ii] 6584/[O ii] 3727.
Fig. 1 shows the distribution of the observational points in 9 diagrams. The relative distribution of the Byurakan objects (red points) and of the SDSS objects (blue points) implies that the nature of the objects is likely similar and justifies the merging of the two samples. Fig. 1 shows that H ii galaxies form a sequence not only in the classical line-ratio diagrams ([O iii] 5007/H vs [O ii] 3727/H and [O iii] 5007/H vs [O i] 6300/H 111the sequence in the pure line-ratio diagrams is truncated with respect to diagrams built with H ii regions from spiral galaxies, since the metal-rich objects are lacking.) but also, and very clearly, as a function of (H). This indicates an evolutionary sequence: either on a timescale of a few Myr, as the death of massive stars progressively reduces the H emission or on time scales of Gyr, as previous generations of stars gradually build up the H continuum. The latter view is the one adopted by Terlevich in these proceedings, using different arguments 222The sample used by Terlevich contains also metal-rich objects where the effects of previous generations of stars are expected to be stronger.. The fact that the [O iii] 5007/[O ii] 3727 and [O i] 6300/([O ii] 3727+[O iii] 5007) ratios show very strong trends with (H) and that the same trends are seen for each metallicity bin (see Figs. 2 and 4 and SI2003 for more details) argue for the first interpretation as being the main cause of the observed sequence in our sample. Therefore, (H) is indicative of the age on the ionizing stellar population (although not directly, since several factors must be taken into account, see later).
The fact that a sample of 400 objects shows such clear trends is remarkable. This means that, in spite of the complexity revealed by detailed studies of a few H ii galaxies, the overall evolution of such objects must obey simple laws.
Note that [N ii] 6584/[O ii] 3727 is seen to increase as (H), although with higer dispersion than [O i] 6300/([O ii] 3727+[O iii] 5007).
0.4 The modeling strategy
All the details are published in SI2003. The observational sample is subdivided in 3 metallicity bins: ‘’high” metallicity (between 0.25 and 0.12 times solar),“intermediate” (between 0.12 and 0.036 times solar) and ‘’low” (below 0.036 times solar). For each bin we construct sequences of photoionization models that represent the evolution of a giant H ii region of appropriate metallicity. The aim is to find what conditions are needed to reproduce simultaneously all the observed diagrams (within the known uncertainties and biases) both from the point of view of the location of the sequences and of the density of points in each zone of the diagrams. We start with the simplest physically reasonable models and proceeded step by step, justifying the increase in complexity by the requirement of fitting the data.
0.5 Results
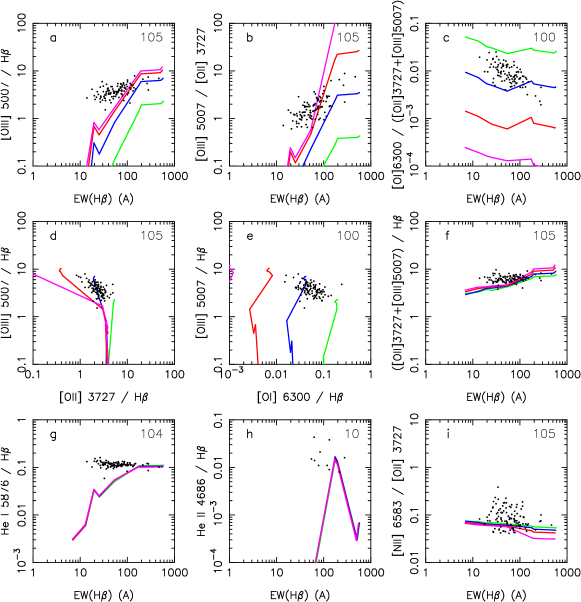
Fig. 2 shows that the classical modeling with non-evolving homogeneous spheres is incapable of reproducing the observed slopes in panels a, b and c. But the evolution of the exciting stars is not the only factor modifying the spectrum of a giant H ii region.
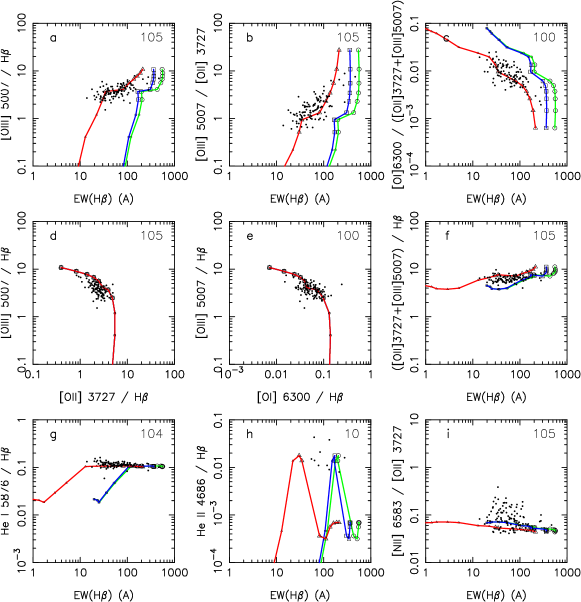
One of the most striking observed trends is the steady increase of [O i] 6300/([O ii] 3727+[O iii] 5007) as (H) decreases. As known, stellar winds sweep the surrounding matter and confine the emitting gas in a thin expanding shell. This induces an important decrease of the ionization parameter and allows to reach the highest observed values of [O i] 6300/([O ii] 3727+[O iii] 5007) in about 5 Myr (see green curve in Fig. 3). However, it does not reproduce the observed slopes in panels a, b, c. Also, the models give higher (H) than observed in early ages. Selective dust absorption, if existing, would have only a minor effect since the extinction is small. The presence of an older, non ionizing stellar population, attested by stellar features, increases the continuum and thus reduces (H). However, the older population is independent of the age of the most recent starburst (although it may depend on the metallicity, being likely more important for H ii galaxies having reached a higher metallicity). The blue curve in Figs. 3 and 4 represents a sequence with an average old population added. While this brings the highest (H) in better agreement with the observations, this does not solve the problem of the slopes in panels a, b and c, and does not explain why He i 5876/H remains constant in the entire range of (H). What is needed is to lower (H) more rapidly. One way to achieve this is to consider a covering factor of the ionizing source decreasing with time.
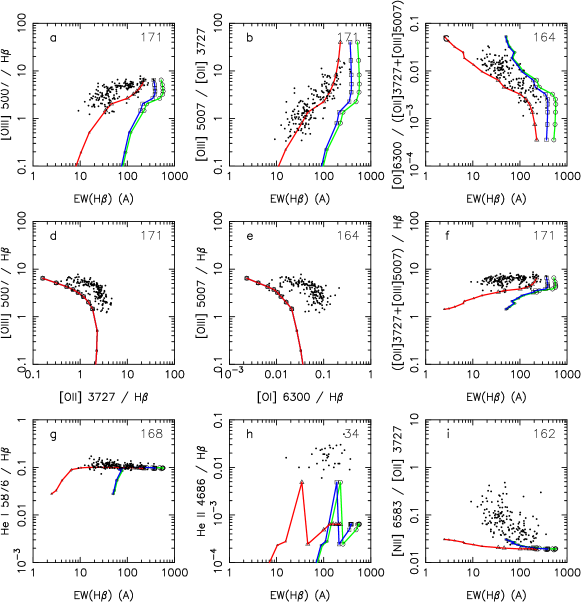
While this can explain the “high” metallicity bin, the “intermediate” and “low” metallicity bins show further problems. The He ii 4686 nebular emission occurs too frequently and in too wide a range of (H) to be attributed to either the hard photons from Wolf-Rayet stars (Schaerer 1998), or the X-rays from young starbursts (Cerviño et al. 2002). The cyan curve in Fig. 5 shows the effect of photoionization by an X-ray source of luminosity erg s-1 (10 times the initial H luminosity). Such X-rays could originate from massive binaries or from supernova remnants in the age range of 10 – 50 Myr (Van Bever & Vanbeveren 2000). Even this amount of X-rays cannot heat the gas enough to reconcile models and observations in panels d and e. Additional heating mechanisms must be investigated. Hard photons from planetary nebulae and white dwarfs from earlier generations of stars are certainly not enough. Photoelectric heating by dust grains is likely negligible, due to the low ionization parameters involved. Shocks produced by winds and supernovae from the latest burst of star formation are far from sufficient. But the hypothesis of either turbulent heating or shock heating due to stellar winds from previous generations of stars are promising and need to be investigated. However, a heating deficiency is not the only way to explain the discrepancy. Points in line ratio diagrams can also be displaced by the presence of a diffuse gas component. Another option is to invoke chemical inhomogeneities, which are indeed expected in zones affected by mass loss and supernova explosions from massive stars. The question is what is the state of the newly synthesized matter, and how much of it has escaped the nebula. The problem is far from settled. Direct evidence for self-enrichment is scarce (see Kobulnicky 1999) but the observed increase of [N ii] 6584/[O ii] 3727 as (H) decreases argues for a nitrogen self-enrichment on timescales of a few Myr. Of course, this in itself does not argue for any oxygen self-enrichment, since the nitrogen and oxygen donors are not the same. As an example, the purple curve in Fig. 5 combines two sequences with nebular metallicities 0.2 Z⊙ and 0.05 Z⊙ (the apparent metallicity of these combined models as derived from temperature based methods would of course be intermediate between these values) and is good agreement with the observations. Similar conclusions are drawn for the ‘’low” metallicity bin.
0.6 Final remarks
Considering a large and homogeneous sample of H ii galaxies with oxygen abundances determined from temperature-based methods, we have built three subsamples of different metallicities and compared each of them with models of H ii regions ionized by evolving star clusters of appropriate metallicity. This allowed us to distinguish evolution and abundance effects in the emission line sequence of H ii galaxies. This, and the use of weak lines in conjunction with classical strong lines allowed us to sharpen up our view on the evolution of H ii galaxies. H ii galaxies draw a tight sequence not only in metallicity but also in age, on a time scale of a few Myr, corresponding to the lifetimes of massive stars. This is in agreement with the view that the excitation of an H ii galaxy is dominated by a cluster of coeval massive stars. We have shown that unveiling the evolution of H ii galaxies requires taking into account the dynamical evolution of the gas. The adiabatic expanding bubble theory provides a good frame. While the equivalent width of H is definitely linked to the age of the most recent starburst, the observations demand that (H) decreases faster than predicted by normal photoionization models. This cannot be the effect of an older stellar population alone or of selective dust absorption, and calls for a covering factor decreasing with time (implying that a growing amount of Lyman continuum radiation is escaping from H ii galaxies). \adjustfinalcolsThe origin of the nebular He ii 4686 emission is not clear. The question of the heating of giant H ii regions is not definitely settled. We see evidence for an enrichment in nitrogen on a timescale of a few Myr. Possibly, H ii galaxies are not homogeneous in oxygen abundance.
While our study has allowed to considerably improve our diagnostic on the evolution of H ii galaxies, a real understanding of this evolution now implies a dynamical modeling that would be able to reproduce all the observed trends.
Acknowledgements.
G. S. thanks the conference organizers for support. Y. I. acknowledges support from the Observatoire de Paris and the Swiss SCOPE 7UKPJ62178 grant. The Sloan Digital Sky Survey is a joint project of The University of Chicago, Fermilab, the Institute for Advanced Study, the Japan Participation Group, the Johns Hopkins University, the Los Alamos National Laboratory, the Max-Planck-Institute for Astronomy (MPIA), the Max-Planck-Institute for Astrophysics (MPA), New Mexico State University, Princeton University, the United States Naval Observatory, and the University of Washington. Funding for the project has been provided by the Alfred P. Sloan Foundation, the Participating Institutions, the National Aeronautics and Space Administration, the National Science Foundation, the U.S. Department of Energy, the Japanese Monbukagakusho, and the Max Planck Society.References
- [1] Cerviño, M., Mas-Hesse, J. M., & Kunth, D. 2002, AA, 392, 19
- [2] Dopita, M. A., & Evans, I. N. 1986, ApJ, 307, 431
- [3] Kobulnicky, H. A. 1999, in Wolf-Rayet Phenomena in Massive Stars and Starburst Galaxies, Proceedings IAU Symposium No. 193, eds. K. A. van der Hucht, G. Koenigsberger & P. R. J. Eenens, p. 670
- [4] Mas-Hesse, J. M., & Kunth, D. 1999, AA, 349, 765
- [5] McCall, M. L., Rybski, P. M., & Shields, G. A. 1985, ApJS, 57, 1
- [6] McGaugh, S.S., 1991, ApJ, 380, 140
- [7] Sargent, W. L., & Searle, L. 1970, ApJ, 162, 155
- [8] Schaerer, D. 1998, Highlights of Astronomy, 11a, 134
- [9] Stasińska, G., & Izotov, Y. 2003, AA, 397, 71 (SI2003)
- [10] Stoughton, C., Lupton, R. H., Bernardi, M., et al. 2002, AJ, 123, 485
- [11] Van Bever, J., & Vanbeveren, D. 2000, AA, 358, 462