Observations of H1426+428 with HEGRA
The HEGRA system of imaging air Cherenkov telescopes has been used to observe the BL Lac object H1426+428 () for 217.5 hours in 2002. In this data set alone, the source is detected at a confidence level of , confirming this object as a TeV source. The overall flux level during the observations in 2002 is found to be a factor of lower than during the previous observations by HEGRA in 1999&2000. A new spectral analysis has been carried out, improving the signal-to-noise ratio at the expense of a slightly increased systematic uncertainty and reducing the relative energy resolution to over a wide range of energies. The new method has also been applied to the previously published data set taken in 1999 and 2000, confirming the earlier claim of a flattening of the energy spectrum between 1 and 5 TeV. The data set taken in 2002 shows again a signal at energies above 1 TeV. We combine the energy spectra as determined by the CAT and VERITAS groups with our reanalyzed result of the 1999&2000 data set and apply a correction to account for effects of absorption of high energy photons on extragalactic background light in the optical to mid infrared band. The shape of the inferred source spectrum is mostly sensitive to the characteristics of the extragalactic background light between wavelengths of 1 and 15 m.
Key Words.:
BL Lacertae objects: individual H1426+428 – Gamma-rays: observations – diffuse radiation – intergalactic medium1 Introduction
The extragalactic objects H1426+428 (Remillard et al., 1989) and Mkn 501 are the only established members of the class of extreme synchrotron BL Lac objects (Costamante et al., 2001) detected at TeV energies. Generally, these objects are characterized by a flat X-ray spectrum with with extending into the hard X-ray energy band. In the framework of synchrotron self-Compton (SSC) models, these objects are of particular interest for observations at TeV energies, because the inverse Compton peak of the broad band spectral energy distribution (SED) is expected to be located at these high energies. The measurement of the position of the inverse Compton peak is hampered by the effect of pair-production of high energy photons with low energy (optical and infrared) photons of the extragalactic background light (Nikishov, 1962; Gould & Schréder, 1967; Stecker, de Jager, & Salomon, ). For the given red-shift of H1426+428 the optical depth exceeds unity even for energies of a few 100 GeV. Any detection of a signal at TeV energies translates directly into a high luminosity of the source.
The detection and spectral measurements of H1426+428 by the CAT, and VERITAS groups (Djannati-Ataï et al., 2002; Petry et al., 2002) indicate a steep spectrum between 250 GeV and 1 TeV (well described by a power law with a photon index of for the CAT and for the VERITAS measurements) whereas at higher energies, a detection has been claimed only by the HEGRA group based upon observations carried out in 1999 and 2000 with (Aharonian et al., 2002a, in the following Paper I). The spectrum shows a flattening at energies above 1 TeV that is consistent with the expected signature of absorption as discussed in Paper I. A deep follow-up observation (217.5 hrs) has been carried out in 2002 to investigate the energy spectrum with improved statistics. Results of a reanalysis of the original data set and the results from the recent observations of 2002 are reported. A possible excess from H1426+428 with a significance of 4.1 has been seen with the AIROBICC-Scintillator arrays of HEGRA in the data from 1994/95 corresponding to an integral flux of above TeV (Prahl, 1999). The interpretation and the relation of this excess to data presented here is not clear at present.
2 Analysis technique
The spectral analysis applied to data from the Crab-Nebula (Aharonian et al., 2000), Mkn 421 (Aharonian et al., 2002b), and Mkn 501 (Aharonian et al., 1999) benefits from a signal-to-noise ratio () which is usually . Therefore, relaxed cuts (compared to signal search optimized cuts) on the mean scaled width (mscw) parameter and the angular separation from the source () assures good photon statistics with little systematic effects. However, for weaker sources, the signal-to-noise ratio needs to be improved. The relaxed spectral cuts result in a poor for H1426+428. A tighter cut on mscw and a smaller angular search bin increases the to reducing at the same time the photon efficiency to the level of . See Table 1 for a summary of the cuts applied to select the data set, events, and images used in this analysis.
The algorithm for reconstructing the energy of the primary photon has been improved following the methods suggested in Hofmann et al. (2000). The relative energy resolution for individual events has been improved to for a wide range of energies. For energies above 1 TeV, the relative energy resolution is as low as , slightly increasing for lower energies. For the threshold region above 500 GeV, the bias of the energy reconstruction method has been reduced substantially with respect to the conventional methods. The main contribution for this improvement stems from a correction for the position of the shower maximum. Low energy air showers triggering the telescopes tend to penetrate deeper into the atmosphere and therefore are reconstructed at higher energies. This strong bias is overcome and allows for a more reliable energy reconstruction at threshold energies. The reconstruction of the core position has been improved by assuming a point-like source position (Hofmann et al., 1999). The improved energy resolution reduces spill-over effects distorting the reconstructed energy spectrum in the presence of sharp cut-off features in the initial spectrum.
The scaling of individual image widths to the expectation for simulated showers has been modified in order to benefit from the improved core reconstruction. This results in a slightly narrower distribution of the mscw-parameter with respect to the conventional core reconstruction method. We have cross-checked the background subtracted distribution of mscw for strong sources with Monte Carlo predictions and see a very good agreement of the distribution between data and simulation.
| Data selection | Event selection | Image selection |
|---|---|---|
| m | p.e. | |
The complete analysis chain has been tested with data taken on the Crab-Nebula. The results on flux and spectral shape as published in Aharonian et al. (2000) are reproduced. The systematic error on the reconstructed photon index is estimated to increase from in the case of relaxed cuts analysis to for the analysis presented here. However, given the dominating statistical error on low-flux sources, this can be tolerated.
reanalyzed 1999-2000 2002 42.6 217.5 70.8 68.4 median() 73 70.4 309 1095 1447 6425 1/7 1/7 102.3 177.1 2.4 6.1 5.3
1999-2000 2002 E S Flux S Flux ph cm-2 s-1 TeV ph cm-2 s-1 TeV 0.78 122 576 3.78 366 2187 2.75 1.48 86 456 2.29 394 2449 2.16 2.82 42 179 2.75 159 826 3.33 5.37 16 46 2.83 60 226 4.00 10.2 4 12 1.36 7 58 -0.43 (99 % c.l.)
3 Results
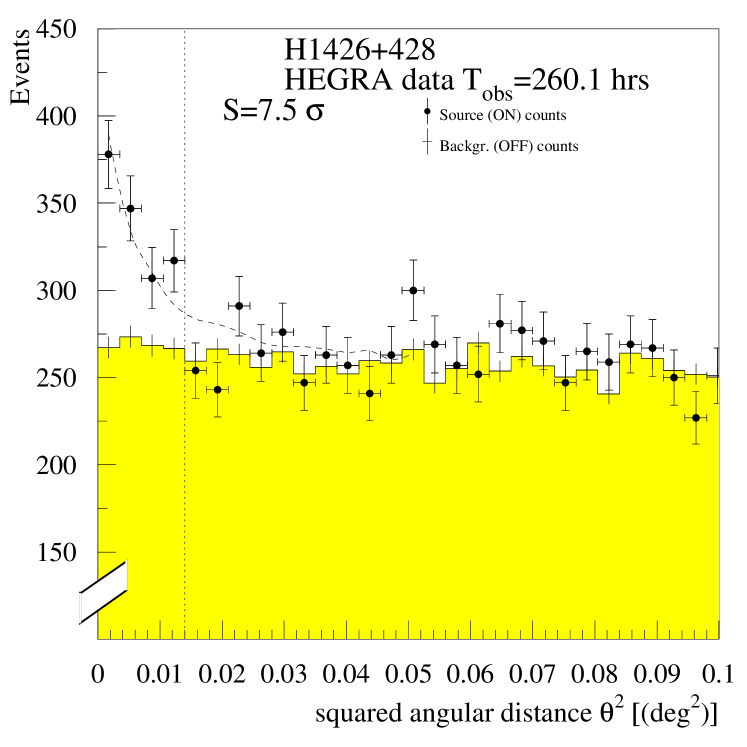
The data taken on H1426+428 in 1999 and 2000 with the HEGRA system of imaging air Cherenkov telescopes have been reanalyzed applying the modified and improved methods described above. The data set has been described in our earlier publication (see Table 1 in Paper I for details on the dates of observations). The signal has been recovered with a slightly higher significance than previously claimed increasing the significance from to . Note, we have not performed a sensitivity-optimized source search. The cuts are chosen to perform a spectral analysis (which includes a constraint on the core distance). The deep exposure of 217.5 hrs in 2002 confirms the object as a -ray emitter with a significance for the signal of (see Table 2). The combined data set with an observation time of hrs results in (see Fig. 1 for the distribution of the arrival directions).
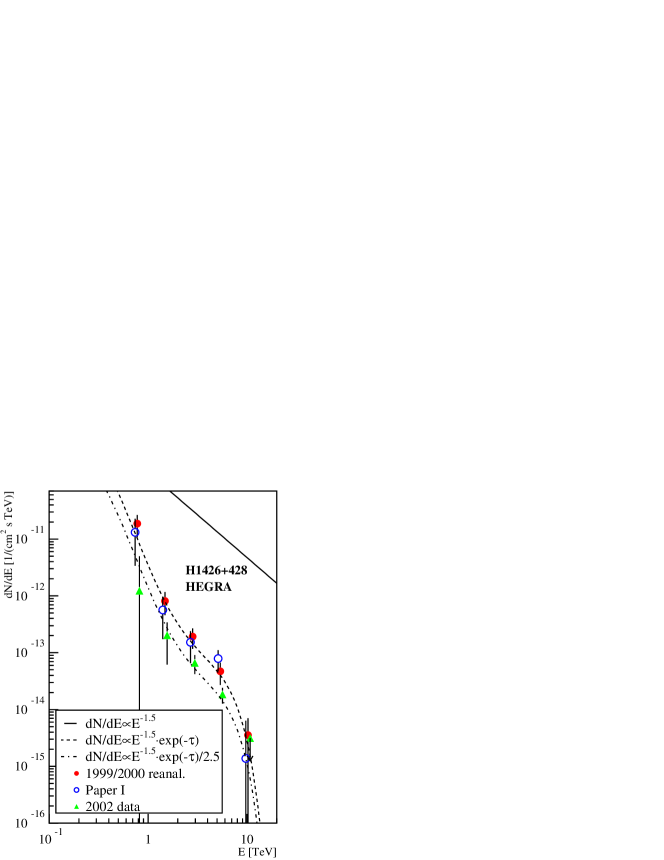
The reconstructed energy spectrum of the reanalyzed data set from 1999/2000 agrees well with the previously published result (see Fig. 2). Given the quite different approach in event selection and reconstruction technique applied in the present analysis, this result demonstrates the negligible influence of systematic effects caused by different analysis techniques.
The recent deep exposure obtained in 2002 shows a decrease in the time-averaged flux by a factor of with comparison to the observations in 1999 and 2000 (see Fig. 2). The decrease in flux observed at high energies is similar to the decrease of the time-averaged X-ray flux as measured by the all-sky-monitor (ASM) on-board the Rossi X-ray timing explorer (RXTE). The average of the daily rates of the ASM provided by the ASM/RXTE team for the nights of HEGRA observations in 1999 and 2000 is counts/sec. For the nights of HEGRA observations in 2002, the X-ray rate as measured by the ASM drops by a factor of 1.7 to counts/sec.

4 Discussion
In order to correct for the effect of absorption of the energetic photons by interactions with the extragalactic background light (EBL) in the near (1-3.5 m, NIR) to mid (4.5-20 m, MIR) infrared, three largely different models for the spectral energy distribution (SED) of the EBL have been used to calculate the opacity .
The calculations of the optical depth performed here apply a cosmological model with a flat cold dark matter (, is the critical density) dominated universe with a non-vanishing cosmological constant () and . Evolutionary effects of the EBL have been neglected except for the expansion of the universe.
The three models are shown in Fig. 3 together with a selection of measurements and limits on the EBL from the ultra violet to the far infrared wavelength bands. The contribution of the far infrared part of the EBL (m) and the cosmic microwave background to the opacity is negligible, but has been included in the calculations of . The model presented by Malkan & Stecker (2001); de Jager & Stecker (2002) (in the following MS01) is based upon a backward-evolution approach with a fast evolving luminosity function between red-shifts 0 and 1.3. For the sake of clarity only one of the two alternative models described in MS01 (fast-evolution model) is used in the following discussion. Both models follow the same shape in the NIR and differ mainly in the absolute level of the radiation (roughly 20 % lower flux in the so-called base-line model with respect to the fast-evolution model).
An alternative model (Primack et al., 2001, in the following Prim01) invokes a semi-analytical approach where the structure formation in a hierarchical scenario is combined with an initial mass function following a Kennicut-type distribution in order to calculate the SED of individual galaxies including realistic dust re-emission models. Following the approach used in Paper I, a simple interpolation of the EBL data (labelled Aha02) has been used as a third alternative.
The measurements and limits on the EBL indicated in Fig. 3 have been taken from Hauser & Dwek (2001) and updated for recent measurements in the NIR (Matsumoto et al., 2000; Cambrésy, Reach, Beichman, & Jarrett, 2001), MIR (Elbaz et al., 2002), and at 60 m (Miville-Deschênes, Lagache, & Puget, 2002), 100, 140, and 240 m (Lagache, Dole, & Puget, 2003). Whereas at m the experimental situation is unclear by a factor of between the different detections (Finkbeiner, Davis, & Schlegel, 2000; Miville-Deschênes, Lagache, & Puget, 2002), the claimed values for m are well consistent with each other.
The opacities have been calculated by integrating over the respective SED whereas for the MS01 model the prescription of the authors as given in de Jager & Stecker (2002) has been used.
The wide energy range from 700 GeV up to 10 TeV covered by the HEGRA energy spectrum of H1426+428 offers the unique opportunity to probe the energy region where the source spectrum is heavily absorbed by pair-production processes on the NIR/MIR part of the EBL.
The lower energy spectra published by the CAT and VERITAS collaboration (Djannati-Ataï et al., 2002; Petry et al., 2002) above an energy threshold of GeV provide additional information on the spectral shape at energies where the absorption effect is of less importance than for energies above 700 GeV that are accessible by the HEGRA instrument. The CAT group has performed a spectral analysis applying a forward-folding technique. The residuals of the reconstructed energy spectrum with respect to the forward-folded power law assumption contain information on possible deviations from a pure power law. The actual data points shown in Fig. 4 are derived by taking the residuals and converting them into differential flux measurements. The caveats of using individual data points are clearly larger errors on the data points and negligence of the correlation of the energy bins which in turn depends on the assumed spectral shape. However, this method allows to compare the CAT measurements with the results of other spectral analysis methods, which suffer from the same caveats.
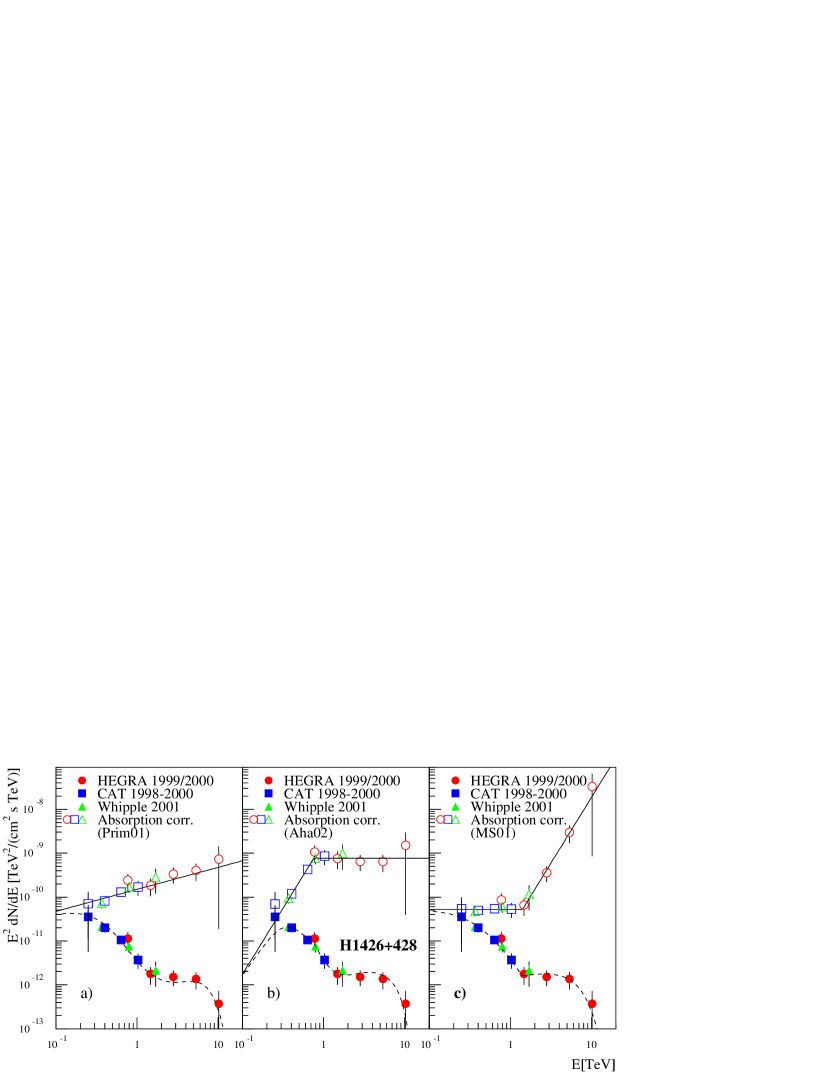
The combined data sets for H1426+428 based upon measurements with the CAT, Whipple, and HEGRA telescopes (reanalyzed 1999-2000 data set) are presented in Fig. 4 a-c. The 2002 data set has not been considered here, because of the lower flux level during that observation. The agreement of the different measurements is very good despite the fact that the observations were not carried out simultaneously. The X-ray flux as measured by the ASM averaged over the individual observational windows for CAT ( cts/sec), Whipple ( cts/sec), and HEGRA ( cts/sec) are in reasonable agreement with each other. The overlap of the HEGRA measurements with the results from Whipple and CAT between 700 GeV to 1 TeV underlines the consistency of the different measurements. The CAT and VERITAS spectra are consistent with each other and no ad hoc normalization is required to combine the different data sets.
After applying a correction to the observed spectrum by multiplying the individual data points by we obtain a source spectrum consistent with a hard power law with a photon index of (see solid and dashed lines in Fig. 4a-c respectively for the source spectrum and the observable spectrum). A -minimization keeping the photon index fixed at results in a . This intrinsic source spectrum would imply a position of the inverse Compton peak in the broad-band SED beyond 10 TeV. The energy flux of the unabsorbed inverse Compton component exceeds erg cm-2 s-1. An initial modeling with leptonic emission models of the broad band SED and specifically the hard source spectrum at TeV energies is possible, but requires an additional external radiation field (Costamante et al., 2003). Given the low X-ray energy flux observed from this source of a few erg cm-2 s-1 during contemporaneous observations, the TeV observations strongly suggest that the -ray flux dominates over the X-ray flux. This would violate the proclaimed BL Lac sequence (Fossati et al., 1998) where the energy flux from the synchrotron radiation is expected to be comparable or to dominate over the inverse Compton energy flux for TeV blazars.
The possibly large photon density of the EBL between -m as suggested in Paper I to accommodate the NIR data by Matsumoto et al. (2000); Cambrésy, Reach, Beichman, & Jarrett (2001) results in a strong absorption for energies below 1 TeV. As a consequence of this, the inferred source spectrum shown in Fig. 4b rises sharply between 0.25 and 0.7 TeV () with a subsequent flattening to a constant value. The inferred source spectrum obtained by taking HEGRA data alone confirms the result as given in Paper I where the spectral shape of the TeV- and X-ray data was tentatively interpreted as self synchrotron-Compton emission. However, the inferred rising lower energy part of the unabsorbed source spectrum is not readily explained by such a model.
In the framework of the MS01 model, the flat slope of the SED of the EBL between the NIR and the MIR produces a rapidly increasing optical depth for energies above 1 TeV, exceeding at 2 TeV. Essentially the same behaviour is seen for the somewhat lower EBL level given by the base-line evolution model. After applying the correction for absorption based upon the MS01 model, the implied source spectrum is consistent with a power law type source spectrum with a photon-index of 2 up to 1 TeV (corresponds to ). Trying to fit the data points beyond 1 TeV with results in a poor . A broken-power law with above 1.4 TeV is a good description of the intrinsic spectrum (. A similar upturn is observed for the base-line evolution model (omitted in Fig. 4 for the sake of clarity).
This implied steep upturn in the corrected source spectrum () is not easily explained by commonly used models invoking either a leptonic or hadronic origin of -ray emission of BL Lac objects. In the case of -ray production from -decay from monoenergetic a type spectrum could be produced. However, even in this extreme case, a steep rise as it is observed here is not explainable (see e.g. Pohl & Schlickeiser (2000)).
A sharper pile-up could be expected by speculating that the radiation is the result of bulk motion Comptonization of ambient low-energy thermal photons by a cold conical wind with bulk Doppler factor exceeding (Aharonian, Timokhin, & Plyasheshnikov, 2002).
In summary, independent of the details of the model for the EBL, the HEGRA observations of H1426+428 between 700 GeV and 10 TeV are strongly affected by absorption of the EBL between m. The possible strong absorption combined with the observable flux at TeV energies implies an intrinsic spectrum which dominates the broad-band SED of H1426+428. This is not in agreement with the conceptual view of the TeV-Blazars being the end-point of a phenomenological sequence where the synchrotron component is comparable or dominates over the Compton component. The position of the putative Compton peak is possibly at energies beyond 10 TeV. As has been shown here, the intrinsic source spectrum strongly depends upon the shape of the SED of the EBL. The different models of the EBL may be excluded by requiring the intrinsic spectrum to be explainable in the framework of conventional source models.
Acknowledgements.
The support of the German ministry for Research and technology BMBF and of the Spanish Research Council CICYT is gratefully acknowledged. We thank the Instituto de Astrofísica de Canarias for the use of the site and for supplying excellent working conditions at La Palma. We gratefully acknowledge the technical support staff of the Heidelberg, Kiel, Munich, and Yerevan Institutes.References
- Aharonian et al. (1999) Aharonian, F. A., Akhperjanian, A.G., Barrio, J.A. et al. 1999, A&A, 349, 11
- Aharonian et al. (2000) Aharonian, F. A., Akhperjanian, A.G., Barrio, J.A. et al. 2000, ApJ, 539, 317
- Aharonian et al. (2002a) Aharonian, F., Akhperjanian, A., Barrio, J. et al. 2002a, A&A, 384, L23
- Aharonian, Timokhin, & Plyasheshnikov (2002) Aharonian, F. A., Timokhin, A. N., & Plyasheshnikov, A. V. 2002, A&A, 384, 834
- Aharonian et al. (2002b) Aharonian, F., Akhperjanian, A., Beilicke, M. et al. 2002b, A&A, 393, 89
- Cambrésy, Reach, Beichman, & Jarrett (2001) Cambrésy, L., Reach, W. T., Beichman, C. A., & Jarrett, T. H. 2001, ApJ, 555, 563
- Costamante et al. (2001) Costamante, L., Ghisellini, G., Giommi P. et al. 2001, A&A, 371, 512
- Costamante et al. (2003) Costamante, L., Aharonian, F., Ghisellini, G., and Horns, D. in Proc. Physics of Relativistic Jets in the CHANDRA and XMM Era, to appear in New Astronomy Review (2003).
- de Jager & Stecker (2002) de Jager, O. C. & Stecker, F. W. 2002, ApJ, 566, 738
- Djannati-Ataï et al. (2002) Djannati-Ataï, A., Khelifi, B., Vorobiov, S. et al. 2002, A&A, 391, L25
- Elbaz et al. (2002) Elbaz, D., Cesarsky, C. J., Chanial, P., Aussel, H., Franceschini, A., Fadda, D., & Chary, R. R. 2002, A&A, 384, 848
- Finkbeiner, Davis, & Schlegel (2000) Finkbeiner, D. P., Davis, M., & Schlegel, D. J. 2000, ApJ, 544, 81
- Fossati et al. (1998) Fossati, G., Maraschi, L., Celotti, A., Comastri, A., & Ghisellini, G. 1998, MNRAS, 299, 433
- Gould & Schréder (1967) Gould, J. & Schréder, G., 1967, PR 155.5, 1404
- Hauser & Dwek (2001) Hauser, M. G. & Dwek, E. 2001, ARA&A, 39, 249
- Hofmann et al. (1999) Hofmann, W., Jung, I., Konopelko, A. et al. 1999, Astroparticle Physics, 12, 135
- Hofmann et al. (2000) Hofmann, W., Lampeitl, H., Konopelko, A., and Krawczynski, H. 2000, Astroparticle Physics 12, 207 (2000)
- Lagache, Dole, & Puget (2003) Lagache, G, Dole, H, and Puget, J.-L. 2003, MNRAS in press., astro-ph/0209115
- Li & Ma (1983) Li, T.-P. & Ma, Y.-Q. 1983, ApJ, 272, 317
- Malkan & Stecker (2001) Malkan, M. A. & Stecker, F. W. 2001, ApJ, 555, 641
- Matsumoto et al. (2000) Matsumoto, T., Cohen, M., Freund, M. M. et al. 2000, in ISO Surveys of a Dusty Universe: Lecture Notes in Physics, 548, 96
- Miville-Deschênes, Lagache, & Puget (2002) Miville-Deschênes, M.-A., Lagache, G., & Puget, J.-L. 2002, A&A, 393, 749
- Nikishov (1962) Nikishov A.I., 1962, Sov. Phys. JETP 14, 393
- Petry et al. (2002) Petry, D., Bond, I.H, Bradbury, S.M. et al. 2002 ApJ, 580, 104
- Pohl & Schlickeiser (2000) Pohl, M. & Schlickeiser, R. 2000, A&A, 354, 395
- Prahl (1999) Prahl, J., Dissertation Univ. Hamburg (1999), http://www-hegra.desy.de/publications/
- Primack et al. (2001) Primack, J. R., Sommerville, R. S., Bullock, J. S., & Devriendt, J. E. G. 2001, in High Energy Gamma-Ray Astronomy: Intern. Symp., AIP Conf. Proc., 558, 463
- Remillard et al. (1989) Remillard, R. A., Tuohy, I. R., Brissenden, R. J. V., Buckley, D. A. H., Schwartz, D. A., Feigelson, E. D., & Tapia, S. 1989, ApJ, 345, 140
- (29) Stecker, F.W., De Jager, O.C., and Salomon, M.H., 1992, ApJ 390L, L49