SN 2002cx: The Most Peculiar Known Type Ia Supernova
Abstract
We present photometric and spectroscopic observations of supernova (SN) 2002cx, which reveal it to be unique among all observed type Ia supernovae (SNe Ia). SN 2002cx exhibits a SN 1991T-like premaximum spectrum, a SN 1991bg-like luminosity, and expansion velocities roughly half those of normal SNe Ia. Photometrically, SN 2002cx has a broad peak in the band and a plateau phase in the band, and slow late-time decline. The color evolution is nearly normal, but the and colors are very red. Early-time spectra of SN 2002cx evolve very quickly and are dominated by lines from Fe-group elements; features from intermediate-mass elements (Ca, S, Si) are weak or absent. Mysterious emission lines are observed around 7000 Å at about 3 weeks after maximum brightness. The nebular spectrum of SN 2002cx is also unique, consisting of narrow iron and cobalt lines. The observations of SN 2002cx are inconsistent with the observed spectral/photometric sequence, and provide a major challenge to our understanding of SNe Ia. No existing theoretical model can successfully explain all observed aspects of SN 2002cx.
1 INTRODUCTION
Observations of Type Ia supernovae (SNe Ia) in the last decade have substantially advanced our understanding of them. Within the current observational scheme of SNe Ia, the majority are the so-called “normal” or “Branch normal” variety (Branch, Fisher, & Nugent 1993), while the others are “peculiar” SNe Ia which can be further divided into SN 1991T-like or SN 1991bg-like objects (see Filippenko 1997, and references therein). Li et al. (2001a) discuss SN 1999aa-like objects as another potential subclass of the peculiar SNe Ia.
Spectroscopically, normal SNe Ia before or near maximum light show conspicuous absorption features near 6150 Å due to Si II, and near 3750 Å due to Ca II, as well as absorption features attributed to Co II, S II, and O I. SN 1991T-like objects (e.g., Filippenko et al. 1992b) before maximum light show unusually weak lines of Si II, S II, and Ca II, yet prominent high-excitation features of Fe III. The usual Si II, S II, and Ca II lines develop in the postmaximum spectra, and by a few weeks past maximum the spectra look nearly normal. SN 1999aa-like objects (Li et al. 2001a) are similar to the SN 1991T-like ones, but with significant Ca II H & K absorption lines in their premaximum spectra. SN 1991bg-like objects (e.g., Filippenko et al. 1992a) near maximum light show a broad absorption trough extending from about 4100 to 4400 Å due to Ti II lines, and enhanced Si II/Ti II 5800 absorption relative to Si II 6150.
Photometrically, normal SNe Ia show a correlation between the peak luminosity and light-curve decline rate. This was first convincingly demonstrated by Phillips (1993), and subsequently exploited by Hamuy et al. (1996a), Riess, Press, & Kirshner (1996), Perlmutter et al. (1997), and Phillips et al. (1999). The slower, broader light curves are intrinsically brighter at peak than the faster, narrower light curves. This trend seems to extend to the peculiar events: SN 1991T-like objects display a slow light-curve evolution compared to normal SNe Ia, and are thought to be more luminous than average, while SN 1991bg-like objects show a fast light-curve evolution, as well as intrinsically red colors at maximum light. The latter are also about 2 mag fainter in the band than normal SNe Ia. In addition, Nugent et al. (1995) demonstrate that the relative strengths of some spectral features correlate with the peak luminosity of SNe Ia, and that the gross spectral variations among all SNe Ia can be accounted for by simply varying the photospheric temperature, suggesting that peculiar events are just the extreme tails of a continuous distribution.
At first glance, it seems that almost all SNe Ia form a sequence that can be described by a single parameter. One such parameter is the decline rate [e.g., , the decline in magnitudes during the first 15 days after the maximum brightness in the band]. Another such parameter is (Si II), the ratio of the depths of two absorption features near 5800 and 6150 Å that are often attributed to Si II 5972 and Si II 6355, respectively (Nugent et al. 1995; note that Garnavich et al. 2002 show that the 5800 Å feature is actually mostly Ti II in low-luminosity SNe Ia). A one-parameter description of SNe Ia is useful, and in the context of Chandrasekhar-mass explosions it can be interpreted in terms of a variation in the mass of ejected radioactive 56Ni.
However, theoretical explosion models of SNe Ia (e.g., Höflich & Khokhlov 1996, hereafter HK96; Höflich et al. 1996) suggest that not all SNe Ia can be put on a one-parameter sequence. Observationally, Hamuy et al. (1996b) show that some light curves with similar decline rates have significant differences in particular details. Also, some SNe Ia with normal-looking spectra (i.e., having only lines of the usual ions) exhibit exceptionally high blueshifts of their absorption features (Branch 1987), and Wells et al. (1994) find no correlation between the blueshift of the Si II 6355 absorption near the time of maximum light and the decline rate in a small sample of well-observed SNe Ia (see also Patat et al. 1996). Hatano et al. (2000) also demonstrate that the spectroscopic diversity among SNe Ia is multi-dimensional.
Perhaps the most disturbing published case for the one-parameter description of SNe Ia is SN 2000cx (Li et al. 2001b). Photometrically, SN 2000cx differs from all known SNe Ia, and its light curves cannot be fit well by the fitting techniques currently available. There is an apparent asymmetry in the -band peak, in which the premaximum brightening is relatively fast (similar to that of the normal SN 1994D), but the postmaximum decline is relatively slow (similar to that of the overluminous SN 1991T). The color evolution of SN 2000cx is also peculiar: the color has a unique plateau phase and the and colors are very blue. SN 2000cx also has a unique spectral evolution. The premaximum spectra of SN 2000cx are similar to those of SN 1991T-like objects, having weak Si II and prominent Fe III lines. The Si II lines emerge near maximum light and stay strong until about three weeks past maximum. The Fe III lines also remain prominent until well after maximum, implying a rather slow change in the excitation stages of the iron-peak elements. The expansion velocities, as derived from the absorption lines of the iron-peak and intermediate-mass element lines, are unusually high.
In this paper we present observations of another bizarre object, SN Ia 2002cx, many of whose properties are the exact opposite of those of SN 2000cx. SN 2002cx was discovered by Wood-Vasey et al. (2002) with the Oschin 1.2-m telescope at Palomar Observatory in unfiltered images taken on 2002 May 12.2 and May 16.2 UT (UT dates are used throughout this paper). Wood-Vasey et al. (2002) measured a precise position for SN 2002cx as = 13h13m49s.72, (equinox J2000.0), which is 18 south and 11 east of the center of its host galaxy CGCG 044-035. An optical spectrum obtained with the Fred Lawrence Whipple Observatory (FLWO) 1.5-m telescope on May 17.2 (Matheson et al. 2002) identified the object as a peculiar SN 1991T-like event at about a week before maximum brightness, but the supernova is underluminous (instead of overluminous) compared with normal SNe Ia. The Si II 6355 and Ca II H & K lines are extremely weak or absent, but the Fe III lines at 4300 Å and 5000 Å are present.
We recognized the uniqueness of SN 2002cx (SN 1991T-like premaximum spectrum, SN 1991bg-like luminosity, and very low expansion velocity) shortly after its discovery, and a follow-up program of multicolor photometry was established at Lick Observatory. Spectra of the SN were obtained with the FLWO 1.5-m telescope and also with the Keck 10-m telescopes. This paper presents the results from this campaign and is organized as follows. Section 2 contains a description of the observations and analysis of the photometry, including our methods of performing photometry, our calibration of the measurements onto the standard Johnson-Cousins system, our resulting multicolor light curves, and our comparisons between the light curves and color curves of SN 2002cx and those of other SNe Ia. Section 3 contains a description of the spectral observations and analysis. We discuss the implications of our observations in §4 and summarize our conclusions in §5.
2 PHOTOMETRY
2.1 Observations and Data Reduction
Broadband images of SN 2002cx were obtained using an Apogee AP7 CCD camera with the 0.76-m Katzman Automatic Imaging Telescope (KAIT; Li et al. 2000; Filippenko et al. 2001) at Lick Observatory. The Apogee camera has a back-illuminated SITe 512512 pixel CCD chip. At the Cassegrain focus of KAIT, the 24 m pixel of the chip yields a scale of 08 pixel-1, making the total field of view of the camera 6. The typical seeing at KAIT is around 3 full width at half maximum (FWHM), so the CCD images are well sampled.
images of SN 2002cx were also obtained using dewar No. 2 with the 1.0-m Nickel telescope at Lick Observatory. The camera with the back-illuminated 20482048 pixel Loral chip was used in a 22 binned mode, yielding a scale of 036 pixel-1 and a total field of view of 6. The typical images have FWHM 2 and thus are also well sampled.
Figure 1 shows a KAIT -band image taken on 2002 May 18 with SN 2002cx and eight local standard stars marked. Absolute calibration of the field was done with KAIT on 2002 June 6 and 11, and with the Nickel telescope on 2002 May 17, June 10, 11, and 12 by observing Landolt (1992) standard stars at different airmasses throughout the photometric nights. Instrumental magnitudes for the standard stars were measured using aperture photometry with the IRAF111IRAF (Image Reduction and Analysis Facility) is distributed by the National Optical Astronomy Observatories, which are operated by the Association of Universities for Research in Astronomy, Inc., under cooperative agreement with the National Science Foundation. DAOPHOT package (Stetson 1987) and then employed to determine transformation coefficients to the standard Johnson-Cousins system. The derived transformation coefficients and color terms were then used to calibrate the sequence of eight local standard stars in the SN 2002cx field. The magnitudes of these eight stars and the associated uncertainties derived by averaging over the photometric nights are listed in Table 1. Notice that the local standard stars have different numbers of calibrations (column 6 in Table 1) because the two telescopes have different total fields of view.
We tried the point-spread-function (PSF) fitting method (Stetson 1987) to perform differential photometry of SN 2002cx relative to the comparison stars, but the results are less than satisfactory. As can be seen in Figure 1, SN 2002cx is contaminated by its host galaxy (especially in the and bands), and the relatively poor resolution of KAIT images together with seeing variations yield fluctuations at the –0.2 mag level in the final light curves (lower panel in Figure 2). The PSF fitting method also overestimates the brightness of SN 2002cx, as a negative residual can be seen at the position of the SN on the processed images with SN 2002cx and the comparison stars subtracted.
The solution for getting precise photometry of SN 2002cx is to obtain template images after the SN fades, and apply galaxy subtraction to remove the galaxy contamination. We have attempted to get these template images with both KAIT and the Nickel telescope (which has better resolution than the KAIT data) when SN 2002cx was 7 months old, but unfortunately, owing to its slow late-time decline (see below for details), it is still faintly visible in these images. Since it will take considerable time for SN 2002cx to fade sufficiently, we have instead employed a pseudo-galaxy-subtraction technique. We chose one Nickel image that has the best seeing (FWHM 1.2–1.5; obtained on 10 July 2002, months past maximum light) in each passband, performed PSF-fitting photometry, and subtracted only the SN from the image. This SN-subtracted image was then used as a template to perform galaxy subtraction on all the remaining KAIT and Nickel images in the same passband.
We have fine-tuned the parameters in PSF fitting so that these “poor-man’s templates” have minimal residuals at the position of the SN. Nevertheless, a very faint negative residual still remains in these “template” images. Although our results therefore systematically overestimate the brightness of SN 2002cx, we consider them to be superior to those measured from the PSF-fitting technique for the following reasons. (1) The galaxy-subtraction technique removes the galaxy contamination, so seeing variations do not significantly affect the photometry. Consequently, the final light curves are much smoother than those from the PSF-fitting technique. (2) As can be seen from the lower panel of Figure 2, the PSF-fitting photometry is usually about 0.1–0.3 mag brighter than the galaxy-subtraction photometry. As the galaxy-subtraction photometry already overestimates the brightness of the SN, the PSF-fitting overestimates the brightness even more. In nights of good seeing (the 1st, 5th, and 6th Nickel observations), both techniques give similar measurements.
For the and bands, we estimate that our galaxy-subtraction technique overestimates the brightness of SN 2002cx by mag around maximum and mag at late times. For the and bands, the overestimate is larger, perhaps mag around maximum and 0.3 mag at late times. In late 2003 or 2004, when SN 2002cx becomes very faint, we plan to obtain genuine template images and derive more accurate, final magnitudes.
The PSF-fitting technique is used on the galaxy-subtracted images to measure the instrumental magnitudes for the SN and the comparison stars, which are then used to obtain the standard Johnson-Cousins magnitudes of SN 2002cx by doing differential photometry. The color terms involved in this transformation are 0.04, 0.04, 0.07, and 0.01 for the KAIT and filters, respectively, while they are 0.08, 0.06, 0.10, and 0.04 for the Nickel and filters, respectively. Our preliminary measurements of SN 2000cx are listed in Table 2. Uncertainties for the measurements were estimated by combining in quadrature the errors given by the photometry routines in DAOPHOT with those introduced by the transformation of instrumental magnitudes onto the standard system. The systematic uncertainty caused by the galaxy subtraction is not considered, and is –0.3 mag as discussed above.
2.2 Optical Light Curves
The upper panel of Figure 2 displays our preliminary light curves of SN 2002cx; final light curves will be derived with genuine templates later. The KAIT data points are shown with open circles and the Nickel ones with solid circles. For most of the points the statistical uncertainties are smaller than the plotted symbols. The overall agreement between the measurements from the two telescopes is excellent. Hence, in all subsequent discussions and figures, the KAIT and the Nickel datasets are combined and discussed together. Also defined here is the variable , which is the time since maximum brightness in the band (JD = 2452415.2; see discussion below).
The date and the magnitude of the peak in each passband are listed in Table 3. For the and bands, these were determined by fitting a second-order spline function to the data points around maximum brightness; for the and bands, there is no well-defined peak and only the magnitude on the broad plateau phase is measured as the peak. Also listed are the and values.
At first glance, some peculiarities of SN 2002cx can be easily discerned from Figure 2. SN 2002cx does not have the typical -band and -band secondary maxima as expected for a SN 1991T-like object; instead, it has a broad peak (or plateau phase) not seen in any other SNe Ia, followed by a slow decline at late times. To facilitate comparisons, we plot in Figure 3 the light curves of SN 2002cx and those of several other well-observed SNe Ia representing the diversity of SN Ia light curves: SN 1991T [; Lira et al. 1998] as an example of an overluminous SN Ia; SN 1994D [; Richmond et al. 1995] as an example of a normal SN Ia; and SN 1991bg [; Filippenko et al. 1992a; Leibundgut et al. 1993] as an example of a subluminous SN Ia. Also included in the comparison are the light curves of SNe 2000cx and 1999ac. SN 2000cx [; Li et al. 2001b] is the opposite of SN 2002cx in many respects, while SN 1999ac [; Li et al. in preparation] is the closest match to SN 2002cx we can find in the literature and in our unpublished photometric database. All light curves are shifted in time and peak magnitude to match those of SN 2002cx with the time zero-point being the date of maximum light in the band.
The -band light curve of SN 2002cx (Fig. 3a) before = 15 d shows a very similar evolution to that of SN 1999ac: their premaximum brightening is faster than SN 1991T, but slower than SNe 1994D and 2000cx. Their postmaximum decline is faster than SNe 1991T and 2000cx, and similar to SN 1994D. In fact, SNe 1994D, 1999ac, and 2002cx have very similar values222Test reductions using the galaxy-subtraction technique with template images obtained when SN 2002cx was 7 months old suggests that of SN 2002cx may be around 1.6 mag, higher than the 1.3 mag reported here. However, the contamination of the SN light in these particular template images is unclear. . As is often considered to be a good indicator of the luminosity of a SN Ia (Phillips 1993; Hamuy et al. 1996a; Phillips et al. 1999), the similar decline rates of the three SNe implies that they should have similar absolute magnitudes. As discussed in §4.2, however, this is not the case: SN 2002cx is less luminous than the other two SNe by as much as 1.4 mag in the band.
After = 15 d, SN 1999ac deviates from SN 1994D and evolves more slowly. SN 2002cx shows the same trend but is more extreme. The data point at = 50 d, though uncertain, suggests that SN 2002cx has the smallest decline among all SNe in the comparison during the first 50 days after the -band maximum brightness.
The -band light curve of SN 2002cx (Fig. 3b) shows a similar evolution to that of SN 1999ac until = 30 d: the premaximum phase of SN 2002cx is not well observed and seems to be consistent with SN 1999ac, SN 1994D, or SN 2000cx. The postmaximum decline of both SN 2002cx and SN 1999ac is faster than SN 1991T, but slower than the other SNe in the comparison. After = 30 d, SN 2002cx shows a dramatic change in its decline rate, and has the smallest late-time decline rate among all the SNe in the comparison.
The -band light curve of SN 2002cx (Fig. 3c) shows a peculiar evolution. The unfiltered magnitudes reported by Wood-Vasey et al. (2002) are plotted here as two open triangles with an arbitrary error bar of mag. These unfiltered magnitudes and the early KAIT data points show that SN 2002cx has the fastest premaximum brightening among all the SNe in the comparison. SN 2002cx also shows quite different evolution than SN 1999ac in the band, despite their similarities in the early and light curves. SN 2002cx does not have a “shoulder” or secondary maximum, but rather a very broad peak extending to 2 weeks after the -band maximum brightness. The subluminous SN 1991bg does not have a secondary maximum either, but it has a much narrower peak around maximum. SN 2002cx also has the slowest late-time decline rate among all the SNe in the comparison.
The -band light curve of SN 2002cx (Fig. 3d) is also peculiar. The two earliest data points suggest that SN 2002cx has a rather steep rise to maximum; it then stays at a nearly constant magnitude until = 20 d (a plateau phase), after which it begins a slow late-time decline phase. Jha (2002) shows that this plateau-like behavior, lasting for about 20 d, could be an extrapolation of a trend seen in -band light curves of subluminous SNe Ia, but the subsequent slow decline remains puzzling.
It is also clear from Figure 3 that the photometric behavior of SN 2002cx and SN 2000cx are often the opposites of each other (e.g., the late-time decline rates, and the evolution around the -band and -band secondary maxima).
In summary, the optical light curves of SN 2002cx differ from those of all known SNe Ia. SN 1999ac seems to bear some similarities to SN 2002cx in the early and light curves, but their and light curves and late-time and evolution are quite different. The broad peak in the band and the plateau phase in the band are puzzling, as are the slow late-time decline. More discussion of the absolute magnitude of SN 2002cx, the -band and -band evolution around the secondary maximum, and the late-time decline rate can be found in §4.
2.3 Optical Color Curves
There are indications that SN 2002cx suffers from little host-galaxy reddening. The premaximum spectra, as discussed in §3.2, are quite blue, an indication of low reddening toward the SN. Moreover, the medium-resolution Keck ESI spectrum of SN 2002cx taken on June 10 showed negligible interstellar Na I D absorption lines at the redshift of the host galaxy. In subsequent discussions, we assume no host-galaxy extinction and use the Galactic reddening of mag (Schlegel, Finkbeiner, & Davis 1998) as the adopted total reddening for SN 2002cx.
In Figure 4 we present the comparison between the intrinsic optical color curves of SN 2002cx [, , and ] and those of several other SNe Ia (1991T, 1991bg, 1994D, 1999ac, and 2000cx). The reddenings adopted for the comparison SNe are = 0.13 mag for SN 1991T (Phillips et al. 1992), 0.05 mag for SN 1991bg (Filippenko et al. 1992a), 0.04 mag for SN 1994D (Richmond et al. 1995), 0.05 mag for SN 1999ac (Li et al. in preparation), and 0.08 mag for SN 2000cx (Li et al. 2001b).
The color curve of SN 2002cx is very similar to that of SN 1999ac. For 20 d, this is a natural result as the two SNe have very similar and light curves. It is somewhat surprising that the late-time point of SN 2002cx at = 50 d is also consistent with SN 1999ac, because the two SNe have different late-time and evolution. However, this data point is quite uncertain, and the slow decline of SN 2002cx in both the and bands may conspire to yield a color similar to that of SN 1999ac.
SN 2002cx has mag at d, and mag at the time of the maximum. These colors are similar to the other SNe in the comparison except SNe 1991bg and 2000cx, both of which are redder. Although SN 2002cx and SN 1991bg have similar absolute magnitudes (see details in §4.2), SN 2002cx is much bluer than SN 1991bg at maximum [ mag for SN 2002cx versus mag for SN 1991bg]. This significant difference in color between the two SNe will be used to constrain their models in §4.7.
Between = 5 and = 20 d, the color curves of SN 2002cx and 1999ac are redder than those of the other SNe in the comparison except SN 1991bg. The late-time colors of SN 1999ac and SN 2002cx are consistent with the “Lira-Phillips law” (Lira 1995; Phillips et al. 1999), though we caution that the late-time color of SN 2002cx is not well observed.
The color evolution of SN 2002cx is peculiar. Before = 5 d, the color of SN 2002cx evolves in a manner similar to that of the other SNe except SN 1991bg, though it may be somewhat redder. Between = 5 and = 17 d, the color of SN 2002cx becomes progressively redder, and it has the second reddest color among all the SNe in the comparison (only SN 1991bg is redder). SN 2002cx does not have the dip at d shown by SNe 1991T, 1994D, and 2000cx. SN 1999ac seems to follow a similar trend, but is less extreme. After = 17 d, SN 2002cx becomes redder until = 25 d, and then maintains nearly the same red color at later times; SN 1991bg, on other hand, becomes progressively bluer at later times. Consequently, SN 2002cx has the reddest color among all the SNe in the comparison after = 20 d. With the exception of SN 1991bg, SN 2002cx and SN 2000cx seem to be at opposite extremes: SN 2002cx has the reddest color while SN 2000cx has the bluest.
SN 2002cx has a red color at all times: it has the second-reddest color before = 25 d (only SN 1991bg is redder), and the reddest color at later times. SN 2002cx does not have the dip at d exhibited by the other SNe (except SN 1991bg). Although SN 1999ac showed some similarities to SN 2002cx (e.g., the early and light curves, the color curves), it has a very different color evolution than SN 2002cx (but similar to that of SNe 1991T and 1994D). The color evolution of SN 2002cx and SN 2000cx also clearly demonstrate that they are opposites: among all the SNe in the comparison (with the exception of SN 1991bg), SN 2002cx has the reddest color while SN 2000cx has the bluest.
In summary, SN 2002cx has a nearly normal evolution, and is quite blue near maximum, but it has red and evolution compared to the other SNe Ia. In §3, we will investigate how the peculiarities in the light curves and color curves of SN 2002cx are correlated with its spectral evolution.
3 SPECTROSCOPY
3.1 General Results
Optical spectra of SN 2002cx were obtained with the FLWO 1.5-m telescope using the FAST spectrograph, and with the Keck 10-m telescopes using the Low Resolution Imaging Spectrometer (LRIS; Oke et al. 1995) and the Echellette Spectrograph and Imager (ESI; Sheinis et al. 2002). The journal of observations is given in Table 4.
All one-dimensional sky-subtracted spectra were extracted optimally in the usual manner. Each spectrum was wavelength and flux calibrated, and corrected for continuum atmospheric extinction and telluric absorption bands (Bessell 1999; Matheson 2000). In general, the position angle of the slit was aligned along the parallactic angle for the observations, so that the spectral shape does not suffer from differential light loss (Filippenko 1982). The LRIS spectrum obtained on day 27 had second-order contamination redward of 7800 Å, so only the unaffected part was used; it was combined with the day 26 spectrum to improve the signal-to-noise ratio.
The spectral evolution of SN 2002cx from = 4 to 56 d is shown in Figure 5. All spectra shown in this paper have been corrected for the redshifts of the host galaxies. For SN 2002cx, a redshift of 7184 km s-1 was adopted from NED333NED (NASA/IPAC Extragalactic Database) is operated by the Jet Propulsion Laboratory, California Institute of Technology, under contract with the National Aeronautics and Space Administration.. A nebular spectrum of SN 2002cx obtained in January 2003 with Keck using LRIS at d will be reported elsewhere.
Our strategy for studying the spectral evolution of SN 2002cx is to use Figure 5 as a guide, and to conduct detailed comparisons between SN 2002cx and other SNe Ia at different epochs in Figures 6 through 9. We have used SN 1994D (Patat et al. 1996; Filippenko 1997) as an example of a normal SN Ia, SN 1997br as an overluminous SN 1991T-like object (Li et al. 1999), and SN 1991bg as a subluminous object (Filippenko et al. 1992a). Also included in the comparison are SN 2000cx (Li et al. 2001b) and SN 1999ac (Li et al. in preparation). Depending on the availability of the observations for each SN, not all SNe are shown in each figure. The line identifications adopted here are taken from Kirshner et al. (1993), Jeffery et al. (1992), Mazzali, Danziger, & Turatto (1995), and Mazzali et al. (1997).
3.2 The Premaximum Phase
The first spectrum of SN 2002cx was obtained with the FLWO 1.5-m telescope on 2002 May 17, 4 days before the -band maximum brightness. Figure 6 shows a comparison of this spectrum with those of other SNe Ia at similar epochs. The spectrum of SN 2002cx is similar to that of SN 1997br: both show a blue continuum, with Fe III 4404 and Fe III 5129 being the two major absorption lines. The small wiggles between 4000 Å and 5000 Å all match up quite well. A weak Si II 6355 line with an asymmetric profile is already present in the spectra of SNe 1997br and 2000cx, but it is not apparent in the spectrum of SN 2002cx. SN 2002cx does not have strong Ca II H & K lines, which suggests that it belongs to the subclass of genuine SN 1991T-like objects, and not to the subclass of SN 1999aa-like objects discussed by Li et al. (2001a).
However, the spectra of SN 2002cx and SN 1997br show a significant difference in the expansion velocities derived (using the special relativistic formula) from the absorption minima of the Fe III lines. As qualitatively indicated by the dotted vertical lines in Figure 6, the Fe III absorption minima of SN 2002cx are at much redder wavelengths than SN 1997br. Quantitatively, the expansion velocities measured from the Fe III lines are 10,400 km s-1 for SN 1997br, while they are only 6,400 km s-1 for SN 2002cx, the lowest expansion velocity ever measured for a SN Ia at such early times. As more fully discussed in § 3.6 and § 4.5, low expansion velocity is a distinct characteristic of SN 2002cx that places strong constraints on the theoretical models and provides clues to its peculiar photometric and spectral evolution.
Mazzali et al. (1995) modeled the early-time spectrum of SN 1991T and suggested that the outer part of the ejecta is dominated by Fe-group elements, which give rise to the Fe III lines in the spectra. They also show that the absence of the Si II and Ca II lines is due mainly to the high envelope temperature, which is caused by the high luminosity of SN 1991T as a direct consequence of overproduction of 56Ni. At times around and after maximum brightness, the abundance of the Fe-group elements drops relative to that of the intermediate mass elements (IME). Consequently, a weak but apparent Si II 6355 line appears in the d spectrum of SN 1991T (Phillips et al. 1992) and in similar events like SN 1997br (Li et al. 1999).
SN 2002cx, however, may have a different premaximum spectral formation mechanism than that of SNe 1991T and 1997br. While the Fe III lines are likely caused by the presence of Fe-group materials in the outer part of the ejecta, the high temperature of the envelope may be caused by a small ejecta mass rather than the overproduction of 56Ni. As discussed in §4.2, SN 2002cx is mag subluminous compared with normal SNe Ia at all optical bands, so it has a rather small 56Ni yield, probably of order . However, this small quantity of 56Ni is distributed in the outer part of the ejecta and heats the small envelope to high temperatures. More arguments for a small ejecta mass in SN 2002cx are discussed in §4.4.
There is also evidence that part of the reason the Si II and Ca II lines are absent in the premaximum spectra of SN 2002cx is the small amount of IME in the ejecta. As discussed later, little IME may have been synthesized in the explosion, a distinct characteristic of SN 2002cx.
The FLWO spectrum of SN 2002cx at d showed very little evolution, compared with the d spectrum (Fig. 5), although the Fe III absorption lines are somewhat deeper.
3.3 Two Weeks after Maximum
Our next two spectra of SN 2002cx were obtained with the FLWO 1.5-m telescope on June 2 and 6, 12 and 16 days after maximum, respectively (Fig. 5). The two spectra show only subtle differences, so we have used the = 12 d spectrum as the representative of the two. The spectrum has undergone a significant change since = 1 d: the continuum is much redder, the Fe III lines are gone, and Fe II lines are prominent. We tried to compare the = 12 d spectrum to that of other SNe Ia at similar epochs, but could not find a good match. A better comparison is achieved when the spectrum is plotted along with other SNe Ia at considerably older ages, such as 3 weeks after maximum (Fig. 7).
Unlike other SNe Ia such as SNe 1997br, 1994D, and 1991bg, SN 2002cx has particularly weak Ca II H & K lines. Other IME features are also weak: no Si II 6355 line can be unambiguously identified, and the Si II/Ti II plus Na I D line at 5700 Å is weaker than in the other SNe Ia. There is no clear evidence for Ti II lines at around 4100–4400 Å as showed by the subluminous SN 1991bg (Filippenko et al. 1992a). Fe II lines, on the other hand, are quite strong: Fe II 4555 and Fe II 5129 form two absorption troughs at the dotted vertical lines in Figure 7, and the Fe II lines at the blue and red wings of Si II 6355 are much stronger than in the other SNe. The closest match to the day 12 spectrum of SN 2002cx is that of SN 1997br at = 21 d (they only differ significantly in the Ca II H & K lines, besides the different expansion velocities). As discussed by Li et al. (1999), SN 1997br also has an earlier transition than SN 1991T to strong Fe II lines.
The extremely fast spectral evolution of SN 2002cx between = 1 d and 12 d is in dramatic contrast to its earlier and later evolution: the spectrum of SN 2002cx does not evolve much between = 4 d and 1 d as discussed above, nor does it between = 12 d and 27 d as seen in Figure 5: the three spectra taken on days 20, 25, 26/27 are almost identical, and even the day 12 and 16 spectra show similar lines, though with a bluer continuum and relatively “washed out” features. The extremely fast spectral evolution of SN 2002cx during the two weeks after maximum brightness suggests that SN 2002cx has very low-mass ejecta. Its photospheric phase is short, and thus it enters the nebular phase quickly.
We also note the apparent differences between SN 2002cx and SN 2000cx (Li et al. 2001b): SN 2000cx has a very slow transition from Fe III to Fe II lines, persistent Si II lines, and high expansion velocities, while SN 2002cx has exactly the opposite characteristics.
3.4 Three Weeks after Maximum
The Keck spectra of SN 2002cx at = 20 d (taken with ESI), and at = 25 and 26/27 d (taken with LRIS), exhibit only subtle differences. Accordingly, we have combined the day 20, 25, and 26/27 spectra to construct a spectrum with a range from 3400 Å to 10000 Å and compared it to the spectra of other SNe Ia in Figure 8. Again, a good comparison can only be achieved when this spectrum of SN 2002cx is plotted against other SNe Ia at older ages. The spectrum is still dominated by strong Fe II lines. This is the first time the spectrum redward of 7400 Å was observed for SN 2002cx, and it shows a much weaker Ca II infrared (IR) triplet compared with the other SNe Ia, consistent with the Ca II H & K line comparison. The O I 7773 line was also observed, with strength comparable to the other SNe Ia. All lines are measured to have much smaller expansion velocities than in the other SNe Ia.
The superb signal-to-noise ratio of the combined Keck spectrum reveals additional peculiarities of SN 2002cx. First, whereas the other SNe show broad emissions, SN 2002cx seems to have the lines split; the emission lines are “double-peaked.” The pairs of vertical lines above the SN 2002cx spectrum indicate apparent double peaks. There are two possible explanations for the cause of these double peaks: (1) they come from a common physical origin, such as the emission from a jet-like configuration, or from rotating clumpy ejecta; or (2) they are simply lines being resolved in SN 2002cx due to its unusually low expansion velocity. However, there is a fatal problem with the first hypothesis: the separations of the two peaks should have the same (or similar) velocity difference if they all come from the same physical origin, so the separation in Å units should increase with increasing wavelength. As can be seen in the upper panel of Figure 8, the separations do not follow this trend and are instead quite randomly distributed. Moreover, the lower panel of Figure 8 shows the = 25 d spectrum of SN 2002cx convolved with a Gaussian function that has = 2500 km s-1; it looks very similar to SN 1997br at = 47 d, and all the double peaks are gone.
As can be seen even in the convolved spectrum, however, there are indications that SN 2002cx may be affected by additional lines (e.g., the region around 7000 Å). In the upper panel of Figure 8, the short vertical lines followed by a “?” below the SN 2002cx spectrum indicate possible additional lines. Some are undoubtedly lines being resolved in SN 2002cx, but the three absorptions and their companion emissions between 6400 Å and 7000 Å do not have any counterparts in the other SNe Ia in the comparison. Figure 9 shows the evolution of this region in greater detail. The three dashed vertical lines mark the approximate central wavelength of the emission component of these mysterious lines. These features are likely caused by additional emissions rather than absorptions, as the SN enters its emission-dominated nebular phase early. The 6600 Å line seems to be present even in the day 12 spectrum. These lines have comparable strength and do not evolve much between = 20 and 27 d, but they all disappear (or become much weaker) in the = 56 d spectrum. One might speculate that the 6600 Å line is H due to their wavelength coincidence, but the lack of other hydrogen Balmer lines in the spectra does not support this identification. Moreover, the similar evolution of these three emission lines strongly suggests that they have the same origin.
In an attempt to identify these lines, we examined the results of Hatano et al. (1999a), who presented optical spectra for 45 individual ions that are candidates for producing identifiable spectral features in SNe. We also consulted a web-based program, “the Atomic Line List v2.04,”444URL http://www.pa.uky.edu/peter/atomic/ where more than 920,000 spectral transitions are compiled. We found several ions having transitions with wavelengths around the marked emissions in Figure 9: C I, Ca I], Fe II, N II, Ni II, and Ti II. Of these, we prefer the Ni II and/or Fe II identification, as there are strong Ni II and Fe II lines in other parts of the spectrum. When the SN becomes more nebular, conditions in the ejecta may favor [Ni II] and [Fe II] lines; thus, the three lines disappear in the spectrum at = 56 d. This suggestion, however, does not explain why the Ni II and Fe II features in the other part of the spectrum do not evolve much between = 26/27 and 56 d. We conclude that detailed spectral modeling is required to reveal the true identity of these lines.
We also note that the = 43 d spectrum of SN 1999ac shows some signs of the “double peaks,” and some low-amplitude wiggles near 6200 Å and 7000 Å, but the overall spectrum looks much more similar to SN 2000cx than to SN 2002cx.
3.5 Two Months after Maximum
Our last spectrum of SN 2002cx was taken on July 16, 56 d after maximum. Figure 10 shows the comparison of this spectrum with that of other SNe Ia at much older ages. The spectrum is clearly in the nebular phase, with emission dominating over absorption. Compared with the other SNe, the features in the spectrum of SN 2002cx are considerably narrower and appear “washed out” — that is, there are no strong emission or absorption lines. The Ca II IR triplet is the strongest line, but it is still much weaker than in the other SNe.
The overall spectrum of SN 2002cx is quite different from that of the other SNe Ia. The short vertical lines above the spectrum of SN 2002cx mark some of the differences between SN 2002cx and SNe 2000cx, 1994D, and 1999ac, all of which have similar nebular spectra. The most significant differences are in the region between 6500 Å and 8500 Å, where SN 2002cx has a flat continuum with weak emissions and weak Ca II IR triplet absorption, while the other three SNe have a strong absorption around 6700 Å, a broad peak near 7300 Å, and strong Ca II IR triplet absorption. There are also apparent differences near 5500 Å.
The short vertical lines below the SN 2002cx spectrum mark some of the differences between SN 2002cx and SN 1991bg. Again, the differences are most significant in the region between 6500 Å and 8500 Å, where SN 1991bg shows a broad absorption around 6700 Å, and a strong emission at 7300 Å. The Ca II IR triplet absorption in SN 1991bg is only slightly stronger than in SN 2002cx, and has a sharp blue wing similar to that of SN 2002cx. The blue wing of the Ca II IR triplet of SNe 2000cx, 1994D, and 1999ac, on the other hand, does not have a sharp edge, and extends to much higher expansion velocities. This suggests that the calcium is probably confined to a stratified region in SN 2002cx and SN 1991bg, and it extends to higher velocities in SNe 2000cx, 1994D, and 1999ac. Another possibility is that there is additional absorption blueward of the Ca II IR triplet in SNe 2000cx, 1994D, and 1999ac.
Figure 11 shows possible identifications of the emission lines in the = 56 d spectrum of SN 2002cx. Whenever possible, the identifications are adopted from the NLTE spectrum synthesis for the nebular spectra of SN 1991bg (Mazzali et al. 1997). Because SN 2002cx shows additional and/or different features than SN 1991bg, we have also included in the identifications the forbidden lines of Fe and Ni listed in the Atomic Line List v2.04. Since our criterion for identifying these additional lines is based purely on wavelength coincidences, the identifications in Figure 11 (especially those marked with a “?”) are only suggestive and should be used with caution. The true line identifications require detailed NLTE spectral synthesis and are beyond the scope of this paper.
Nevertheless, most of the identifications in Figure 10 are adopted from Mazzali et al. (1997), and show that the nebular spectrum of SN 2002cx is dominated by forbidden lines of Fe and Co. The other lines in the spectrum are the Ca II IR triplet, O I 7773, [Ca II] 7292, 7324, and possibly Ca I] 7504. The [Ca II] 7292, 7324 doublet was used by Mazzali et al. (1997) to explain the strong emission around 7300 Å in SN 1991bg (perhaps with contributions from [Fe II] 7155, 7172 and [Ni II] 7380, 7410), and the weakness of this line in SN 2002cx is consistent with the weakness of the other Ca lines, such as the Ca II IR triplet and the Ca II H & K lines.
Since at late times the line-forming region is deep within the ejecta, the dramatic difference between the nebular spectrum of SN 2002cx and those of other SNe Ia indicates that SN 2002cx has quite different composition and/or physical conditions in the interior ejecta (temperature, density, ionization, etc.) than other SNe Ia. As can be seen in Figure 10, even the subluminous SN 1991bg has nebular features that match the normal SN Ia 1994D quite well (though narrower). The peculiar nebular spectrum of SN 2002cx may thus suggest that it comes from a different explosion mechanism than in other SNe Ia, though it could also result from the extreme of one family of explosion models. The fact that SN 1999ac shows some similarities to SN 2002cx is suggestive of the latter hypothesis.
We also note that the spectral range 6500–8500 Å corresponds to the broad and bands, so the peculiar spectral evolution in this region may be related to the unique photometric behavior of the SN in the and bands. In particular, the additional emission near 7000 Å may contribute to the broad peak around maximum and the slow late-time decline in the band, and the lack of strong Ca II IR triplet absorption may contribute to the plateau around maximum and the slow late-time decline in the band. More discussion of the -band and -band light curves can be found in §4.3.
3.6 Expansion Velocities
The expansion velocities (), as inferred from observed minima of absorption lines in the spectra, may provide some clue to the nature of SN Ia explosions (Branch, Drucker, & Jeffery 1988; Khokhlov, Müller, & Höflich 1993). Figure 12 shows the expansion velocities derived from several lines. The SN 2002cx and SN 1999ac data are shown with solid circles and open circles, respectively.
SN 2002cx has the lowest expansion velocities ever reported for a SN Ia. For Fe III 4404, Fe III 5129, Fe II 4555, and the Ca II H & K lines, the measured of SN 2002cx is 6,000 km s-1, only about half that of the other SNe Ia. The evolution is also very flat, implying that the velocity gradient in the ejecta of SN 2002cx is small during the period of spectral observations (4 to 56 d).
No apparent Si II 6355 or S II 5612, 5654 lines are observed in our spectra of SN 2002cx, but the expansion velocity measured from these lines for other SNe Ia are shown in Figure 12 for completeness. Note that SN 1999ac has the lowest measured from S II 5612, 5654 lines among the several SNe Ia shown in Figure 12. The values of of SN 1999ac measured from the Fe II and Fe III lines are also lower than in SNe 1991T and 2000cx, though higher than in SN 2002cx. The similarity of the evolution between SN 2002cx and SN 1999ac is consistent with their similar photometric behavior in the early -band and -band light curves, and suggests that the evolution and the photometric behavior of SNe Ia may be related.
We also see that although SN 1999ac and SN 1991bg have low measured from S II and Si II lines, they have relatively normal and high measured from the Ca II H & K lines. From studies of the spectra of SN 1994D, Hatano et al. (1999b) suggest evidence for the presence of two-component Ca II features, forming in high-velocity (20,000 km s-1) and lower velocity (16,000 km s-1) material. They further postulated that the high-velocity gas might be “primordial” (that is, chemically enriched prior to the explosion), while the lower velocity ejecta might be freshly synthesized in the SN explosion. The lack of high-velocity calcium in SN 2002cx might thus suggest a lack of primordial calcium, although we caution that both components found in SN 1994D are at much higher than in SN 2002cx, so the two SNe may have quite different mechanisms for Ca II line formation. Expansion velocities of SNe Ia are further discussed in §4.5.
In summary, SN 2002cx exhibits unique spectral evolution. The premaximum spectrum is similar to that of SN 1991T and is dominated by high-excitation Fe III lines. The spectrum around maximum evolves very quickly and is dominated by Fe II lines by 2 weeks after maximum. Features from intermediate-mass elements are weak at all times. Mysterious emission lines are seen in the spectral range 6500–8500 Å, whose presence may also affect the photometric behavior of SN 2002cx. The expansion velocities measured from the absorption lines are also extremely low. In the next section, we discuss how the spectral and photometric evolution of SN 2002cx are related, and we explore possible models for this peculiar object.
4 Discussion
4.1 Is SN 2002cx a Type Ia Supernova?
Given the strange observed properties of SN 2002cx, it is legitimate to question whether the SN Ia classification for SN 2002cx is secure. According to the commonly accepted classification criteria of SNe Ia [that is, hydrogen-deficient SNe whose near-maximum spectra show conspicuous absorption features near 6150 Å (due to Si II) and near 3750 Å (due to Ca II), as well as absorption features from S II, O I, Fe II, and Co II], it is uncertain that SN 2002cx is a SN Ia; the Si II (especially Si II 6355) and S II features have not been successfully observed, in part due to our sparse observations and the extremely fast spectral evolution around maximum brightness.
However, we consider the SN Ia classification for SN 2002cx to be secure, because its photometric and spectral evolution can be grossly explained within the paradigm of SN Ia observations (§2 and §3), though with considerable differences. The premaximum spectra resemble those of the peculiar SN Ia 1991T. The spectrum at = 12 d is similar to those of other SNe Ia, though the Fe II lines are more prominent. In addition, the late-time spectra are dominated by emission lines of iron and cobalt, reminiscent of SNe Ia but not of other SN types. Finally, the data suggest that SNe 2002cx and 2000cx may be extreme ends of the same class of objects, and SN 2000cx is clearly a SN Ia.
4.2 Absolute Magnitudes
The host galaxy of SN 2002cx, CGCG 044-035, has a heliocentric radial velocity of 7184 km s-1 as reported in NED (and also confirmed by the narrow emission lines seen in our spectra from H II regions in the host galaxy), so it lies in the Hubble flow and we can use its velocity to derive a reliable distance. Converting to a velocity in the cosmic microwave background (CMB) frame according to the prescription of de Vaucouleurs et al. (1991), we find km s-1.
Adopting the final result from the Hubble Space Telescope (HST) Key Project (Freedman et al. 2001), km s-1 Mpc-1, the distance modulus of SN 2002cx is mag from the derived above; the uncertainty is a combination of the error bar in and a possible peculiar motion of 700 km s-1 for the host galaxy555The host galaxy of SN 2002cx, CGCG 044-035, is in a poor cluster WBL 435 (White et al. 1999) which consists of 6 members. The mean radial velocity of the cluster (with only 3 members have measurements) is km s-1. The rather high peculiar velocity we adopt for CGCG 044-035 (700 km s-1) is about the same as the difference between the measurements of the cluster and CGCG 044-035.. Using the apparent peak magnitudes as listed in Table 3 and our estimate of the reddening, we derive the peak absolute magnitudes for SN 2002cx in all filters (Table 5). The quoted uncertainties are the sums in quadrature of the uncertainties in peak magnitude and distance. For comparison, we also list the absolute magnitudes of SNe 1991T, 2000cx, 1999ac, 1994D, 1991bg, and a “standard” SN Ia with mag (Gibson & Stetson 2001).
It can be seen from Table 5 that SN 2002cx is subluminous: it is mag fainter than the standard SN Ia in the and bands. Compared to SN 1991bg, the least luminous SN Ia known to date, SN 2002cx is brighter by mag in the band, by mag in the band, and is comparable in brightness in the and bands. SN 2002cx, SN 1994D, and SN 1999ac have similar measurements (§2), but SN 2002cx is less luminous than the other two SNe by 1.4 mag in the band, and is also fainter in the other bands.
We explored alternative causes for the faint apparent absolute magnitudes of SN 2002cx (e.g., SN 2002cx occurs in a background galaxy, high reddening for SN 2002cx, huge peculiar radial velocity), but we found that they conflict with the observations in one way or another. We also postulate that SN 2002cx is unlikely to have a normal luminosity, given its peculiar photometric behavior in the and bands and its unique spectral evolution. We thus conclude that SN 2002cx is intrinsically subluminous.
4.3 The -Band and -Band Secondary Maxima
SN 2002cx exhibits peculiar evolution around the -band and -band secondary maxima: there is a broad peak in the band, and a plateau in the band that lasts until the phase at which the secondary maximum of other SNe Ia occurs. In this section we explore possible reasons for this peculiar behavior.
The IR secondary maximum in SNe Ia is explained by Höflich, Khokhlov, & Wheeler (1995; hereafter HKW95) as an effect produced by the effective temperature () and photospheric radius () — if is still increasing well after maximum light and is decreasing slowly, a secondary maximum is formed. A long-term increase of requires high opacity, and hence high temperature in the outer region since the opacity in SNe Ia drops drastically when the temperature falls below 20,000 K (Höflich, Müller, & Khokhlov 1993). The lack of secondary IR maxima in the subluminous SNe Ia (SN 1991bg-like objects) is explained in terms of a receding soon after maximum brightness, which leads to a merging of the “first” and “second” maxima. (However, the models shown by HKW95 only have a secondary maximum in the and redder bands.) In SN 2002cx, the expanding fireball effect is not an attractive explanation for the -band plateau phase: the spectrum evolves rapidly during the first 2 weeks after maximum, probably inconsistent with a nearly constant temperature in the ejecta, and is likely to be decreasing because the spectrum rapidly approaches the nebular phase.
Suntzeff (1995) argues that the secondary maximum in SNe Ia is likely to be caused by an overall redistribution of continuum flux from blue to red, rather than by a few isolated spectral features. This is similar to the explanation of Pinto & Eastman (2000), who suggest that the secondary maximum is an ionization/opacity effect. When the photosphere recedes, the ionization in regions of trapped radiation falls and includes significant amounts of singly ionized species (Ca II, Fe II, Co II) that can emit strongly in the near-IR. This leads to a sharp reduction in the flux mean opacity. The diffusion time is thus reduced, and the residual stored energy is released, leading to the IR secondary peak. (However, these authors do not discuss in detail why this mechanism works for normal and overluminous SNe Ia, but not for subluminous objects.) The ionization/opacity effect is an attractive explanation for the -band evolution of SN 2002cx, and for the comparison with SN 2000cx. The rapid change in the ionization stage (from Fe III to Fe II) in SN 2002cx may result in an early release of the residual stored energy, and thus a merging of the secondary peak with the first one. Consequently, a broad peak in the band and a plateau in the band may occur. In contrast, SN 2000cx has a slow change in the ionization stage (from Fe III to Fe II), and it exhibits a prominent “dip” and strong secondary maximum in the band (Li et al. 2001b).
The peculiar spectral evolution in the range 6500–8500 Å suggests that at least for SN 2002cx, spectral features play some role in the formation of the secondary maximum. In particular, the additional features around 7000 Å may contribute to the broad peak in the band, and the lack of a strong Ca II IR triplet may contribute to the plateau phase in the band.
In summary, the ionization/opacity effect and the spectral feature effect may contribute to the -band and -band evolution around the secondary maximum in SN 2002cx; the fireball effect is not expected to be an important factor. Detailed modeling of both the light-curve shape and the spectral evolution, beyond the scope of this paper, is required to study the relative contributions of different effects.
4.4 The Late-Time Decline Rate
There is evidence that SN 2002cx has a small ejecta mass and small 56Ni production: the rapid initial decline after maximum in the band, the fast spectral evolution after maximum brightness, the early transition to the nebular phase, and the low luminosity. It has been shown from both light curve and spectral modeling (HKW95; Mazzali et al. 2001) that the luminosity of a SN Ia is tightly correlated with the 56Ni produced in the explosion. Thus, SN 2002cx should have synthesized an amount of 56Ni similar to that of SN 1991bg (; Mazzali et al. 1997) because they have similar absolute magnitudes (though SN 2002cx is slightly more luminous).
Assuming the galaxy background does not significanly contaminate the late-time light curves, SN 2002cx has very slow late-time decline rates in all passbands666The slow late-time decline is also confirmed by the recovery of SN 2002cx in images taken at months. We estimate that SN 2002cx has mag at = 214 d, which suggests that it declined at a rate slower than 0.015 mag d-1 in the band. This will be investigated further in the future, when template images devoid of significant SN light are subtracted from the earlier data. At first glance, this seems inconsistent with the small ejecta mass and small 56Ni production inferred above: smaller ejecta mass leads to a shorter diffusion time and a less efficient trapping of the -ray photons from the radioactive decay of 56Ni, and less 56Ni yields a lower temperature and thus reduced mean opacity. Both of these trends produce an atmosphere that cools more rapidly, a photosphere that recedes faster in mass coordinates, and a luminosity that declines faster. However, as suggested by Pinto & Eastman (2002) and HKW95, a very slow expansion velocity (as seen in SN 2002cx) has a countereffect: it results in a smaller escape probability for -ray photons and longer diffusion timescales, and hence slow late-time decline.
The fact that both SN 2002cx and SN 1991bg have small ejecta masses, but the former has slow late-time decline while the latter has fast late-time decline, suggests that the late-time photometric evolution of SN 2002cx may be dominated by the effect, while that of SN 1991bg may be dominated by the ejecta mass effect. Note that SN 2002cx shows a trend that is consistent with SN 2000cx, which has a high and fast late-time decline.
An alternative explanation for the slow late-time decline is the positron transport. As discussed by Milne, The, & Leising (2001), the late-time energy deposition in a SN Ia is dominated by positron transport, which depends on the nature of the magnetic field. One scenario invokes a strong magnetic field that is turbulently disordered such that positrons mirror frequently with no net transport (the trapping scenario; Axelrod 1980). Although Milne et al. suggested that existing late-time observations of a sample of 22 SNe Ia are more consistent with models having substantial positron escape, SN 2002cx may be peculiar and is more consistent with the trapping scenario. We note that for most SNe Ia, however, different positron transport scenarios show significant differences only in late-time decline starting about 300 d after the explosion, considerably later than our observations of SN 2002cx.
4.5 Expansion Velocities
We first note that expansion velocities () inferred from the observed Doppler-shifted absorption lines may not exactly follow the photospheric velocities (), as has been shown in published theoretical models, since the former depend on the abundances as a function of depth, while the latter are affected by the expansion velocity of the ejecta, the density structure, and the composition structure (e.g., the distribution of 56Ni). Since lines are usually formed somewhere above the photosphere, is generally an overestimate of .
There is no reason why and should correlate with 56Ni production and thus with luminosity of SNe Ia (Hatano et al. 2000), since the velocities also depend on other factors such as the density and temperature structure in the ejecta. For instance, SN 2000cx has high but a relatively normal luminosity, while SN 1991T has a normal but is relatively overluminous (Figure 12 and Table 5). However, some combinations of and luminosity seem to be forbidden, at least in the current sample of observed SNe Ia: neither a SN Ia with high and low luminosity nor a SN Ia with low and high luminosity has been observed.
SN 2002cx has the lowest ever measured for a SN Ia, only 50% of that of other SNe Ia. The evolution of is also rather flat (§3). Khokhlov et al. (1993) suggest that the evolution is model dependent (see §4.7 for more discussion of SN Ia models). For example, in detonation and delayed detonation models decreases monotonically, in pulsating delayed detonation and envelope models has a plateau phase after maximum, while in deflagration models has a plateau before maximum and a monotonically decreasing phase after maximum. Although the evolution of SN 2002cx is mostly consistent with the pulsating delayed detonation and envelope models, we emphasize that is different from as discussed above, and that the suggestion of Khokhlov et al. (1993) is based on much higher than those measured in SN 2002cx, so the evolution alone will not single out any model for SN 2002cx. On the other hand, a successful theoretical model for SN 2002cx will need to address the extremely low expansion velocity and its flat evolution.
The fact that both a high event such as SN 2000cx, and a low event such as SN 2002cx, show peculiar photometric behavior suggests that may be a second parameter that demonstrates the diversity of SNe Ia777The color of SNe Ia at maximum has been used as a second parameter to describe the SN Ia family (e.g., Tripp & Branch 1999; Drenkhahn & Richtler 1999), but these methods suffer from the currently poor understanding of the intrinsic colors of SNe Ia and the difficulties of measuring the host-galaxy reddening.. Although the absolute magnitudes and do not seem to be correlated (e.g., Wells et al. 1994; Patat et al. 1996), may indicate other properties of the light curves. For instance, the initial decline rate [] might need to be modified according to the of each SN, so that the decline rate vs. luminosity correlation has a smaller dispersion and can also be applied to events with unusually high or low . The details of the relation between and photometric behavior of SNe Ia will be examined in a future paper.
4.6 SN 2002cx and the Observational Correlations
SN 2002cx is a counterexample to the connection between spectral and photometric behavior of SNe Ia. For example, (1) SNe Ia having SN 1991T-like premaximum spectra are expected to be overluminous, but SN 2002cx has SN 1991T-like spectra and is subluminous; (2) subluminous SNe Ia such as SN 1991bg usually have strong Si II and Ca II lines, but in SN 2002cx these lines are very weak.
SN 2002cx may also be inconsistent with the important luminosity vs. decline rate relation, which is the cornerstone of several empirical luminosity correction techniques such as the method (Phillips 1993; Hamuy et al. 1996a; Phillips et al. 1999), the multicolor light curve shape method (Riess, Press, & Kirshner 1996; Riess et al. 1998; Jha 2002), and the stretch method (Perlmutter et al. 1997). To some extent this does, however, hinge on the result of from the future final photometry using template galaxy subtractions. Assuming the final is not significantly changed, and using mag for SN 2002cx as derived in §2, the prescription of Phillips et al. (1999) for the method, and the absolute magnitudes for a standard SN Ia as listed in Table 5, the expected apparent absolute magnitude for SN 2002cx is mag, and mag, much brighter (by mag) than the actual values of SN 2002cx in Table 5. This inconsistency is also qualitatively shown in §4.2, where it is demonstrated that SN 2002cx, SN 1994D, and SN 1999ac have similar values, but SN 2002cx is fainter by about 1.4 mag in the band than the other two SNe Ia.
So far no other SNe Ia are known with properties similar to those of SN 2002cx, so it may be unique, just as SN 2000cx is unique, but in an opposite way. Fortunately, these two counterexamples to the observed correlations are distinguished by their peculiar expansion velocities, so one is advised to check both the spectral peculiarities and the expansion velocity of a SN Ia before applying the correlations.
4.7 Theoretical Models for SN 2002cx
The observations of SN 2002cx offer the following constraints on its possible progenitors and explosion scenarios. (1) Peculiar photometric evolution, especially in the and bands. (2) Peculiar color evolution: blue color at maximum, red and evolution. (3) Low luminosity at all optical wavelengths. (4) Iron-group elements in the hot outer ejecta. (5) Little production of intermediate-mass elements in the explosion. (6) Small ejecta mass, and rapid transition to the nebular phase. (7) Low expansion velocity and kinetic energy.
Armed with these constraints, we begin our journey in search of a plausible theoretical model for SN 2002cx. There is general agreement that SNe Ia result from thermonuclear explosions of degenerate white dwarfs (WDs; Hoyle & Fowler 1960). Within this broad picture, three explosion scenarios dominate the present considerations. (1) A C-O WD near the Chandrasekhar mass accretes H or He from a binary companion until it reaches a mass at which the central carbon ignites ( WD scenario; Whelan & Iben 1973). (2) Two low-mass WDs in a binary system merge: the smaller, more massive WD accretes material from a disk formed by the total disruption of the less-massive companion and explodes (merging scenario; Webbink 1984; Iben & Tutukov 1984). (3) A low-mass (sub-) C-O WD accretes a He shell, which becomes thick enough to produce a He shell detonation; this, in turn, triggers central carbon ignition (He detonation scenario; Nomoto 1980; Woosley, Weaver, & Taam 1980). Within the WD and the merging scenarios, the description of the propagation of the burning front further divides the models into several groups such as deflagration (Nomoto, Thielemann, & Yokoi 1984), detonation (Arnett 1969), delayed detonation (DD; Khokhlov 1991a), pulsating delayed detonation (PDD; Khokhlov 1991b), and late detonation (Yamaoka et al. 1992).
The merging scenarios were studied by Höflich et al. (1993) and found to be generally consistent with events having slow light-curve evolution such as SN 1991T; thus, they are not viable models for SN 2002cx. However, the variety of these models has not been fully explored, and the final result of a merging configuration (i.e., whether it explodes to produce a SN Ia, or collapses to form a neutron star) is still being debated (e.g., Mochkovitch & Livio 1990; Saio & Nomoto 1998).
The WD scenario is currently the most favored model for SNe Ia (Branch 2001). In particular, the DD and PDD models have been found to reproduce the optical and IR light curves and spectra of SNe Ia reasonably well (Höflich 1995; HKW95; Nugent et al. 1997; Höflich, Wheeler, & Thielemann 1998). In these models, the variation in the parameter () at which the transition is made from deflagration to detonation gives a range of 56Ni mass. Models with smaller give less nickel and hence both lower peak luminosity and lower temperatures. The latter gives lower opacity and hence a steeper decline in the light curve. Within this hypothesis, typical features of subluminous models are the greater production of O, S, and Si compared to SNe Ia of normal luminosity, and 56Ni is constrained to the inner layers with low expansion velocities which become visible a few weeks after maximum light. Höflich et al. (2002) also indicated that strong O I lines are expected in subluminous SNe Ia as a result of massive oxygen layers caused by carbon burning. Although some features of these subluminous models contradict the SN 2002cx observations (e.g., more IME production, centrally distributed 56Ni, and no particularly strong O I lines have been observed in SN 2002cx), our attention was drawn to one of these models, PDD535 (HKW95).
The model PDD535 has a rather small , and it produces only 0.15 M⊙ of 56Ni. The final kinetic energy is only a quarter that of most other models. The average expansion velocity in the ejecta is 4,500 km s-1. This is the only model we found in the literature that has low comparable to that observed in SN 2002cx. This model is also subluminous ( mag), with a risetime of 21.3 d in the band and a color at maximum of 0.6 mag. Thus, the model successfully explains the low luminosity, low , low kinetic energy, and slow late-time decline rates in SN 2002cx. However, its IME production is too large, it does not have Fe-group elements in the outer ejecta, and its color is too red at maximum brightness.
The He detonation scenarios have been investigated by a number of studies. Woosley & Weaver (1994; hereafter WW94) showed that these models synthesize less 56Ni, and have lower kinetic energy, than the WD models. Their models are also subluminous (fainter by mag than a normal SN Ia), though HK96 suggested that He detonations could be as bright as other explosion scenarios. The models studied in WW94 also predict overproduction of 44Ti, which probably contributes to the formation of the Ti II absorption line around 4100–4400 Å observed in the subluminous SN 1991bg888However, Mazzali et al. (1997) showed that the Ti II lines are likely caused by the low temperature in the ejecta rather than a high abundance of 44Ti, since even with the W7 deflagration abundance the synthetic spectrum for SN 1991bg shows strong Ti II lines.. The 56Ni is distributed in the outer shell, and smaller quantities of IME are produced in the explosion than in the WD models.
The He detonations are not considered to be good general models for SNe Ia, as they show either a weak (WW94) or opposite (HK96) decline rate vs. luminosity relation. The decline rate is too fast for normal SNe Ia, and the color at maximum is too blue for subluminous SNe Ia such as SN 1991bg (but perhaps not for SN 2002cx, at least in ). Moreover, both one-dimensional and two-dimensional calculations for these models predict that the Si-rich layers are restricted to velocities smaller than 14,000 km s-1 (WW94; Livne & Arnett 1995; HK96), while observations indicate expansion velocities of Si-rich layers in excess of 20,000 km s-1 (e.g., SN 1990N, Leibundgut et al. 1991; SN 1994D, Höflich 1995).
Nugent et al. (1997) investigated the synthetic spectra of the He detonation models, and suggested that although they bear some resemblance to the subluminous SNe Ia such as SN 1991bg, they don’t have the observed strong UV deficit and they have extremely weak IME features. Helium lines are not prominent in the synthetic spectra near maximum, despite the significant He abundance.
The He detonations are in some respects attractive models for SN 2002cx. The general difficulties of the models to explain subluminous SNe Ia as discussed above (e.g., too blue at maximum, weak IME features, and Fe-group elements in the outer ejecta) do not apply to the observations of SN 2002cx. The most promising model for SN 2002cx that we found in this category is the HeD6 model discussed by HK96, which consists of a 0.6 C-O WD and a 0.17 He layer. The final kinetic energy is about half that of most other models and 0.25 of 56Ni is synthesized in the explosion. The model has , mag at maximum, a risetime of 14.7 days in the band, and mag. The successful aspects of this model for explaining SN 2002cx are as follows: (1) Fe-group elements are distributed in the outer part of the ejecta, (2) blue color at maximum, and (3) no strong IME features in the spectra. On the other hand, detracting from its success, (1) the model still predicts high expansion velocity for Fe-group elements, and generally higher for other elements than those observed in SN 2002cx, (2) the model light curves decline too fast, (3) there are secondary maxima in the and bands, and (4) the model is still too luminous.
Earlier studies of the He detonations (Woosley et al. 1980; Nomoto 1982) suggested the possibility of a faint SN in which only the He layer burned and a white dwarf remained after the explosion (i.e., a “super nova” instead of a real supernova). This was subsequently criticized by Livne (1990) as overlooking the possibility that the ingoing compressional wave might ignite an outwardly propagating carbon detonation at or near the center, which is confirmed by two-dimensional studies by Livne & Glasner (1991). On the other hand, WW94 emphasize that three-dimensional simulations are necessary to study the final outcome of the He detonations. While SN 2002cx may be a peculiar event with only the He layer burned and a white dwarf remaining, light curves and spectral syntheses of this kind of explosion are not yet available for a detailed comparison with our observations.
Nomoto et al. (1995) discussed accretion-induced collapse (AIC) of WDs and suggested that the subluminous SN 1991bg might be produced by AIC after the merging of two WDs. The idea is that the merging of an O-Ne-Mg WD with a C-O WD results in the collapse of the O-Ne-Mg WD and the explosion of the outer C-O envelope with the ejection of of material. However, the ejecta in these models move at much higher expansion velocities (10,000 to 15,000 km s-1) than those observed in SN 2002cx.
We conclude that not a single published theoretical model successfully explains all observed aspects of SN 2002cx. We also note that the dramatic differences between the two subluminous SNe Ia 2002cx and 1991bg (the initial decline rate in the and bands, the evolution around the -band and -band secondary maximum, the late-time decline rates, the premaximum spectra, the Fe III, Si II, Ca II, and Ti II line evolution, the nebular spectra, and the ) suggest that they arise from quite different explosion mechanisms. Since most of the current theoretical studies have been geared toward the explanation of objects like SN 1991bg, it is not surprising that we were unable to find a successful model for SN 2002cx. Additional models and explosion scenarios may need to be constructed to explain the challenge provided by SN 2002cx.
SN 2002cx adds to the diversity already witnessed among SNe Ia. It seems that the observed quantities of SNe Ia (e.g., luminosity, initial decline rate such as , secondary maximum, spectral evolution, and expansion velocity) require the models of SNe Ia to have a range of explosion energy, kinetic energy, envelope mass, and composition structure. While it is possible to vary parameters within one family of explosion models to simulate the majority of SNe Ia, the observations of SN 2002cx suggest that at least for the subluminous end, it is likely that multiple channels are required. Notice that HK96 also concluded that several explosion mechanisms are required to explain the variations among SNe Ia.
5 Conclusions
(1) SN 2002cx is a bizarre object — indeed, unique among all known SNe Ia. It has a premaximum spectrum similar to that of SN 1991T, but a luminosity similar to that of SN 1991bg. The expansion velocity measured from the spectra is the lowest ever recorded for a SN Ia.
(2) The photometric evolution of SN 2002cx is peculiar. In the band it has a decline rate of mag, similar to those of SN 1994D and SN 1999ac, but it is fainter by mag than SN 1994D and SN 1999ac. The band has a very broad peak, and the band has a unique plateau that lasts until about 20 days after maximum. The late-time decline rate is rather slow in all bands. The color evolution is nearly normal, but the and colors are very red.
(3) The premaximum spectrum of SN 2002cx resembles those of SN 1991T-like objects, but with extremely low expansion velocities. The spectral evolution is dominated by Fe-group element lines, with very weak intermediate-mass element features. There are mysterious emission lines near 7000 Å around 3 weeks after maximum brightness. The nebular phase, which was reached quite soon after maximum, is also very different from those of other SNe Ia.
(4) SN 2002cx is inconsistent with the observed spectral vs. photometric sequence, and also quantitatively with the SN Ia decline rate vs. luminosity relation. No existing theoretical model successfully explains all observed aspects of SN 2002cx, though the pulsating delayed detonation of a WD or the He detonation of a sub- WD have some promising characteristics and should be pursued further.
References
- (1) Ajhar, E. A., Tonry, J. L., Blakeslee, J. P., Riess, A. G., & Schmidt, B. P. 2001, ApJ, 559, 584
- (2) Arnett, W. D. 1969, Ap&SS, 5, 280
- (3) Axelrod, T. S. 1980, PhD thesis, Univ. of California, Santa Cruz
- (4) Bessell, M. S. 1999, PASP, 111, 1426
- (5) Branch, D. 1987, ApJ, 316, L81
- (6) Branch, D. 2001, PASP, 113, 169
- (7) Branch, D., Drucker, W., & Jeffery, D. J. 1988, ApJ, 330, L117
- (8) Branch, D., Fisher, A., & Nugent, P. 1993, AJ, 106, 2383
- (9) de Vaucouleurs, G., de Vaucouleurs, A., Corwin, H. G., Jr., Buta, R. J., Paturel, G., & Fouque, P. 1991, Third Reference Catalogue of Bright Galaxies (New York: Springer-Verlag)
- (10) Drenkhahn, G., & Richtler, T. 1999, A&A, 349, 877
- (11) Filippenko, A. V. 1982, PASP, 94, 715
- (12) Filippenko, A. V. 1997, ARAA, 35, 309
- (13) Filippenko, A. V., Li, W. D., Treffers, R. R., & Modjaz, M. 2001, in Small-Telescope Astronomy on Global Scales, ed. W. P. Chen, et al. (San Francisco: ASP), 121
- (14) Filippenko, A. V., et al. 1992a, AJ, 104, 1543
- (15) Filippenko, A. V., et al. 1992b, ApJ, 394, L15
- (16) Freedman, W. L., et al. 2001, ApJ, 553, 47
- (17) Garnavich, P. M., et al. 2002, astro-ph/0105490
- (18) Gibson, B. K., & Stetson, P. B. 2001, ApJ, 547, L103
- (19) Hamuy, M., Phillips, M. M., Schommer, R. A., Suntzeff, N. B., Maza, J., & Avilés R. 1996a, AJ, 112, 2391
- (20) Hamuy, M., Phillips, M. M., Suntzeff, N. B., Schommer, R. A., Maza, J., Smith, R. C., Lira, P., & Avilés, R. 1996b, AJ, 112, 2438
- (21) Hatano, K., Branch, D., Fisher, A., Baron, E., & Filippenko, A. V. 1999b, ApJ, 525, 881
- (22) Hatano, K., Branch, D., Fisher, A., Millard, J., & Baron, E. 1999a, ApJS, 121, 233
- (23) Hatano, K., Branch, D., Lentz, E. J., Baron, E., Filippenko, A. V., & Garnavich, P. M. 2000, ApJ, 543, L49
- (24) Höflich, P. 1995, ApJ, 443, 89
- (25) Höflich, P., Gerardy, C. L., Fesen, R. A., & Sakai, S. 2002, ApJ, 568, 791
- (26) Höflich, P., & Khokhlov, A. 1996, ApJ, 457, 528 (HK96)
- (27) Höflich, P., Khokhlov, A., & Wheeler, J. C. 1995, ApJ, 444, 831 (HKW95)
- (28) Höflich, P., Khokhlov, A., Wheeler, J. C., Phillips, M. M., Suntzeff, N. B., & Hamuy M. 1996, ApJ, 472, L81
- (29) Höflich, P., Müller, E., & Khokhlov, A. 1993, A&A, 268, 570
- (30) Höflich, P., Wheeler, J. C., & Thielemann, F.-K. 1998, ApJ, 495, 617
- (31) Hoyle, P., & Fowler, W. A. 1960, ApJ, 132, 565
- (32) Iben, I., Jr., & Tutukov, A. V. 1984, ApJS, 54, 335
- (33) Jeffery, D. J., Leibundgut, B., Kirshner, R. P., Benetti, S., Branch, D., & Sonneborn, G. 1992, ApJ, 397, 304
- (34) Jha, S. 2002, PhD thesis, Harvard Univ.
- (35) Khokhlov, A. 1991a, A&A, 245, 114
- (36) Khokhlov, A. 1991b, A&A, 245, L25
- (37) Khokhlov, A., Müller, E., & Höflich, P. 1993, A&A, 270, 223
- (38) Kirshner, R. P., et al. 1993, ApJ, 415, 589
- (39) Landolt, A. U. 1992, AJ, 104, 340
- (40) Leibundgut, B., Kirshner, R. P., Filippenko, A. V., Shields, J. C., Foltz, C. B., Phillips, M. M., & Sonneborn, G. 1991, ApJ, 371, L23
- (41) Leibundgut, B., et al. 1993, AJ, 105, 301
- (42) Li, W. D., Filippenko, A. V., Treffers, R. R., Riess, A. G., Hu, J. Y., & Qiu, Y. L. 2001a, ApJ, 546, 734
- (43) Li, W. D., et al. 1999, AJ, 117, 2709
- (44) Li, W. D., et al. 2000, in Cosmic Explosions, ed. S. S. Holt & W. W. Zhang (New York: AIP), 103
- (45) Li, W. D., et al. 2001b, PASP, 113, 1178
- (46) Lira, P. 1995, Masters thesis, Univ. Chile
- (47) Lira, P., et al. 1998, AJ, 115, 234
- (48) Livne, P. 1990, ApJ, 354, L53
- (49) Livne, E., & Arnett, D. 1995, ApJ, 452, 62
- (50) Livne, P., & Glasner, A. S. 1991, ApJ, 370, 272
- (51) Matheson, T. 2000, PhD thesis, Univ. of California, Berkeley
- (52) Matheson, T., Jha, S., Challis, P., Kirshner, P., & Berlind, P. 2002, IAU Circ. 7903
- (53) Mazzali, P. A., Danziger, I. J., & Turatto, M. 1995, A&A, 297, 509
- (54) Mazzali, P. A., Chugai, N., Turatto, M., Lucy, L. B., Danziger, I. J., Cappellaro, E., Della Valle, M., & Benetti, S. 1997, MNRAS, 284, 151
- (55) Mazzali, P. A., Nomoto, K., Cappellaro, E., Nakamura, T., Umeda, H., & Iwamoto, K. 2001, ApJ, 547, 988
- (56) Milne, P. A., The, L.-S., & Leising, M. D. 2001, ApJ, 559, 1019
- (57) Mochkovitch, R., & Livio, M. 1990, A&A, 236, 378
- (58) Nomoto, K. 1980, in IAU Symp. 93, Fundamental Problems in Theory of Stellar Evolution, ed. D. Sugimoto, D. G. Lamb, & D. Schramm (Dordrecht: Reidel), 295
- (59) Nomoto, K. 1982, ApJ, 257, 780
- (60) Nomoto, K., Iwamoto, K., Yamaoka, H., & Hashimoto, M. 1995, in Millisecond Pulsars: A Decade of Surprise, ed. A. S. Fruchter, M. Tavani, & D. C. Backer (San Francisco: ASP, Conf. Ser. Vol. 72), 164
- (61) Nomoto, K., Thielemann, F.-K., & Yokoi, K. 1984, ApJ, 286, 644
- (62) Nugent, P., Baron, E., Branch, D., Fisher, A., & Hauschildt, P. 1997, ApJ, 485, 812
- (63) Nugent, P., Phillips, M. M., Baron, E., Branch, D., & Hauschildt, P. 1995, ApJ, 455, L147
- (64) Oke, J. B., et al. 1995, PASP, 107, 375
- (65) Patat, F., Benetti, S., Cappellaro, E., Danziger, I. J., Della Valle, M., Mazzali, P. A., & Turatto, M. 1996, MNRAS, 278, 111
- (66) Perlmutter, S., et al. 1997, ApJ, 483, 565
- (67) Phillips, M. M. 1993, ApJ, 413, L105
- (68) Phillips, M. M., Lira, P., Suntzeff, N. B., Schommer, R. A., Hamuy, M., & Maza, J. 1999, AJ, 118, 1766
- (69) Phillips, M. M., Wells, L. A., Suntzeff, N. B., Hamuy, M., Leibundgut, B., Kirshner, R. P., & Foltz, C. B. 1992, AJ, 103, 1632
- (70) Pinto, P. A., & Eastman, R. G. 2000, ApJ, 530, 757
- (71) Pinto, P. A., & Eastman, R. G. 2002, New Astronomy, 6, 307
- (72) Richmond, M. W., et al. 1995, AJ, 109, 2121
- (73) Riess, A. G., Press, W. H., & Kirshner, R. P. 1996, ApJ, 473, 88
- (74) Riess, A. G., et al. 1998, AJ, 116, 1009
- (75) Saha, A., Sandage, A., Tammann, G. A., Dolphin, A. E., Christensen, J., Panagia, N., & Macchetto, F. D. 2001, ApJ, 562, 314
- (76) Saio, H., & Nomoto, K. 1998, ApJ, 500, 388
- (77) Sheinis, A. I., et al. 2002, PASP, 114, 798
- (78) Schlegel, D. J., Finkbeiner, D. P., & Davis, M. 1998, ApJ, 500, 525
- (79) Stetson, P. B. 1987, PASP, 99, 191
- (80) Suntzeff, N. B. 1995, in Supernovae and Supernova Remnants, ed. R. A. McCray, Z. Wang, & Z. Li (Cambridge: Cambridge Univ. Press), 41
- (81) Tonry, J. L., Blakeslee, J. P., Ajhar, E. A., & Dressler, A. 2000, ApJ, 530, 625
- (82) Tripp, R., & Branch, D. 1999, ApJ, 525, 209
- (83) Turatto, M., Benetti, S., Cappellaro, E., Danziger, I. J., Della Valle, M., Gouiffes, C., Mazzali, P. A., & Patat, F. 1996, MNRAS, 283, 1
- (84) Webbink, R. F. 1984, ApJ, 277, 355
- (85) Wells, L. A., et al. 1994, AJ, 108, 2233
- (86) Whelan, J., & Iben, I., Jr. 1973, ApJ, 186, 1007
- (87) White, R. A., Bliton, M., Bhavsar, S. P., Bornmann, P., Burns, J. O., Ledlow, M. J., & Loken, C. 1999, AJ, 118, 2014
- (88) Wood-Vasey, W. M., Aldering, G., Nugent, P., Helin, E. F., Pravdo, S., Hicks, M., & Lawrence, K. 2002, IAU Circ. 7902
- (89) Woosley, S. E., & Weaver, T. A. 1994, ApJ, 423, 371 (WW94)
- (90) Woosley, S. E., Weaver, T. A., & Taam, R. E. 1980, in Type I Supernovae, ed. J. C. Wheeler (Austin: Univ. of Texas Press), 96
- (91) Yamaoka, H., Nomoto, K., Shigeyama, T., & Thielemann, F.-K. 1992, ApJ, 393, 55
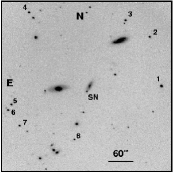
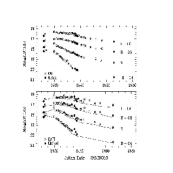
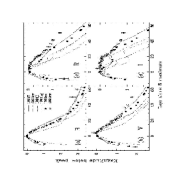
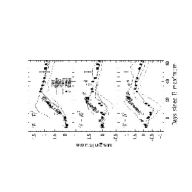
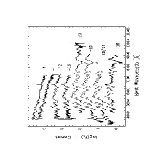
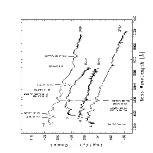
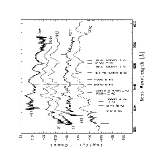
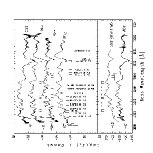
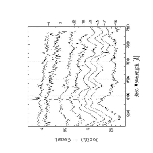
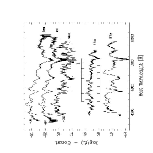
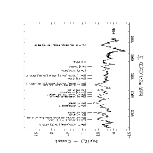
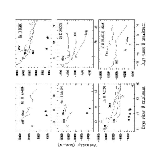
| ID | |||||
|---|---|---|---|---|---|
| 1 | 15.467(06) | 0.635(30) | 0.410(08) | 0.807(30) | 2 |
| 2 | 17.254(26) | 0.608(33) | 0.374(30) | 0.744(36) | 3 |
| 3 | 16.332(23) | 0.523(40) | 0.338(20) | 0.663(12) | 2 |
| 4 | 16.503(15) | 0.509(40) | 0.376(07) | 0.734(08) | 2 |
| 5 | 16.788(34) | 0.586(20) | 0.362(17) | 0.755(37) | 6 |
| 6 | 17.026(40) | 0.796(21) | 0.499(09) | 0.967(35) | 6 |
| 7 | 17.109(36) | 0.658(13) | 0.407(18) | 0.819(45) | 6 |
| 8 | 17.901(39) | 1.166(62) | 0.831(17) | 1.528(55) | 6 |
| JD | Tel. | ||||
|---|---|---|---|---|---|
| 2450000 | (mag) | (mag) | (mag) | (mag) | |
| 2411.78 | 17.81(03) | 17.81(03) | 17.70(02) | 17.70(04) | Nickel |
| 2412.78 | 17.77(03) | 17.73(04) | 17.64(04) | 17.53(04) | KAIT |
| 2413.81 | 17.69(04) | KAIT | |||
| 2419.81 | 17.85(12) | 17.45(10) | 17.53(07) | 17.30(08) | KAIT |
| 2421.77 | 18.06(05) | 17.69(04) | 17.48(03) | 17.39(04) | KAIT |
| 2422.75 | 18.10(09) | 17.70(03) | 17.50(03) | 17.40(03) | KAIT |
| 2423.73 | 18.22(03) | 17.80(03) | 17.47(02) | 17.42(03) | KAIT |
| 2424.75 | 18.35(04) | 17.82(03) | 17.53(03) | 17.38(03) | KAIT |
| 2425.76 | 18.47(06) | 17.87(06) | 17.53(05) | 17.42(06) | KAIT |
| 2426.72 | 18.61(04) | 17.88(03) | 17.54(04) | 17.37(03) | KAIT |
| 2427.72 | 18.68(05) | 17.99(04) | 17.54(03) | 17.40(04) | KAIT |
| 2428.76 | 18.83(04) | 18.05(04) | 17.61(03) | 17.46(04) | KAIT |
| 2429.75 | 18.73(10) | 18.16(03) | 17.61(03) | 17.45(03) | KAIT |
| 2430.71 | 19.02(04) | 18.20(04) | 17.69(03) | 17.50(03) | KAIT |
| 2431.78 | 19.12(04) | 18.27(04) | 17.71(04) | 17.44(04) | KAIT |
| 2432.69 | 19.24(07) | 18.34(03) | 17.73(03) | 17.46(05) | KAIT |
| 2433.74 | 19.45(08) | 18.36(04) | 17.80(04) | 17.40(05) | Nickel |
| 2434.70 | 18.31(07) | 17.75(07) | 17.52(07) | KAIT | |
| 2435.70 | 18.45(06) | 17.84(04) | 17.67(05) | KAIT | |
| 2435.75 | 19.49(08) | 18.46(03) | 17.89(03) | 17.47(06) | Nickel |
| 2436.75 | 18.52(05) | 17.89(05) | 17.60(04) | KAIT | |
| 2436.77 | 19.61(08) | 18.54(03) | 17.93(02) | 17.64(03) | Nickel |
| 2437.69 | 18.57(04) | 17.99(03) | 17.64(06) | KAIT | |
| 2437.70 | 19.65(06) | 18.59(02) | 17.97(02) | 17.71(02) | Nickel |
| 2438.73 | 18.66(05) | 17.66(05) | KAIT | ||
| 2440.69 | 18.75(06) | 18.07(04) | 17.82(05) | KAIT | |
| 2442.69 | 18.81(04) | 18.11(04) | 17.84(05) | KAIT | |
| 2443.73 | 18.19(06) | 17.90(06) | KAIT | ||
| 2447.70 | 18.30(08) | 17.97(08) | KAIT | ||
| 2451.74 | 18.94(07) | 18.40(08) | 18.06(05) | KAIT | |
| 2455.70 | 19.11(05) | 18.45(04) | 18.16(04) | KAIT | |
| 2456.70 | 18.45(07) | 18.17(04) | KAIT | ||
| 2465.70 | 20.36(21) | 19.33(07) | 18.75(06) | 18.27(08) | Nickel |
| Filter | ||||
|---|---|---|---|---|
| UT of max. | May 20.7 1.0 | May 23.0 1.0 | ||
| Julian Date of max. | 2452415.2 1.0 | 2452417.5 1.0 | ||
| Magnitude at max. | 17.68 0.10 | 17.57 0.15 | 17.50 0.10 | 17.40 0.10 |
| (mag) | 1.29 0.11 | 0.73 0.16 |
| UT Date | aaDays since maximum brightness (JD = 2452415.2), rounded to the nearest day. | Tel. b bfootnotemark: | RangeccObserved wavelength range of spectrum. | Air.ddAverage airmass of observations. | Slit | Exp. | ObservereeCF = C. Fassnacht; EB = E. Berger; GS1 = G. Smith; GS2 = G. Squires; MC = M. Calkins; PB = P. Berlind; RS = R. Simcoe; SK = S. Kulkarni; WS = W. Sargent. |
|---|---|---|---|---|---|---|---|
| (day) | (Å) | (arcsec) | (s) | ||||
| 2002-05-17 | 4 | F1 | 3600–7400 | 1.1 | 3.0 | 2400 | PB |
| 2002-05-20 | 1 | F1 | 3600–7400 | 1.1 | 3.0 | 1200 | MC |
| 2002-06-02 | +12 | F1 | 3600–7400 | 1.1 | 3.0 | 2400 | MC |
| 2002-06-06 | +16 | F1 | 3720–7500 | 1.1 | 3.0 | 2400 | PB |
| 2002-06-10 | +20 | K2 | 4000–10300 | 1.0 | 0.75 | 1200 | WS, RS |
| 2002-06-15 | +25 | K1 | 3260–9340 | 1.0 | 1.0 | 900 | EB, SK |
| 2002-06-16 | +26 | K1 | 3200–5800ffThis spectrum is combined with the +27 d spectrum and discussed together. | 1.1 | 1.0 | 1800 | GS1 |
| 2002-06-17 | +27 | K1 | 5470–9230ggOnly the spectrum in the range 54707800 Å is used in this study; the region redward of 7800 Å has second-order contamination. | 1.1 | 1.0 | 600 | GS1 |
| 2002-07-16 | +56 | K1 | 4300–9260 | 1.3 | 1.0 | 1200 | CF,GS2 |
| SN | source, note | |||||
|---|---|---|---|---|---|---|
| 1991T | 0.95(05) | 1,b | ||||
| 2000cx | 0.93(04) | 2,c | ||||
| 1999ac | 1.30(09) | 3,d | ||||
| 1994D | 1.31(08) | 4,e | ||||
| 2002cx | 1.29(11)ffThe final, future photometry using galaxy template subtraction may yield higher 1.6 mag, see § 2.2 for details. | 5,d | ||||
| 1991bg | 1.94(08) | 6,e | ||||
| standard | 1.10 | 1,g |
References. — (1) Gibson & Stetson 2001; (2) Li et al. 2001b; (3) Li et al. in preparation; (4) Richmond et al. 1995; (5) this paper; (6) Turatto et al. 1996.