Simultaneous Chandra and RXTE observations of the nearby bright Seyfert 2 galaxy NGC 4945
Abstract
We analyze recent simultaneous Chandra/RXTE observations of the Seyfert 2 galaxy NGC 4945. The unprecedented spatial resolution of Chandra means we are able to separate the spectra of the nucleus, starburst and superwind regions, while the RXTE data extend the spectrum to higher energies. The extreme absorbing column of cm-2 means that the nucleus is only seen directly above 8–10 keV, while the lower energy spectrum from the nuclear region in Chandra is dominated by reflection. By contrast, the superwind is dominated by emission from hot plasma, but the starburst region contains both hot plasma and reflection signatures. To form a reflected spectrum requires that the starburst region contains clumps of cool, optically thick material, perhaps star forming cores, which are irradiated by 7–10 keV photons from the nucleus. Since photons of this energy are obscured along the line sight then this confirms the result of Madejski et al. (2000) that the extreme absorbtion material is disk-like rather than a torus. However, the IR/optical limits on the lack of high excitation emission lines show that by contrast the lower energy photons from the nucleus are obscured in all directions. We discuss the complex absorption structure revealed by these observations, and propose an an overall source geometry in which the nucleus is completely embedded in material with cm-2
1. Introduction
Our best current picture of Seyfert 2 galaxies relies on the Unified Scheme, where all the main ingredients of the nucleus – black hole, accretion disc and broad line region – are identical in all active galaxies, but the classification depends on the orientation with respect to the line of sight. There is a small scale, geometrically thin accretion disk around the black hole, while at distances larger than 1 pc there is a geometrically thick molecular torus. The material in the disk and torus provides intrinsic obscuration, such that for the viewing directions intersecting the disk and/or torus, the intrinsic emission of the AGN is modified by the absorbing material. In particular, the light from the broad optical / UV emission lines is obscured by dust, while photoelectric absorption by gas and dust gives a low energy cutoff in the soft X–ray emission. The magnitude of the absorption depends on the column density of material in the line of sight. For columns of cm-2 the central engine can be completely obscured, though some small fraction of the intrinsic nuclear light can be seen as a result of electron scattering by low density, ionized gas; this gas would be located around the axis of symmetry of the system, both within the torus and in a form of a wind emanating from the nucleus.
Such a picture is broadly consistent with a range of observed optical, X–ray, radio and polarization properties of Seyfert 1 and 2 galaxies (see e.g. the review by Veron-Cetty & Veron 2000), but these data are generally indirect as they do not resolve any of the structures proposed. One of the nearest AGN of any kind – and thus the most appropriate for a detailed study of the spatial structure to test these Unified models – is the nearby (3.7 Mpc; Mauersberger et al. 1996) Seyfert 2 galaxy NGC 4945. Spatial studies are further aided by the strong absorption, with an equivalent hydrogen column density of cm-2 (Iwasawa et al. 1993; Done, Madejski, & Smith 1996; Madejski et al. 2000), corresponding to of . With this column, the nuclear X-ray flux at energies corresponding to the Fe L and K lines is entirely absorbed, so the measured line fluxes originate in the scatterer or in the obscuring medium, yet above keV, the nuclear power law dominates the spectrum. In fact, it is the brightest Seyfert 2 galaxy above 20 keV, as measured by OSSE (Done, Madejski, & Smith 1996), RXTE (Madejski et al. 2000), and BeppoSAX (Guainazzi et al. 2000). The hard X-ray emission is rapidly variable, on time scales of a day or less, implying that the Thomson-thick absorption is probably confined to a structure which is geometrically rather thin, i.e. more probably associated with the disk rather than the torus (Madejski et al. 2000). Importantly, NGC 4945 is an H2O megamaser source (Dos Santos & Lepine 1979), which traces underlying cool, dense molecular structures probably within pc of the central engine. Unlike NGC 4258, this emission does not give the smooth rotation curve expected from a well ordered disk, but assuming this irregular, clumpy distribution still traces orbital motion gives an estimate of the central mass of M⊙ (Greenhill, Moran, & Herrnstein 1997). Knowing the intrinsic X–ray luminosity and the mass of the central source allows an estimate of the accretion rate in Eddington units of 10% (Greenhill et al. 1997; Madejski et al. 2000), and aids in detailed dynamical studies of the source.
The ionized material filling the opening of the torus also emits recombination line and continuum radiation, generally resulting in strong Fe L and K lines (Krolik & Kallman 1987; Band et al. 1990). However, despite this theoretical work there is comparatively little known about the scattering region in Seyfert 2s. This is mainly due to spatial confusion, as Seyfert nuclei often co–exist with nuclear starbursts/superwind activity, and these contribute to the soft X–ray emission and Fe L lines. This is certainly the case for NGC 4945 (Heckman, Armus, & Miley 1990; Nakai 1989). To disentangle the effects of the scattering region from the starburst and superwind, we need high spatial resolution, provided by the superior angular resolution available with Chandra.
In this Paper, we report on the Chandra imaging observations of the nuclear region of NGC 4945. These have already been published by Schurch, Roberts & Warwick (2002), but here we do a much more detailed spatially resolved analysis. We also include simultaneous data from RXTE in order to constrain the direct nuclear spectrum, and present a plausible interpretation regarding the geometry of the source which fits with both the IR/optical and X-ray constraints.
2. Observations
2.1. Chandra
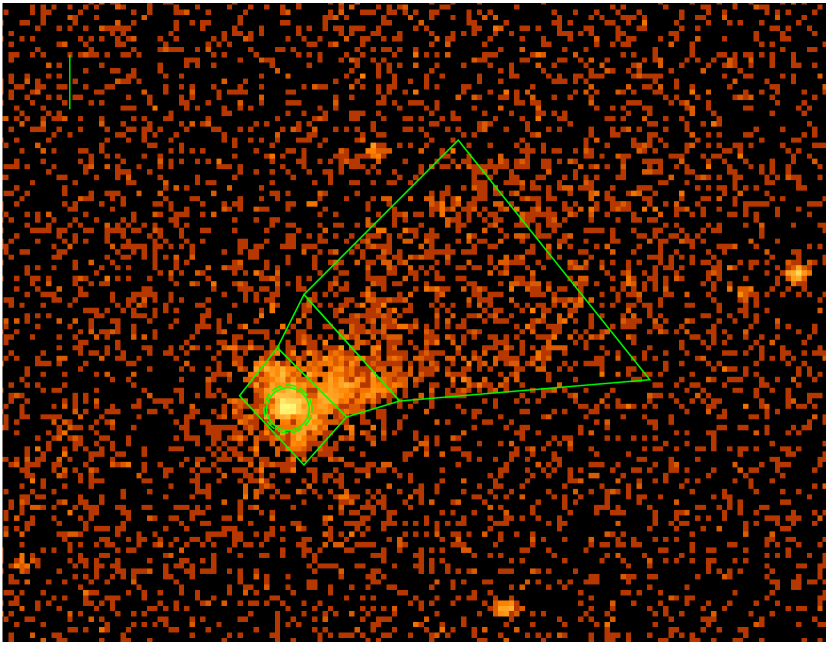
TheChandra data were taken on 27 - 28th January 2000 with the ACIS camera in the faint mode for a total of 49 ks, with the nucleus focussed on the S3 chip. The filtered file produced by standard processing was further cleaned by running the software tool acisscreen and gain corrected using acisgaincorr. These cleaned data from the chip S3 were screened to reject periods of high background (defined as times at which the total count rate of events labelled as valid was greater than 20 counts per second), and the resulting image of NGC 4945 with exposure of 38 ks is shown in Fig. 1. The image clearly shows a point-like emission coincident with the megamaser source, and diffuse “plume” extending roughly in the NW direction from the nucleus, which is perpendicular to the plane defined by the megamaser emission of the galaxy, which in turn is closely aligned with the plane of the host galaxy. We perform spectral analysis of various regions of that image separately as described below.
The nuclear spectrum (hereafter called nuc) was extracted from a circle of radius 4 pixels (2 arcsec) centered on the brightest spot. The nearby diffuse emission was taken from a box surrounding this region, excluding a circle of radius 4.5 pixels centered on the nucleus (hereafter called diff-nuc). Further diffuse emission spectra were taken from two regions shown overlaid on Fig. 1, hereafter called diff-1 and diff-2. A background spectrum was taken from a nearby, source free region. The response and auxiliary files were created for the nuclear region using acismakermf, acisarfprep and mkarf, and these files were used for all spectra. For the subsequent analysis, we grouped all extracted spectra such that there were at least 20 total counts per new bin.
2.2. RXTE PCA and HEXTE
The simultaneous RXTE data were extracted using the rex script, with the Epoch 4 faint source background models. This resulted in a total of 60 ks of PCA data from layer 1, detectors 0 and 2. As in the previous RXTE observations of this object, the source counting rate is rather modest, with source counts being less than 10 per cent of background.
We know from previous observations that the nucleus of NGC 4945 is a relatively hard X-ray source, where the primary, nuclear emission can be well described as a heavily absorbed power law. Since we are mainly interested in the RXTE PCA data regarding the nuclear component, we present the PCA lightcurve in the 8–30 keV band (channels 19 - 69) in Fig. 2, with contiguous orbits giving even sampling of the lightcurves on timescales of a few thousand seconds, spanning a total of days. This extends the variability seen in the previous monitoring campaign, which had single orbit snapshots once per day for months (Madejski et al. 2000). Plainly there is considerable variability power in this object on timescales shorter than 1 day.
The HEXTE data from clusters 0 and 1 were also extracted with the rex script, and here the background is even more dominant. Nonetheless, the variability seen in the PCA and HEXTE are consistent with each other (Figure 3). Since the method of background estimation is very different in the PCA (blank field predictions) and HEXTE (offset pointings) then this shows that the majority of the variability seen is indeed connected to the source rather than to background uncertainties. We use the HEXTE data from 20–100 keV, and allow for a normalisation offset between this and the PCA.
3. Nuclear Spectrum
3.1. Chandra
The superb imaging capabilities of Chandra allow an extraction of the spectrum from the nuclear source alone. This is shown in Fig 4 and is clearly dominated by iron K line emission, but also includes a hard broad-band continuum. We fit this with an absorbed power law and iron line and find that the nuclear continuum is indeed extremely hard, with , and that the (narrow, fixed at 10 eV) line at 6.4 keV has a large equivalent width of keV ().
The fit can be significantly improved if the line is broad, or if it consists of a number of components. Allowing the line to be broad we obtain with keV, and the EW increases to 2 keV with intensity photons s-1. Alternatively, adding a second, narrow line at 6.5 keV (fixed energy) gives and EW of 570 eV and 270 eV for the 6.4 and 6.5 keV components, respectively. Repeating the fits to ungrouped data, using C-statistics, gives (for 1043 PHA bins): C-stat=929 for a narrow Gaussian at 6.38 keV, C-stat=906 for a broad Gaussian and C-stat=911 for two narrow Gaussians. There is thus a preference for a broad line, but it is rather marginal.
Clearly, the very hard power law component cannot be the nuclear continuum observed directly. Instead, in an attempt to construct a more physical model of the source, we interpret the spectrum of the compact region in the Chandra data to be solely due to Compton reflection of an unseen primary continuum. With this physical model we obtain for reflection of an intrinsic (unseen) power law of by neutral, solar abundance material (assumed inclination of 60∘). The line emission in this model is calculated self-consistently with the reflected continuum (Życki, Done & Smith 1999), so its equivalent width is fixed with respect to the reflected continuum for a given illuminating power law and reflector ionization state and inclination ( keV for the parameters used here). The model also includes the Compton downscattered shoulder on the iron K line, so the line is intrinsically broad. However, the fit can be significantly improved () by allowing the spectral features to be further broadened, corresponding to a radius of if this is from Keplerian motion.
The deconvolved spectrum with the unsmeared reflection model is shown in Fig. 4. There is a marginally significant residual ( for 2 additional degrees of freedom) for a narrow line at energy which could indicate the presence of reflection from more highly ionised material.
3.2. Broad-band nuclear spectrum
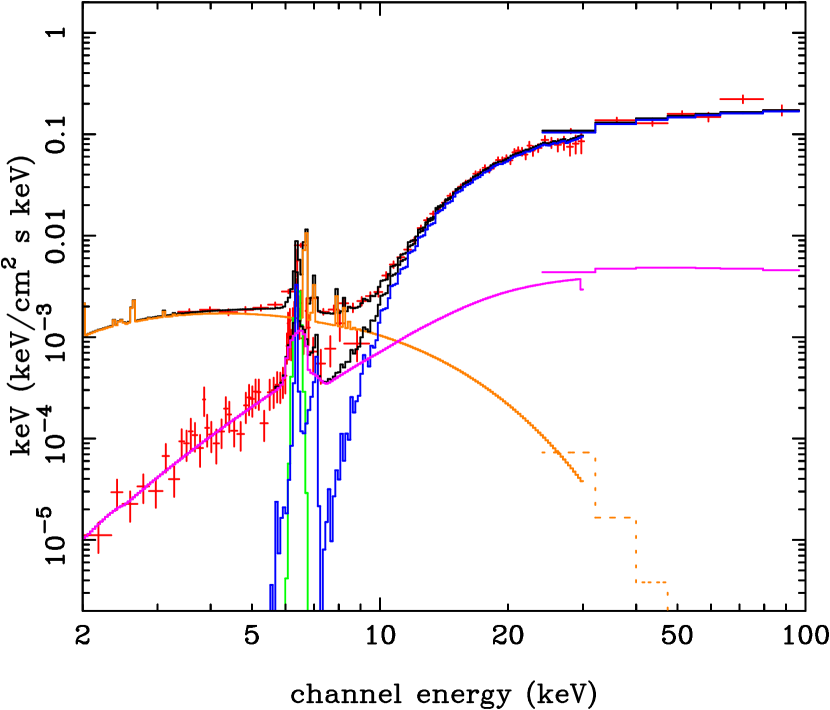
Fig. 5 shows the broad band nuclear spectrum derived from fitting the nuclear spectrum from Chandra, together with the PCA and HEXTE data. Chandra can spatially resolve the nuclear emission in the 1–10 keV range, but both the PCA and HEXTE data cover a large field of view ( degree), so include a contribution from off–nuclear point sources and host galaxy diffuse emission as well as the nucleus itself. We fit the spectra from the 3 instruments simultaneously, but include a contribution from extended emission in the PCA and HEXTE spectra which is set to zero in the Chandra data. This extended emission can be well fit by a hot plasma (modelled here using a solar abundance mekal code), and we also include an additional emission line at 6.4 keV. The nuclear emission is modelled by a heavily absorbed power law and its weakly absorbed reflection (pexrav plus a gaussian line), and results are detailed in Table 1. The overall shape of the spectrum is very similar to that seen in previous observations, and a direct comparison of the PCA spectrum with that of Madejski et al. (2000) shows no evidence for any changes in spectral shape, but the absorbed power law emission from the nucleus is a factor 1.8 brighter in the observations reported here.
The PCA spectrum contains much more line emission than seen in Chandra. While much of this is consistent with moderately ionised (6.5–6.7 keV) emission from the hot diffuse plasma, there is also evidence for some additional line at 6.4 keV, impling a contribution to the fluorescent emission from the extended region (see also Guainazzi et al. 2000; Schurch et al. 2002 and Section 4 below).
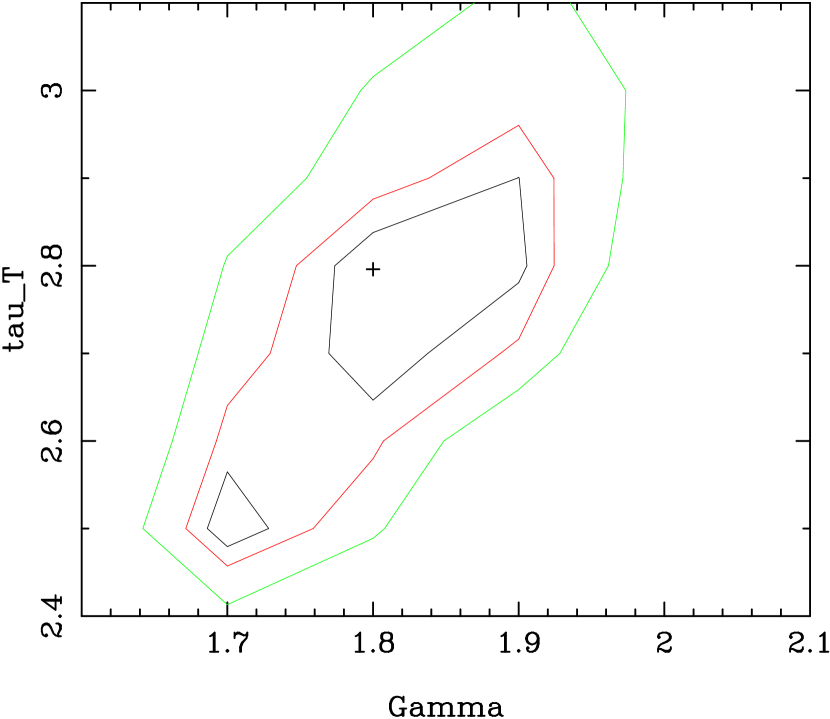
The heavy absorption towards the nucleus implies that the obscuring material is optically thick to electron scattering, with an optical depth of a few. This scattering changes the spectral shape from that obtained by pure absorption, and we model this using the Monte Carlo code of Krolik, Madau & Życki (1994). Motivated by previous and current observations where the rapid variability implies a rather geometrically thin (disk-like) absorbing structure, we assume that the absorbing material subtends a rather small solid angle to the X-ray source (Madejski et al. 2000). We assume this material forms a symmetric torus, with half-angle of the absorber as seen from the central source of i.e. a torus opening angle of which we view at (see Madejski et al. 2000). We also replace the separate reflection continuum/line model used above with the self consistent reflected spectrum model. This fit is detailed in Table 1, and the resulting unfolded spectrum is plotted in Fig. 5. The overall spectral index is with confidence contours on the spectral index and optical depth of the absorber are plotted in Fig. 6.
The optically thick absorption means that the true power law intensity is suppressed by a factor even at 50-100 keV. The inferred power law normalisation corrected for this large (but fairly uncertain, see Fig. 6) factor gives a 0.1-200 keV flux of ergs cm-2 s-1. This implies an intrinsic X-ray flux of ergs cm-2 s-2 in the 0.1–200 keV bandpass, which is 50 per cent of the Eddington limit and similar to the observed FIR luminosity. Thus it is likely that the AGN powers a substantial fraction of the observed FIR emission (Marconi et al. 2000).
| aaAbsorption applied to the intrinsic nuclear (power law) spectrum in units of cm-2 | Norm | bbAbsorption applied to all spectral components in units of cm-2 | ccSolid angle subtended by the reflector (i.e. normalization relative to the direct power law normalization) in units of . Assumes a reflector inclination of . | Fe K intensitydd6.4 keV iron line emission from the nucleus in photons cm-2 s-1 | /dof | |
|---|---|---|---|---|---|---|
| eeThere is also a mekal plasma ( keV, 2–10 keV unabsorbed flux of ergs s-1) and additional 6.4 keV narrow gaussian line with intensity photons cm-2 s-1 in the PCA and HEXTE data (normalizations set to zero in Chandra) so as to account for the extended emission in their wide fields of view. | ||||||
3.3. Origin of the nuclear 6.4 keV Fe K line
Clearly, one of the main questions is the origin of the Fe K line. In the model of the nuclear spectrum above the line can arise either in the reflector or in the optically thick absorbing material. This distinction may be somewhat artificial as its possible to envisage a geometry in which the absorber and reflector are the same structure, e.g. where we are looking at an absorbing disk at an angle closer to (the assumed opening angle) rather than so reflected photons from the far side of the disk can be seen without being absorbed. Any warp on the disk will also enhance the solid angle of reflecting material which can be seen, and it is noteworthy that the maser emission in this and other AGN indicate that the cool material at 0.1–1 pc has a shallow warp.
In our assumed geometry, where we view the absorbing disk/torus at then this material produces % of the total line seen from the nucleus. The separate reflecting material produces the rest of the line, and for solar abundances, the equivalent width of the line to reflected continuum is about 1.3–1.6 keV (George & Fabian 1991; Matt, Perola & Piro 1991). This is not strongly affected by increasing the abundances of all the heavy elements - this increases the amount of line produced, but also increases the opacity so fewer line photons escape (George & Fabian 1991). However, increasing the iron abundance relative to the other elements can give a marked change in the line equivalent width (George & Fabian 1991), and fits to the Chandra/RXTE full nuclear continuum using absorption/reflection models with iron alone at twice solar abundance give a significantly worse fit than solar abundances. Iron overabundances are predicted in most chemical evolution models for AGN, and are often observed (Haman & Ferland 1993). However, there is a delay of Gyrs for the onset of the Fe producing Type 1a supernovae, so our observed solar abundances are consistent with models for a young starburst (0.01 Gyr) in this object (Marconi et al. 2000).
Our reflection model assumes that the iron line is produced in optically thick material. However, the line equivalent width can also be affected by the column density of the material. The reflection models assume that the material is optically thick, i.e. cm-2. At these columns then all the photons above the iron edge which can produce the fluorescence line are absorbed. If the column is reduced below cm-2 then this is no longer true. The material becomes thin to the photoelectric absorption opacity at the iron edge and the line decreases. But this also changes the reflected continuum - depending on the geometry it can either look like a standard reflection spectrum up to the point where the material becomes optically thin to photoelectric opacity or it can look like straightforward absorption by a column of cm-2. Given that the observed continuum in Chandra looks like optically thick reflection up to at least 6-7 keV then the column density of the reflecting material must be at least cm-2.
4. Diffuse emission
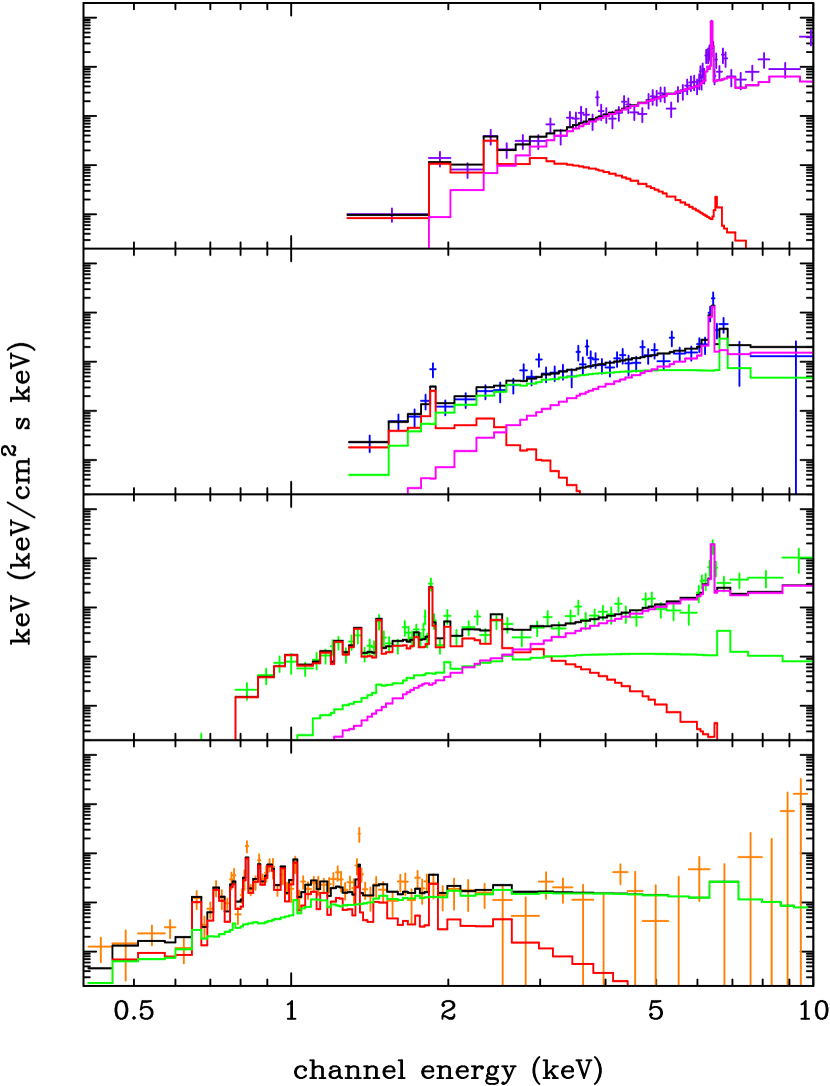
The Chandra spectra from the diffuse emission regions extracted from regions located at progressively further distances from the nucleus are shown in Fig. 7. The nuclear spectrum itself is shown for comparison in the top panel. Plainly the diffuse spectra nearby the nucleus (diff-nuc and diff-1) contain a substantial iron K line and show a hard continuum spectrum, which suggests that they are also dominated by Compton reflection from optically thick material at high energies. However, the increasing counts at low energy, and increasing strength of line features (such as the keV line, presumably due to He–like silicon, and the iron L emission lines) show that there is also an increasing fraction of the emission from hot/photoionized plasma as distance from the nucleus increases. This hot plasma could be either predominantly photoionised by the nucleus, or mechanically heated by the starburst. In either case it will contain some free electrons which scatter some fraction of the nuclear light, giving an additional scattered power law component.
We assume the intrinsic primary emission is an isotropically emitted power law with fixed index and normalisation of photons cm-2 s-1 at 1 keV, as derived from Section 3.2. Some fraction, of this is reflected from cold material (again we use the reflection code in which the self-consistent iron line emission is included), while another fraction, is scattered from hot electrons, forming a power law.
We first assume that the line emission is from a mechanically heated plasma (using the mekal code), and these fits are detailed in Table 2. We also include fits to the Chandra nuclear spectrum, to show the limits on the scattered and hot gas emission on the smallest scales, though here we truncate the data at 6.6 keV so as not to include any transmitted flux. With this different energy range the line broadening is much less significant, at .
| file | cm-2aaForeground absorption applied to all model components | kT (keV) | mekal flux ergs s-1bbBolometric, unabsorbed flux extrapolated over 0.01–100 keV | ccNormalization relative to that of the primary known from the broad band modeling. | ddNormalization in units of . Assumes inclination . | /dof |
|---|---|---|---|---|---|---|
| nuc | 0.7eeTemperature fixed at 0.7 keV as the component is not significantly detected. | 51.6/43 | ||||
| diff-nuc | 0.7eeTemperature fixed at 0.7 keV as the component is not significantly detected. | 35.8/39 | ||||
| diff-1 | 62.5/62 | |||||
| diff-2 | 60.2/76 | |||||
The data show clear differences in the absorping column, decreasing as a function of distance from the nucleus. The ISM in our galaxy in this direction has cm-2 while the observed column is significantly higher than this in all fields except diff-2. This is unsurprising as NGC 4945 is an edge on galaxy. The Chandra nuclear spectrum is inferred to be more absorbed in these fits than from the reflection model fitting in Section 3.1. This is due both to the steeper illuminating spectrum and to ignoring the data above 6.6 keV which include some component from the direct nuclear emission. Intruiguingly, CO observations imply a ring of molecular gas with column of cm-2 in the nuclear direction (Whiteoak et al. 1990), and photoelectric absorption is known to follow the molecular gas column in Seyfert 2’s (e.g. Wilson et al. 1998).
The data also indicate that the different spectral components behave differently with distance from the nucleus. The neutral reflected fraction is highest in the nucleus, then is smaller in diff-nuc and diff-1, and much smaller (not significantly detected) in diff-2. Conversely, the medium energy emission component modelled here as scattered nuclear flux is not significantly detected in the nucleus, is largest in diff-nuc and diff-1, while it is smaller but still significant in diff-2. The low energy, warm gas component is not significantly detected in nuc or diff-nuc, but has a total luminosity of and ergs s-1 in diff-1 and diff-2, respectively. The fits are acceptable in all cases, although line-like residuals remain in diff-nuc and diff-1.
The self-consistency of this model can be checked by estimating the density of the mekal plasma diffuse emission, and then using this to calculate how important photo-ionisation should be. The luminosity of a mekal plasma of density in volume is , where ergs cm-3 s-1 for a temperature of keV. The three regions, diff-nuc, diff-1 and diff-2, have volume of , and cm3, respectively (assuming axial symmetry), so the hot plasma densities are and cm-3 assuming it smoothly fills the volume. In our model this hot gas also scatters the direct nuclear flux. The scattered fraction , where the solid angle and for diff-nuc, diff-1 and diff-2, and the path length and pc. The scattered fraction predicted by the hot plasma is and . These are significantly bigger than the scattered fractions derived from the fits, except for diff-2. The fit result scattered fractions predict densities of and cm-3, respectively, for plasma smoothly filling the volume.
The distance from the nucleus in each case is and pc, so the ionisation parameter, , is approximately constant at in each region. This high value indicates that the model of collisionally heated hot gas filling the volume is not self-consistent. Either the gas is strongly clumped, so that its density is higher by a factor of , or photoionisation will dominate over collisional equilibrium. A key problem with having photo-ionisation dominate is that there are no signatures of the AGN illuminating the extended emission in any other waveband. There are no standard AGN high excitation narrow lines in the optical (e.g. [OIII] Moorwood et al. 1996), near- or mid-IR (Genzel et al. 1998; Marconi et al. 2000: Spoon et al. 2000), and the [FeII]/Br line ratios are indicative of shock heating rather than photoionisation (Reunanen, Kotilainen & Prieto 2002). The observed extended emission line regions must be shielded from the nuclear photoionising flux (5 eV–1 keV: Marconi et al. 2000), but the extended 6.4 keV line emission shows that it must be illuminated by photons keV. Hence the nucleus must be absorbed by columns of cm-2 in all directions.
Photo-ionisation by such a hard (absorbed) X-ray spectrum would lead to fluorescence lines from mostly neutral material rather than ionized line emission. This is observed in the extended 6.4 keV Fe line emission (significantly detected in diff-nuc and diff-1), but this cannot explain the lower energy line emission (e.g. Si at 1.8 keV or the iron L complex in diff-1 and diff-2). Thus the low energy lines must be from collisionally ionised material, so the mekal parameters derived above indicate that the material must be clumpy.
The requirement that the nuclear spectrum be absorbed means that the model of a power law for the scattered flux is also not consistent. Replacing this by an absorbed power law gives stringent constraints in diff-2. Absorption of on the scattered flux increases by 2.7, while columns of and cm-2 increase it by 8.5 and 12.5, respectively. Thus it seems most likely that the 3–5 keV continuum is not from scattered nuclear flux but rather is from hot, clumped gas.
Models of starburst galaxies indicate that the material is indeed strongly clumped (Suchkov et al. 1996; Strickland & Stevens 2000), such that multiphase and multitemperature gas exists at all radii. We replace the scattered component with a second, higher temperature mekal plasma. This gives similar fits to all the spectra, but requires temperatures of 4–7 keV in addition to the lower temperature gas at 0.5–0.7 keV. Such hot gas is difficult to produce (Suchkov et al. 1994; Strickland & Stevens 2000), but this component is observed in pure starburst galaxies (Pietsch et al. 2001), and a similar model with multitemperature hot components was used by Schurch et al. (2002) to fit the diffuse emission in both Chandra and XMM. An alternative explanation could be that it is from an unresolved population of X-ray binaries (Persic & Rephaeli 2002).
To summarize, all the off nuclear spectra require that the gas is multiphase. The most likely interpretation is that they all have multitemperature clumps of hot gas, while diff-nuc and diff-1 also strongly require the presence of cool, optically thick clumps.
5. The Overall Geometry
The Chandra image can be superimposed on previous images of this galaxy at other wavelengths. Our diff-nuc spectrum corresponds to the 100-200 pc edge-on starburst ring traced by molecular gas (Br : Moorwood et al. 1996, Pa and H2: Marconi et al. 2000 and CO: Curran et al. 2001). This ring has its major axis along the major axis of the host galaxy (NE-SW direction), which also matches the position angle of the central maser disk (Greenhill et al. 1997).
The diff-1 spectrum extends into the region of molecular gas where the emission is dominated by H2 rather than by Pa (Marconi et al. 2000). The Pa line traces mainly starburst activity, while the H2 emission probably reflects shock heating on the edges of the superwind cone (Moorwood et al. 1996). The diff-2 spectrum covers the extended narrow line emission seen as a cone in the low excitation lines H and [NII] (Moorwood et al. 1996).
The extreme absorption seen towards the nucleus in X-rays corresponds to optical depths of to electron scattering. This material has a rather small scale height as otherwise the scattered X-rays would noticeably smear the hard X-ray variability (Madejski et al. 2000). A small, dense inner disk is also required to produce the observed maser emission, so we identify the extreme absorber with the masing disk. This material is distributed over a patch pc in size (Greenhill et al. 1997), representing H2 densities on the order of to cm-3 for fractional H2O abundances of to (Elitzurm 1992), so giving a potential column of cm-2. Since this is considerably bigger than the observed obscuration then we may not be in the maximally absorbed, completely edge-on, line of sight.
In addition to the dense absorbing disk, the central engine must be completely embedded in obscuring material within pc so that UV and soft X-ray fluxes do not escape (Marconi et al. 2000). Although this additional absorption could be associated with material from the starburst-related inflow along a bar (Ott et al. 2001), we suggest that it may be a high latitude extension of the dense absorber (i.e., the maser-emitting material is a thickening in the equatorial plane). As such the central parsec of NGC 4945 could be more gas rich than that for most other Seyfert galaxies. In this sense, NGC 4945 may be similar to NGC 3079, another active galaxy that exhibits very large columns (Iyomoto etal. 2001), substantial nuclear star formation (Cecil et al. 2001 and references therein), and a disordered but otherwise disk-like distribution of H2O masers (Trotter et al. 1998). This absorber is probably seen in the column of cm-2 inferred on the reflected nuclear X-ray spectrum, corresponding to . This is also the absorbing column seen to the far IR nuclear source (Krabbe et al. 2001).
On much larger scales there is absorption associated with dusty nuclear starburst ring which forms a 100-200 pc torus around the nucleus (Marconi et al. 2000). This picture fits into the growing evidence for two distinct absorption structures in many AGN, with a compact, extreme absorption region surrounded by an extended dusty lower absorption region (e.g. Granato et al. 1997).
The energy from supernovae in the starburst ring produces hot multiphase gas which emits in the soft X-ray range. A population of X-ray binaries may also contribute to the spectrum from this region, which would remove the requirement for some of this gas to be as hot as keV. However, flux at keV is also required in the superwind (diff-2) region, where it is hard to envisage anything other than hot gas being present. This intrinsic diffuse emission is augmented by some scattering of the absorbed nuclear flux in cold, optically thick material. These cool clumps most probably represent starforming cores as these have density cm-3 and size scales of 1 pc (Plume et al. 1997).
6. Conclusions
The unsurpassed X-ray imaging ability of the Chandra satellite allows us to disentangle the AGN and starburst/superwind contributions in NGC 4945. Chandra sees the nucleus only in reflection: simultaneous RXTE data show the direct nuclear flux absorbed by an extreme column of cm-2.
The starburst/superwind gas is clearly multi-phase, with cool clumps (seen in reflection and iron fluorescence line emission at 6.4 keV) co-existing with hot gas. The hot gas is itself clumped rather than being uniform, as otherwise it would be strongly photo-ionised in conflict with the observed spectrum from the furthest region (diff-2). We show that the self-consistent scattered emission from the hot gas is probably unimportant compared to its diffuse emission.
The extreme absorption of cm-2 seen towards the nucleus cannot completely cover the source in all direction as the extended 6.4 keV fluorescence line emission clearly shows that the hard X-rays (7-10 keV) from the AGN illuminate the starburst ring. However, the lack of optical/IR high excitation lines from this region equally clearly shows that the UV/soft X-rays from the AGN do not illuminate this material. Either the AGN does not produce UV/soft X-rays (which seems highly unlikely) or they are absorbed in all directions which requires columns of cm-2 This implies that the nucleus is completely embedded in a column of cm-2, probably associated with molecular gas driven into the nucleus by the starburst/superwind.
7. Acknowledgements
This work was supported by Chandra grant from NASA to Stanford University via the SAO award no. GO0-1038A and in part by Polish KBN grant 2P03D01718. PTZ and CD thank SLAC for the hospitality during visits there.
References
- (1)
- (2) Band, D., Klein, R., Castor, J., & Nash, J. 1990, ApJ, 362, 90
- (3)
- (4) Curran S. J., Johansson L. E. B., Bergman P., Heikkilä A., Aalto S., 2001, A&A, 367, 457
- (5)
- (6) Done, C., Madejski, G., & Smith, D. 1996, ApJ, 463, L63
- (7)
- (8) Dos Santos, P. M., & Lepine, J. R. D. 1979, Nature, 278, 34
- (9)
- (10) Genzel R., et al. 1998, ApJ 498, 579
- (11)
- (12) George I. M., Fabian A. C., 1991, MNRAS, 249, 352
- (13)
- (14) Granato G. L., Danese L., Franceschini A., 1997, ApJ, 486, 147
- (15)
- (16) Greenhill, L. J., Moran, J. M., & Herrnstein, J. R. 1997, ApJ, 481, L23
- (17)
- (18) Guainazzi, M., Matt, G., Brandt, W. N., Antonelli, L. A., Barr, P., & Bassani, L. 2000, A&A, 356, 463
- (19)
- (20) Heckman, T., Armus, L., & Miley, G. 1990, ApJS, 74, 833
- (21)
- (22) Hamann F., & Ferland G., 1993, ApJ., 418, 11
- (23)
- (24) Iwasawa, K., et al. 1993, ApJ, 409, 155
- (25)
- (26) Krabbe A., Böker T., Maiolino R., ApJ, 557, 626
- (27)
- (28) Krolik J. H., Kallman T. R., 1987, ApJ, 320, L5
- (29)
- (30) Krolik, J. H., Madau, P., & Życki, P. T. 1994, ApJ, 420, L57
- (31)
- (32) Madejski, G. M., Życki, P. T., Done, C., Valinia, A., Blanco, P., Rothschild, R., & Turek, B. 2000, ApJ, 535, L87
- (33)
- (34) Marconi A., Oliva E., van der Werf P. P., Maiolino R., Schreier E. J., Macchetto F., Moorwood A. F. M., 2000, A&A, 357, 24
- (35)
- (36) Matt G., Perola G., Piro L., 1991, A&A, 247, 25
- (37)
- (38) Mauersberger, R., Henkel, C., Whiteoak, J., Chin, Y.-N., & Tieftrunk, A. 1996, A&A, 309, 705
- (39)
- (40) Moorwood A.F.M., van der Werf P.P., Kotilainen J.K., Marconi A., Oliva E., 1996, A&A, 308, L1
- (41)
- (42) Nakai, N. 1989, PASJ, 41, 1107
- (43)
- (44) Ott M., Whiteoak J. B., Henkel C., Wielebinski R., 2001, A&A, 372, 463
- (45)
- (46) Persic M., Rephaeli Y., 2002, A&A, 382, 843
- (47)
- (48) Pietsch W. et al. 2001, A&A 365, L174
- (49)
- (50) Plume R., Jaffe D. T., Evans, N. J., Martin-Pintado J., Gomez-Gonzalez J., 1997, ApJ, 476, 730
- (51)
- (52) Reunanen J., Kotilainen J. K., Prieto M. A., 2002, MNRAS, 331, 154
- (53)
- (54) Sambruna, R., et al. 2001, ApJ, 546, L13
- (55)
- (56) Schurch N. J., Roberts T. P., Warwick R. S., 2002, MNRAS, 335, 241
- (57)
- (58) Spoon H. W. W., Koornneef J., Moorwood A. F. M., Lutz D., Tielens A. G. G. M., 2000, A&A, 357, 898
- (59)
- (60) Strickland D. K., Stevens I. R., 2000, MNRAS, 314, 511
- (61)
- (62) Suchkov A. A., Balsara D. S., Heckman T. H., Leitherer C, 1994, ApJ, 430, 511
- (63)
- (64) Suchkov A. A., Berman V. G., Heckman T. M., Balsara D. S., 1996, ApJ, 463, 528
- (65)
- (66) Veron-Cetty M.P., Veron P., 2000, A&AR, 10, 81
- (67)
- (68) Whiteoak J. B., Dahlem M., Wielebinski R., Harnett J. I., 1990, A&A, 231, 25
- (69)
- (70) Wilson A. S., et al. 1998, ApJ, 505, 587
- (71)
- (72) Życki P. T., Done C., Smith D. A., 1999, MNRAS, 305, 231
- (73)