Discovery of Early Optical Emission from GRB 021211
Abstract
We report our discovery and early time optical, near-infrared, and radio wavelength follow-up observations of the afterglow of the gamma-ray burst GRB 021211. Our optical observations, beginning 21 min after the burst trigger, demonstrate that the early afterglow of this burst is roughly three magnitudes fainter than the afterglow of GRB 990123 at similar epochs, and fainter than almost all known afterglows at an epoch of 1 d after the GRB. Our near-infrared and optical observations indicate that this is not due to extinction. Combining our observations with data reported by other groups, we identify the signature of a reverse shock. This reverse shock is not detected to a 3- limit of 110 Jy in an 8.46-GHz VLA observation at d, implying either that the Lorentz factor of the burst , or that synchrotron self-absorption effects dominate the radio emission at this time. Our early optical observations, near the peak of the optical afterglow (forward shock), allow us to characterize the afterglow in detail. Comparing our model to flux upper limits from the VLA at later times, week, we find that the late-time radio flux is suppressed by a factor of two relative to the 80 Jy peak flux at optical wavelengths. This suppression is not likely to be due to synchrotron self-absorption or an early jet break, and we suggest instead that the burst may have suffered substantial radiative corrections.
1 Introduction
Gamma-ray burst (GRB) afterglow emission on timescales of hours to days, the historical standard for ground-based follow-up observations, can provide a robust measure of the global parameters of the GRB such as its total explosive yield and the density of the circumburst medium on length scales of cm (Sari et al., 1998; Wijers & Galama, 1999).
Early emission, on a timescale of tens of minutes and less, can offer insight into the details of the explosion, including the relativistic Lorentz factor of the burst ejecta (Sari & Piran, 1999b) and the distribution of the circumburst medium on length scales cm. If the GRB progenitor is a massive star, then this regime is expected to show the clear signature of a dense stellar wind (density ; Chevalier & Li 2000).
These two unique diagnostics, among others, have motivated searches for early optical emission from GRBs. The first success came with detection of early optical (Akerlof et al., 1999) and radio (Kulkarni et al., 1999) emission from GRB 990123 (Briggs et al., 1999). This emission has been interpreted in terms of a reverse shock plowing back through the GRB ejecta (Sari & Piran, 1999a; Mészáros & Rees, 1999).
After nearly four years, early emission was recently discovered again from GRB 021004 (Fox et al., 2003) and GRB 021211 (Fox & Price, 2002). These discoveries were made possible by the prompt alerts of the HETE-2 satellite (Ricker et al., 2002), and the wide field and high sensitivity of the 48-inch Palomar Oschin Schmidt telescope (P48) equipped with the NEAT camera (Pravdo et al., 1999). The increase in the number of robotic telescopes has allowed for intensive follow-up of both of these bursts during the critical early minutes to hours. Here, we report the discovery of early optical emission and subsequent multi-wavelength follow-up observations of GRB 021211.
2 Observations
GRB 021211 (HETE Trigger #2493) was detected at UT 11:18:34 on 11 Dec 2002. With a duration of s and a fluence of erg cm-2 (8–40 keV), the event is a typical long duration GRB (Crew et al., 2002). At the time of electronic notification the HETE-2 localization, although large (30-arcminute radius), was covered by the 1.1 field-of-view of NEAT. We identified a new source that was not present in the Palomar Sky Survey (Fig. 1) and announced this as a possible optical counterpart of GRB 021211 (Fox & Price, 2002). The best HETE-2 localization at the time of our discovery announcement was 14 arcmin in radius; a subsequent SXC localization produced the 2 arcmin-radius circle shown in Figure 1. The position of the optical transient (OT) with respect to the Guide Star Catalog II is =08:08:59.858 and =+06:43:37.52 (J2000) with estimated uncertainty of 0.1 arcsec in each axis.
We continued monitoring with P48, the 40-inch telescope at Siding Spring (SS0-40), and the Palomar Hale 5-m (P200) telescope with JCAM (Bloom et al., 2003). Photometry has been performed using the secondary calibrators of Henden (2002); see Table 1.
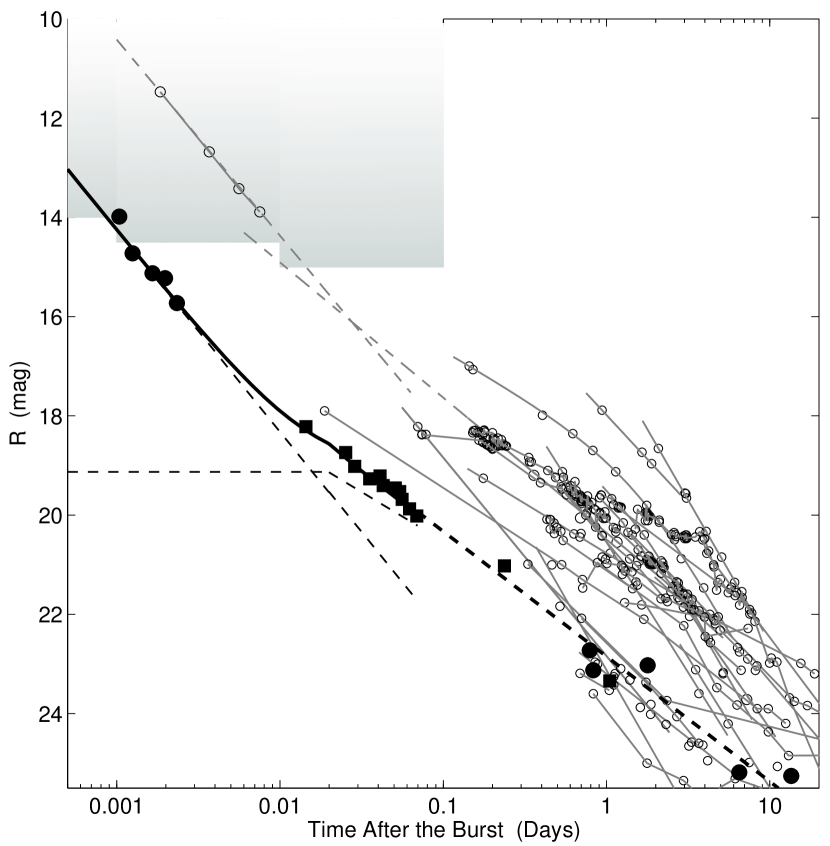
Our optical source was subsequently identified in images obtained by several robotic telescopes and other ground-based facilities. In particular, RAPTOR (Wozniak et al., 2002), KAIT (Li et al., 2002) and S-LOTIS (Park et al., 2002) detected the source 90 s, 108 s, and 143 s after the burst, respectively. In Figure 2 we present the light curve obtained by combining data from these and other GCNs with our data.
Near-infrared – We observed the afterglow in the near-infrared with the Cassegrain f/70 low-background secondary and D-78 infrared camera (Soifer et al., 1991) on P200 on Dec. 11.55 UT (-band) and with NIRC (Matthews & Soifer, 1994) on the Keck-I 10-m telescope on Dec. 18.5 UT (). NIRC observations were photometered relative to SJ 9116 and SJ 9134 (Persson et al., 1998), and the P200 zero-point was determined from the NIRC observations by reference to two secondary calibrators, S1 and S2 (see Fig. 1). Our results are given in Table 1.
Radio – We searched for radio emission with the Very Large Array (VLA)111The NRAO is a facility of the National Science Foundation operated under cooperative agreement by Associated Universities, Inc.; our initial observation at hr represents the earliest radio observation of any GRB to date. We used PKS 0734+100 for phase calibration and 3C 147 and 3C 286 for flux calibration. No counterpart to the OT is detected in any single observation. Adding the data between 2002 December 20 and 2003 January 6, we measure an 8.46-GHz upper limit of 35 Jy at the position of the OT. Peak flux densities at the position of the OT can be found in Table 2.
Separately, on Dec 12.51 UT we carried out an observation in the 347-GHz band with the Submillimetre Common User Bolometer Array (SCUBA) on the James Clark Maxwell Telescope (JCMT)222The James Clerk Maxwell Telescope is operated by The Joint Astronomy Centre on behalf of the Particle Physics and Astronomy Research Council of the United Kingdom, the Netherlands Organization for Scientific Research, and the National Research Council of Canada.. We used CRL 618 as the secondary flux standard. At the position of the OT we measure a 347-GHz flux density of mJy.
3 A Two-Component Light Curve
To date, only three bursts have had early-time optical detections: GRB 990123 (Akerlof et al., 1999), GRB 021004 (Fox et al., 2003) and GRB 021211. GRB 021211 is at any epoch one of the faintest detected afterglows; at early epochs it is more than 3 mag fainter than GRB 990123, and at later epochs ( d) it lies below the great majority of afterglow lightcurves (Fig. 2). As we show below, this is not the result of extinction in the host galaxy, so this burst reminds us that many so-called “dark bursts” may simply be faint (c.f. Fynbo et al. 2001; Berger et al. 2002).
Examining Figure 2, we see that the early behavior of GRB 021211 bears a striking resemblance to the light curve of GRB 990123 (c.f. Chornock et al. 2002). The light curve can be considered as composed of two segments: an initial steeply-declining “flash”, with , followed by emission declining as a typical afterglow, . The corresponding terms are “flare” and afterglow for the radio emission (Kulkarni et al., 1999).
The optical flash is thought to result from a reverse shock propagating into the GRB ejecta (Sari & Piran, 1999a), while the afterglow arises in the shocked ambient material swept up by the ejecta (Sari et al., 1998). For each shock, it is assumed that some fraction of the shock energy is partitioned into energetic electrons () and magnetic fields (). The electrons are expected to follow a power-law distribution in energy, for , where is the electron Lorentz factor. Their collective emission follows at frequencies above the synchrotron peak frequency and otherwise. Below the self-absorption frequency , synchrotron self-absorption becomes important, and above the characteristic cooling frequency , electrons lose their energy rapidly, on the timescale of the shock evolution.
The forward and reverse shocks evolve differently. Once the reverse shock has passed through the ejecta shell then no new electrons are accelerated and the shocked electrons cool adiabatically: , with the flux at (the “peak” flux) decaying as (Sari & Piran, 1999b); for the emission decreases even more rapidly. In contrast, electrons are continually added to and accelerated at the forward shock; in the case of a uniform circumburst medium, is constant, and even above the flux declines only slowly. Since in a stellar wind-type circumburst medium () the reverse shock is inevitably below the optical band, detection of long-lived reverse shock emission for GRB 021211 suffices to rule out wind models for this burst (Chevalier & Li, 2000).
3.1 The Reverse Shock Flare
The optical flux is already declining at the first epoch (Wozniak et al., 2002), when s and mag, corresponding to mJy at a mean frequency of Hz; here the superscript * identifies quantities taken at s. This implies that , and constrains the time when the flare spectral peak passes through the optical bandpass, , to be . Since the observed decline at is not very rapid, , we have also that .
The constraint on the time of the optical peak flux can be converted into a constraint on the relativistic Lorentz factor of the GRB ejecta. From Sari & Piran (1999b) we have s (thin-shell case), where is the time at which the reverse shock crosses the GRB ejecta, is the circumburst particle density per cubic cm, is , and is the isotropic-equivalent burst energy in units of erg. Since , we find that .
Using the prompt emission fluence of erg cm-2 (8–40 keV) together with the proposed redshift of (Vreeswijk et al., 2002), we find an isotropic -ray energy of ergs for GRB 021211. Since this fluence is measured over a relatively narrow band, the full -corrected fluence (Bloom et al., 2001) may easily reach ergs, and it is reasonable to assume .
Following Sari & Piran (1999a), in the absence of synchrotron self-absorption the radio flux will follow for times , and for times , where is the time when passes through the radio band, GHz. The value of follows directly from the equation , and is equal to 1.35 d in the limiting case . By this time the peak flux will have declined as . Note that we are temporarily ignoring extinction effects, which are discussed in §3.2 below.
For , we extrapolate the observed optical flux decay back in time as . The light curve of the radio flare is thus a direct function of :
| (1) |
with the decay past steepening to . Our 3- upper limits at d and d are 110 Jy and 66 Jy, respectively. For (§3.2), the radio flux at d is predicted to be 15 Jy, independent of . The radio flux at d is a strong function of , however, and Eq. 1 gives s and mJy.
3.2 The Forward Shock Afterglow
A variety of afterglow lightcurves are possible (Kobayashi, 2000) but the form of sharp rise, plateau, and power-law decay is near-universal. Given the bright flare, we cannot constrain the rising portion of the afterglow lightcurve. We fit the flare as a power-law decay of index and the afterglow as a constant flux, , which undergoes a power-law decay with index for (Fig. 2).
We first examine the constraints on the reverse shock decay. Published GCN data are sufficient to constrain , and since (Sari & Piran, 1999a), this implies that .
The gap between the GCN data and our P48 measurements creates fitting degeneracies in the full model, so we fix at three successive values, 1.50, 1.63, and 1.76, and make fits to the full dataset. Incorporating the range in parameter uncertainties covered in these three fits, we find that , Jy and s. Note that because the flare dominates the afterglow emission at early times, our fitted should be considered a lower limit and our an upper limit.
We can measure the power-law slope of the spectrum, , using our and photometry near d (correcting first for Galactic extinction of =0.07 mag; Schlegel et al. 1998). If at this time, then , , and , implying little extinction in the host, in the observer frame. On the other hand, if at this time, then , , and , corresponding to an intrinsic reddening of (observer frame). In either case, extinction within the host cannot explain the 2 mag gap between the -band lightcurve and those of most afterglows.
Since we do not know the location of relative to the optical band, we adopt an average extinction correction of . This corrects our limiting peak flux of Jy to an unextinguished flux of Jy.
From our model fits, , so that Jy. We can use this relation along with Eqs. 4.3 and 4.5 of Sari & Esin (2001) to estimate the circumburst density on length scales of cm. We find that cm-3, where . Since we have (§3.1), this implies either a low-density circumburst medium, or abnormally low values of or .
In the absence of self-absorption, the radio afterglow can be expected to peak at time d. In the standard model the synchrotron peak flux remains constant as the peak frequency decreases, so we expect a radio peak flux of roughly 85 Jy. Prior to the peak time, and . At the mean epoch of our summed image, d, we expect Jy, and our 2- upper limit is Jy, a factor of two below the predicted level.
We can estimate the self-absorption frequency (Eq. 4.1 of Sari & Esin 2001) in terms of the peak flux, GHz. Self-absorption will be effective in the case of a high circumburst density – unlikely on the basis of our estimate – or if is sufficiently large. In the latter case, at fixed frequency the effects of increasing self-absorption win out over the raw increase in flux. Suppressing the radio flux by a factor of two requires Jy ( s), however, which seems unlikely.
The discrepancy between the observed and expected fluxes can be due to an early jet break, (Rhoads, 1999; Sari et al., 1999). The optical light-curve, however, shows no sharp steepening out to d (Fig. 2). Moreover, the measured fluence and proposed redshift for GRB 021211 are consistent with minimal beaming for a “standard candle” burst ( ergs; Frail et al. 2001), so that an early jet-break seems an unlikely scenario to explain the suppression of the radio flux.
Alternatively, the afterglow radiative corrections (Sari, 1997; Cohen et al., 1998) may be significant. In the slow-cooling regime (), radiative corrections can be substantial if is large (), is close to , or is close or equal to 2. We have not derived an estimate for , but for our models, so this scenario remains an attractive candidate for future modeling.
Acknowledgments.
We acknowledge the efforts of the NEAT team at JPL, and of Scott Barthelmy at Goddard for the GCN. Thanks are due to Josh Bloom, who has built an excellent transient observing system in JCAM. SRK thanks S. Thorsett for maintaining the “hyperlinked GCN” web page. GRB research at Caltech is supported by grants from NSF and NASA.
References
- Akerlof et al. (1999) Akerlof, C. et al. 1999, Nature, 398, 400
- Berger et al. (2002) Berger, E. et al. 2002, ApJ, 581, 981
- Bloom et al. (2001) Bloom, J. S., Frail, D. A., & Sari, R. 2001, AJ, 121, 2879
- Bloom et al. (2003) Bloom, J. S., Kulkarni, S. R., Clemens, J. C., Diercks, A., Simcoe, R. A., & Behr, B. B. 2003, Publ. Astr. Soc. Pacific, submitted
- Briggs et al. (1999) Briggs, M. S. et al. 1999, Astrophys. J., 524, 82
- Chevalier & Li (2000) Chevalier, R. A. & Li, Z. 2000, Astrophys. J., 536, 195
- Chornock et al. (2002) Chornock, R., Li, W., Filippenko, A. V., & Jha, S. 2002, GRB Circular Network, 1754, 1
- Cohen et al. (1998) Cohen, E., Piran, T., & Sari, R. 1998, ApJ, 509, 717
- Crew et al. (2002) Crew, G. et al. 2002, GRB Circular Network, 1734, 1
- Fox & Price (2002) Fox, D. W. & Price, P. A. 2002, GRB Circular Network, 1731, 1
- Fox et al. (2003) Fox, D. W. et al. 2003, Nature, submitted
- Frail et al. (2001) Frail, D. A. et al. 2001, ApJ, 562, L55
- Fruchter et al. (2002) Fruchter, A., Levan, A., Vreeswijk, P., Holland, S. T., & Kouveliotou, C. 2002, GRB Circular Network, 1781, 1
- Fynbo et al. (2001) Fynbo, J. U. et al. 2001, A&A, 369, 373
- Henden (2002) Henden, A. 2002, GRB Circular Network, 1753, 1
- Kobayashi (2000) Kobayashi, S. 2000, ApJ, 545, 807
- Kulkarni et al. (1999) Kulkarni, S. R. et al. 1999, Astrophys. J., 522, L97
- Li et al. (2002) Li, W., Filippenko, A. V., Chornock, R., & Jha, S. 2002, GRB Circular Network, 1737, 1
- Mészáros & Rees (1999) Mészáros, P. & Rees, M. J. 1999, Mon. Not. R. astr. Soc., 306, L39
- Matthews & Soifer (1994) Matthews, K. & Soifer, B. T. 1994, Experimental Astronomy, 3, 77
- Park et al. (2002) Park, H. S., Williams, G., & Barthelmy, S. 2002, GRB Circular Network, 1736, 1
- Persson et al. (1998) Persson, S. E., Murphy, D. C., Krzeminski, W., Roth, M., & Rieke, M. J. 1998, AJ, 116, 2475
- Pravdo et al. (1999) Pravdo, S. H. et al. 1999, Astron. J., 117, 1616
- Rhoads (1999) Rhoads, J. E. 1999, ApJ, 525, 737
- Ricker et al. (2002) Ricker, G. et al. 2002, ApJ, 571, L127
- Sari (1997) Sari, R. 1997, ApJ, 489, L37+
- Sari & Esin (2001) Sari, R. & Esin, A. A. 2001, ApJ, 548, 787
- Sari & Piran (1999a) Sari, R. & Piran, T. 1999a, Astrophys. J., 517, L109
- Sari & Piran (1999b) — 1999b, Astrophys. J., 520, 641
- Sari et al. (1999) Sari, R., Piran, T., & Halpern, J. P. 1999, ApJ, 519, L17
- Sari et al. (1998) Sari, R., Piran, T., & Narayan, R. 1998, ApJ, 497, L17+
- Schlegel et al. (1998) Schlegel, D. J., Finkbeiner, D. P., & Davis, M. 1998, ApJ, 500, 525
- Soifer et al. (1991) Soifer, B. T. et al. 1991, ApJ, 381, L55
- Vreeswijk et al. (2002) Vreeswijk, P., Fruchter, A., Hjorth, J., & Kouveliotou, C. 2002, GRB Circular Network, 1785, 1
- Wijers & Galama (1999) Wijers, R. A. M. J. & Galama, T. J. 1999, ApJ, 523, 177
- Wozniak et al. (2002) Wozniak, P. et al. 2002, GRB Circular Network, 1757, 1
| Date | Telescope | Filter | Magnitude | Error | |
|---|---|---|---|---|---|
| (UT) | (days) | ||||
| Dec 11.4854 | 0.0144 | P48 | Ra | 18.293 | 0.024 |
| Dec 11.4962 | 0.0252 | P48 | Ra | 18.813 | 0.045 |
| Dec 11.4997 | 0.0287 | P48 | Ra | 19.093 | 0.059 |
| Dec 11.5064 | 0.0354 | P48 | Ra | 19.343 | 0.071 |
| Dec 11.5120 | 0.0410 | P48 | Ra | 19.286 | 0.068 |
| Dec 11.5139 | 0.0429 | P48 | Ra | 19.479 | 0.077 |
| Dec 11.5218 | 0.0508 | P48 | Ra | 19.529 | 0.082 |
| Dec 11.5251 | 0.0541 | P48 | Ra | 19.598 | 0.086 |
| Dec 11.5270 | 0.0560 | P48 | Ra | 19.755 | 0.102 |
| Dec 11.5332 | 0.0622 | P48 | Ra | 19.950 | 0.110 |
| Dec 11.5399 | 0.0689 | P48 | Ra | 20.091 | 0.130 |
| Dec 11.5533 | 0.0823 | P200/IRcam | Ks | 18.01 | 0.150 |
| Dec 11.6025 | 0.1310 | SSO40/WFI | B | 21.877 | 0.138 |
| Dec 11.7083 | 0.2370 | SSO40/WFI | R | 21.096 | 0.128 |
| Dec 12.518 | 1.037 | P200/JCAM | g’ | 23.398 | 0.047 |
| Dec 12.518 | 1.037 | P200/JCAM | r’ | 23.416 | 0.073 |
| Dec 18.49 | 7.019 | K-I/NIRC | Ks | 22.12 | 0.18 |
| Dec 18.52 | 7.049 | K-I/NIRC | J | 22.77 | 0.11 |
| Dec 18.56 | 7.089 | K-I/NIRC | H | 22.48 | 0.16 |
| Date | Telescope | Frequency | Flux | Flux Error | |
|---|---|---|---|---|---|
| (UT) | (days) | (GHz) | (Jy) | (Jy) | |
| 2002 Dec 11.57 | 0.10 | VLA | 8.46 | 12 | 36 |
| 2002 Dec 12.39 | 0.92 | VLA | 8.46 | 36 | 22 |
| 2002 Dec 13.40 | 1.93 | VLA | 8.46 | 9 | 45 |
| 2002 Dec 13.40 | 1.93 | VLA | 22.5 | 48 | 62 |
| 2002 Dec 15.32 | 3.85 | VLA | 8.46 | 45 | 23 |
| 2002 Dec 16.29 | 4.82 | VLA | 8.46 | 6.5 | 19 |
| 2002 Dec 20.32 | 8.85 | VLA | 8.46 | 60 | 28 |
| 2002 Dec 22.26 | 10.79 | VLA | 8.46 | 0.3 | 27 |
| 2002 Dec 26.44 | 14.97 | VLA | 8.46 | 7.3 | 23 |
| 2002 Dec 28.55 | 17.08 | VLA | 8.46 | 33 | 28 |
| 2003 Jan 04.39 | 23.92 | VLA | 8.46 | 2.4 | 24 |
| 2003 Jan 06.28 | 25.81 | VLA | 8.46 | 46 | 24 |
| Dec 20–Jan 06 | VLA | 8.46 | 15 | 10 |