A Deep Chandra Catalog of X-ray Point Sources toward the Galactic Center
Abstract
We present a catalog of 2357 point sources detected during 590 ks of Chandra observations of the 17-by-17 arcminute field around Sgr A∗. This field encompasses a physical area of 40 by 40 pc at a distance of 8 kpc. The completeness limit of the sample at the Galactic center is erg s-1 (2.0–8.0 keV), while the detection limit is an order of magnitude lower. The 281 sources detected below 1.5 keV are mainly in the foreground of the Galactic center, while comparisons to the Chandra deep fields at high Galactic latitudes suggest that only about 100 of the observed sources are background AGN. The surface density of absorbed sources (not detected below 1.5 keV) falls off as away from Sgr A∗, in agreement with the distribution of stars in infrared surveys. This demonstrates the X-ray sources trace the general stellar population at the Galactic center. Point sources brighter than our completeness limit produce 10% of the flux previously attributed to diffuse emission. The distribution of the Galactic center sources is extremely steep (power-law slope ). If this distribution extends down to a flux of erg cm-2 s-1 ( erg s-1 at 8 kpc, 2.0–8.0 keV) with the same slope, then point sources would account for all of the previously reported diffuse emission. However, there are numerous diffuse, filamentary structures in the field that also contribute to the total flux, so the 2.0–8.0 keV luminosity distribution must flatten between erg s-1. Many types of stellar systems should be present in the field at the luminosities to which we are sensitive. However, the spectra of more than half of the Galactic center sources are very hard, and can be described by a power law () with photon index . Such hard spectra have been seen previously only from magnetically accreting white dwarfs (polars and intermediate polars) and wind-accreting neutron stars (pulsars), suggesting that there are large numbers of these systems in our field.
1 Introduction
The X-ray emission from galaxies is produced by a mixture of stellar sources at various phases of their life-cycles, diffuse interstellar plasma heated by supernovae and galactic collisions, and accretion onto super-massive black holes in galactic nuclei (see Fabbiano, 1989). With its 05 angular resolution, the Chandra X-ray Observatory is particularly well-suited to separating the diffuse and point-like components of this emission. Chandra observations can therefore be used to estimate more accurately the amount of hot, X-ray emitting interstellar matter in galaxies, and to trace the structures and star formation histories of galaxies using their stellar X-ray populations.
The total X-ray luminosity from galaxies that lack active nuclei is dominated by emission from neutron stars and black holes accreting from more ordinary stellar companions. These X-ray binaries have been observed in nearby galaxies with luminosities as low as erg s-1, allowing comparative studies of their luminosity distributions in galaxies with diverse star formation histories. For example, Kilgard et al. (2002) have established that galaxies with recent star formation contain relatively larger numbers of high-luminosity ( erg s-1) X-ray sources than do non-starburst and elliptical galaxies. This suggests that many of the brightest X-ray binaries are fed by massive, short-lived stars. On the other hand, the X-ray luminosity functions of the bulges of nearby spiral galaxies appear to be flatter than those of their disks (Kong et al., 2002b; Soria & Wu, 2002; Trudolyubov et al., 2002). This indicates that the bright end of the luminosity distribution is dominated by old systems with low-mass companions when the pool of very young stars is smaller.
All-sky surveys of our own Galaxy confirm that luminous ( erg s-1) X-ray binaries with high- and low-mass main-sequence companions reside in the Galactic disk and bulge, respectively (Grimm, Gilfanov, & Sunyaev 2002). However, Chandra observations can reveal sources in our Galaxy as faint as erg s-1 (e.g., Ebisawa et al., 2001b) at the Galactic center distance of 8 kpc (McNamara et al., 2000). Many additional types of stellar systems can be found down to this luminosity, (see Table A Deep Chandra Catalog of X-ray Point Sources toward the Galactic Center and references therein), which expands the possibility for using X-ray surveys to study stellar populations. X-rays from young stellar objects and cataclysmic variables can potentially be used to trace low-mass stars in regions of the Galactic disk and would complement current infrared surveys of luminous giants (Unavane & Gerard, 1998; Mezger et al., 1999). Likewise, surveys of X-rays from O stars, Wolf-Rayet stars, and young neutron stars could be used to constrain the history of star formation within the last years. This would be particularly important in the inner tens of parsecs of the Galaxy, where it is uncertain how the large tidal forces and the milliGauss magnetic fields affect star formation, and where many traditional observational tracers of
star formation have been difficult to find (Morris, 1993; Serabyn & Morris, 1996, Mezger, Duschl, & Zylka 1996). Faint X-ray sources have been used to study stellar populations only in small regions of the Galaxy, such as the Orion Nebula (e.g., Feigelson et al., 2002), the Arches cluster (Yusef-Zadeh et al., 2002), and several globular clusters (e.g., Pooley et al., 2002). Large-area surveys with Einstein (Hertz & Grindlay, 1984), ROSAT (Motch et al., 1997; Morley et al., 2001), and ASCA (Sugizaki et al., 2001) detected only the most luminous and nearby sources (see also Wang, Gotthelf, & Lang 2002), while a recent Chandra survey at tens of degrees from the Galactic center found that the population of faint X-ray sources was probably dominated by extra-galactic sources (Ebisawa et al., 2001b, a). Further Chandra observations of dense stellar fields to understand the distribution of faint X-ray sources are therefore warranted.
If the number of faint X-ray sources toward the Galactic plane could be accurately counted, it also would be possible to constrain better the energetics of the diffuse emission from the Galactic ridge (Koyama et al., 1986b; Yamauchi et al., 1996; Mukai & Shiokawa, 1993; Sugizaki et al., 2001). This diffuse emission appears to be a combination of relatively cool ( keV) thermal emission, and hotter ( keV) emission that may extend all the way to MeV energies (Koyama, Ikeuchi, & Tomisaka 1986a, Koyama et al., 1986b; Kaneda et al., 1997; Yamasaki et al., 1997; Skibo et al., 1997). The cool, thermal component can be explained as the integrated emission from unresolved supernova remnants (Koyama et al., 1986a). However, the temperature of the hot emission is much higher than that observed from supernova shocks, and it is too high for the plasma thought to produce it to be gravitationally bound to the Galactic disk (Worrall et al., 1982; Koyama et al., 1986b). If the plasma is unbound, the energy input required to sustain this hard Galactic ridge emission is approximately erg s-1, equivalent to the kinetic energy of one supernova occurring every 30 years (Valinia & Marshall, 1998). This input would have to be provided by exotic processes, such as cosmic-ray interactions with the ISM (Valinia & Marshall, 1998, Tanaka, Miyaji, & Hasinger 1999) or magnetic reconnection driven by turbulence in the ISM (Tanuma et al., 1999). No candidate population of point sources has yet been identified that could significantly lessen the energetic requirements on the plasma. Chandra observations at and indicate that only 10% of the hard Galactic ridge emission can be accounted for by X-ray point sources brighter than erg s-1 (Ebisawa et al., 2001b). However, fainter sources could still contribute significantly to the diffuse emission (see Table A Deep Chandra Catalog of X-ray Point Sources toward the Galactic Center), if they are present in large numbers.
The nucleus of our Galaxy is an ideal location to explore these topics, since both the stellar density (Mezger et al., 1996) and the surface brightness of diffuse X-ray emission (Kaneda et al., 1997; Koyama et al., 1996; Sidoli & Mereghetti, 1999) increase dramatically there. The Galactic center has been the object of observations with Einstein (Watson et al., 1981), GRANAT (Pavlinsky, Grebenev, & Sunyaev 1994), ROSAT (Predehl & Truemper, 1995, Sidoli, Belloni, & Mereghetti 2001), BeppoSAX (Sidoli et al., 1999), and ASCA (Sakano et al., 2002), all of which revealed several bright ( erg s-1) point sources and emission from the Sgr A complex. Chandra was the first instrument to resolve the X-ray emission from the accreting black hole Sgr A∗ from the surrounding early-type stars, the remnant of a erg explosion (Sgr A East; Maeda et al., 2002), and numerous filamentary features (Baganoff et al., 2001, 2003). Over 150 point sources were also detected in the 17′ by 17′ field, down to a limiting flux of erg cm-2 s-1 ( erg s-1 at 8 kpc; Baganoff et al., 2003).
Recent observations have increased the Chandra exposure of the 20 pc around Sgr A∗ by a factor of 6, to 626 ks. In this paper, we present a catalog of 2357 X-ray point sources detected in this field. In Section 2, we describe the observations and our source detection method (Section 2.1), our technique for computing the photometry of the sources (Section 2.2), and our estimates of the completeness of the survey (Section 2.3). In Section 3, we report the spatial distribution (Section 3.1), flux distribution (Section 3.2), confusion limit (Section 3.3), and spectral properties (Sections 3.4 and 3.5) of the sources. In Section 4, we discuss how the numbers of sources at the Galactic center compare to populations elsewhere in the Galactic disk and to background AGN (Section 4.1), the contribution of point sources to the diffuse emission from the Galactic center (Section 4.2), and the possible nature of the point sources (Section 4.1).
2 Observations and Data Analysis
Twelve separate pointings toward the Galactic center have been carried out using the Advanced CCD Imaging Spectrometer imaging array (ACIS-I) aboard the Chandra X-ray Observatory (Garmire et al., 2002), in order to monitor Sgr A∗ (Table 2). The ACIS-I is a set of four 1024-by-1024 pixel CCDs, covering a field of view of 17′ by 17′. When placed on-axis at the focal plane of the grazing-incidence X-ray mirrors, the imaging resolution is determined by the pixel size of the CCDs, 0492. The CCDs also measure the energy of incident photons, with a resolution of 50-300 eV (depending on photon energy and distance from the read-out node), within a calibrated energy band of 0.5–8 keV.
We reduced the data starting with the level 1 event files provided by the Chandra X-ray Center (CXC). We first removed the pixel randomization applied by the default processing software. We then corrected the pulse heights of each event for the position-dependent charge-transfer inefficiency caused by radiation damage early in the mission, using software provided by Townsley et al. (2000). We excluded most events flagged as possible background, but left in possible cosmic ray afterglows because they are difficult to distinguish from genuine X-rays from the strong diffuse emission and numerous point sources in the field. We applied the standard ASCA grade filters to the events, as well as the good-time filters supplied by the CXC. We examined each observation for background flares, and removed intervals of strong flaring from ObsID 0242 (10 ks), ObsID 2943 (3 ks), and ObsIDs 2953, 3392, and 3393 (each ks). The final exposure time was 626 ks. Finally, we applied a correction to the absolute astrometry of each pointing, using three Tycho sources detected strongly in each Chandra observation (compare Baganoff et al., 2003). The astrometric accuracy of our final pointing solution is better than 03, although the accuracy of positions derived for individual sources decreases significantly far from the aim point (see Section 2.1).
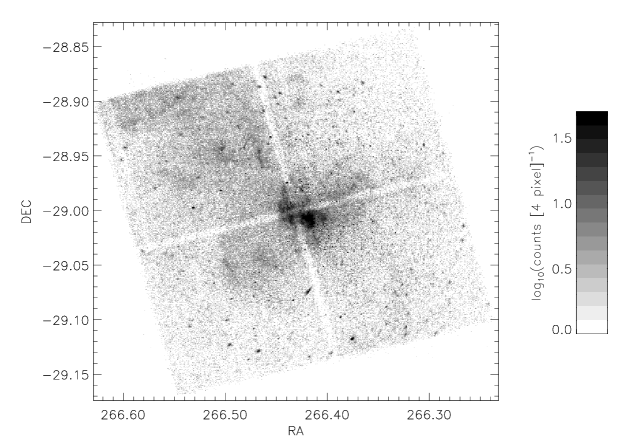
In order to produce a single composite image, the sky coordinates of the events from each observation were re-projected to the tangent plane at the radio position of Sgr A∗
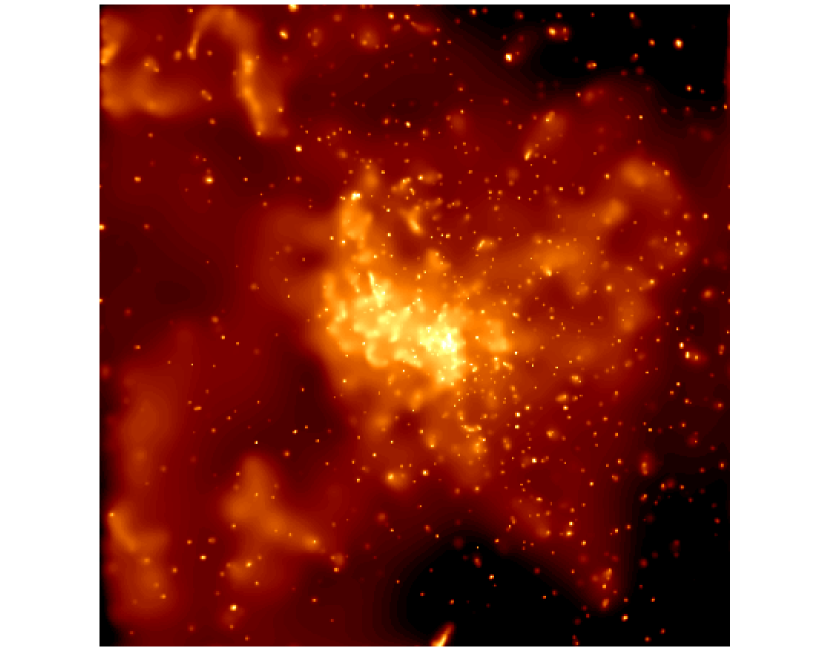
(17h 45m 40.0409(9)s, -29∘00′28118(12); Reid et al., 1999), and the event lists were combined. Images of the composite event list are displayed in Figure 1. We excluded ObsID 1561a (2000 October 26; Table 2), because it contained a bright transient with a large dust scattering halo and instrumental readout streak.111The transient is probably GRS 1741.92853, which we place at J2000 17h 45m 2s, -28∘54′51″ with an uncertainty of 5″; compare Pavlinsky et al. (1994). Exposure maps were created assuming a monochromatic incident spectrum with a photon energy of 3 keV, which is the approximate energy at which the largest number of photons are detected. In Figure 2, we display a version of the inner part of the image that has been corrected for exposure variations over the field, and then adaptively smoothed using the program csmooth.
2.1 Source Detection
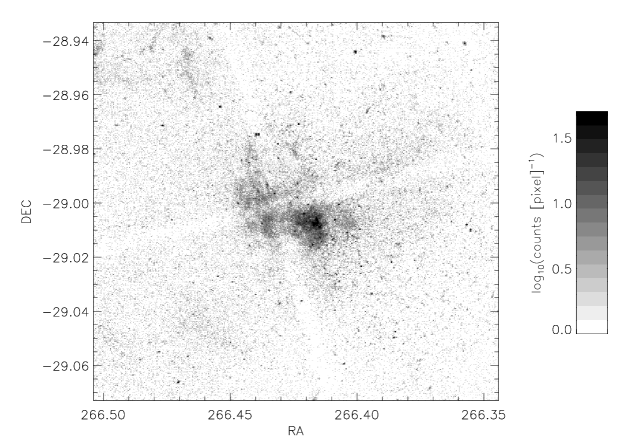
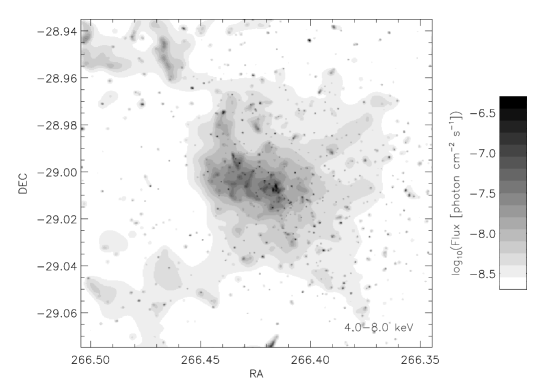
We used the combined event list (excluding ObsID 1561a) to search for point sources in three energy bands: a full band extending from 0.5–8 keV, a soft band from 0.5–1.5 keV, and a hard band from 4–8 keV. Smoothed images of the soft and hard energy bands are shown in Figure 3. For the purposes of source detection only, we removed events that had been flagged as possible cosmic ray afterglows. We employed the routine wavdetect (Freeman et al., 2002), using the default “Mexican Hat” wavelet. We searched a series of three images using sequences of wavelet scales that increased by a factor of : a central, un-binned image of 8.5′ by 8.5′ searched from scales 1–4, an image binned by a factor of two to cover 17′ by 17′ searched from scales 1–8, and an image binned by a factor of four to cover the entire field searched from scales 1–16 (since observations were taken with slightly different aim points and roll angles). Each image was designed to be most sensitive to point sources located at successively larger field offset angles, since the 90% encircled energy contour of the point-spread function (PSF) at 4.5 keV grows from 2″ near the aim point, to 15″ at 10′ from the aim point (see the Chandra
Proposers’ Observatory Guide).
We used a sensitivity threshold of , which was determined via Monte-Carlo simulations to be the chance of detecting a spurious source per pixel if the local background is spatially uniform (Freeman et al., 2002). Since the strongly varying diffuse emission in our field invalidates this assumption, we can not be sure of the true significance that this threshold represents (compare Section 2.2). However, this threshold is conservative (compare Brandt et al., 2001; Feigelson et al., 2002), so there should be few spurious sources in our sample.222In addition, the extra sources that would be detected with looser detection thresholds would be too faint for meaningful spectral analyses (Section 3.4), and the uncertainties on their fluxes would be too large to use them to constrain the distribution (Section 3.2). We combined the source lists generated from each image, including only the sources from the images with higher resolution in the regions that overlapped. When combining the candidate sources from the separate energy bands, we gave priority to the source positions determined in the full band, and considered two sources to be the same if they were separated by less than one-half the 90% encircled energy radius of the PSF at
that position. We find that this strikes a good balance between preventing spurious associations between unrelated sources given the uncertainties on the source positions (see the next paragraph), and our ability to compute the photometry separately for two nearby sources (see Section 2.2). Given the increase in density of sources that we find in this field toward Sgr A∗ (see Section 3.1) and the size of the PSF as a function of field offset angle, there is a 1% chance that a second source will lie within one-half the radius of the PSF for any given source near Sgr A∗, declining to 0.1% at large field offset angles. Finally, we manually removed a few dozen sources that were obviously part of extended, filamentary X-ray features.
With the above method, we found a total of 2357 X-ray point sources. Of these, 1792 are detected in the full band, 281 in the soft band (124 are exclusively in the soft band), and 1832 in the hard band (441 exclusively in the hard band). Only 19 sources are detected in all of the soft, hard, and full bands. Since the absorption column toward the Galactic center is very high ( cm-2 of H; see Baganoff et al., 2003), we expect that very few sources at the Galactic center will be detected below 1.5 keV. For instance, using the Portable Multi-Mission Simulator (PIMMS), we estimate that a erg s-1 source with a 6 keV thermal plasma spectrum (e.g. a bright binary system containing two Wolf-Rayet stars in Table A Deep Chandra Catalog of X-ray Point Sources toward the Galactic Center) that is absorbed by a column of cm-2 and scattered by an equal column of dust will produce only 3 counts between 0.5-1.5 keV in a 600 ks ACIS-I observation. Therefore, even the brightest soft sources are undetectable below 1.5 keV if they lie at the Galactic center. For the remainder of the paper, we refer to the 281 sources detected in the soft band as foreground sources, and the rest as sources at or beyond the Galactic center. We have listed the locations of the 2357 point sources in the electronic version of Table 3; the print version lists the brightest 25 sources in order to provide a sample of the contents of the full table.
The accuracy of the positions of individual sources varies significantly over the field, because of variations in the size and shape of the PSF. We have cross-correlated the foreground X-ray sources with stars from the USNO catalog, and find that 148 X-ray sources have optical counterparts, on order 20 of which could be spurious. From the distribution of offsets between the optical and X-ray matches, we estimate that the uncertainties on the positions in Table 3 are as small as 03 within 1′ of the aim point, about 05 at 4′, and as large as 2″ – 5″ at 8′ – 12′ from the aim point. This is consistent with the results of Brandt et al. (2001)

2.2 Photometry
We used the acis_extract routine (Broos et al., 2002) from the Tools for X-ray Analysis (TARA333http://www.astro.psu.edu/xray/docs/TARA/) to compute the photometric properties of each source. We extracted event lists for each source for each observation, using a polygonal region generally chosen to match the contour of 90% encircled energy from the PSF. We used a PSF at the fiducial energy of 1.5 keV for foreground sources, while we used a larger extraction area corresponding to an energy of 4.5 keV for Galactic center sources. If two sources were separated by less than twice the radius of the 90% contour, we extracted source counts from smaller regions that did not overlap each other. The smallest extraction region we used matched the 70% encircled energy contour; we note that the photometry for sources extracted using this contour could be inaccurate due to source confusion. Both the PSF fraction and PSF energy are listed in Table 3.
For each source, a background event list was extracted from a circular region centered on the point source, excluding from the event list (i) counts in circles circumscribing the 95% contour of the PSF around any point sources and (ii) bright, filamentary structures. The size of each background region was chosen such that it contained approximately 1200 total events for the 12 observations. We also computed the effective area function (ARF) and exposure time at the position of each source for each observation. We corrected the ARF to account for the fraction of the PSF enclosed by the extraction region, and for the hydrocarbon build-up on the detectors444http://cxc.harvard.edu/cal/Acis/Cal_prods/qeDeg/.
The source and background event lists were used to compute photometry for each source in four energy bands: 0.5–2.0 keV, 2.0–3.3 keV, 3.3–4.7 keV, and 4.7–8.0 keV. The first band was chosen with an upper limit of 2 keV, because the shape of the ARF presents a natural break due to the telescope’s Ir edge, and because below this value most sources at the Galactic center are dim due to absorption. To define the three higher energy bands, we summed all of the counts in the Sgr A* field above 2 keV, and divided them into three energy bands with equal numbers of counts. We note that this results in unconventional boundaries for our energy bands. In any case, the extremely high absorption toward the Galactic center would make it difficult to compare our results to those in other fields, such as the extra-galactic deep fields (Brandt et al., 2001; Rosati et al., 2002) or globular clusters (Pooley et al., 2002). The total counts, estimated background, and mean value of the ARF in each energy band are listed for the entire sample in the machine-readable version of Table 3.
The net counts in each energy band were computed from the
total counts in the source region less the estimated background.
The uncertainties on the net counts were computed by summing the squares of
the 1- upper limits (see Equation 9 in Gehrels, 1986) from both the
source and background counts. We also computed 90% confidence intervals
through a Bayesian analysis, with the simplifying assumption that the
uncertainty on the background was negligible (Kraft, Burrows, & Nousek, 1991). If the 90%
confidence interval on the net counts was consistent with 0, we used
the 90% upper limit as the uncertainty,
![[Uncaptioned image]](/html/astro-ph/0301371/assets/x8.png) Figure 6: Top panel: Histogram of the number of sources as a function
of the net counts detected in the full band (0.5–8.0 keV). Bottom panel:
Histogram of the number of sources as a function of photon flux in the
full band. Galactic center sources are indicated with the solid lines,
for which 1 photons cm-2 s-1 erg cm-2 s-1 (2.0–8 keV).
Foreground sources (detected below 1.5 keV) are indicated with the
dashed lines, for which 1 photons cm-2 s-1 erg cm-2 s-1 (0.5–2.0 keV). The luminosities of the Galactic center sources
range between and erg s-1 for a distance of 8 kpc
(McNamara et al., 2000).
Figure 6: Top panel: Histogram of the number of sources as a function
of the net counts detected in the full band (0.5–8.0 keV). Bottom panel:
Histogram of the number of sources as a function of photon flux in the
full band. Galactic center sources are indicated with the solid lines,
for which 1 photons cm-2 s-1 erg cm-2 s-1 (2.0–8 keV).
Foreground sources (detected below 1.5 keV) are indicated with the
dashed lines, for which 1 photons cm-2 s-1 erg cm-2 s-1 (0.5–2.0 keV). The luminosities of the Galactic center sources
range between and erg s-1 for a distance of 8 kpc
(McNamara et al., 2000).
although we retained the most likely flux even if it was negative. Histograms of the number of sources as a function of the net counts in each energy band are displayed in Figure 5 (solid lines). Those sources with only upper limits are represented with the dotted lines, and the median numbers of background counts in the source regions are indicated with the vertical dashed lines. Note that the photometry for sources with a small number of net counts in a given energy band (typically less than 5 counts) may be unreliable, as there are comparable systematic uncertainties in the background estimates due to the spatially varying diffuse emission. The net counts in the full 0.5–8.0 keV energy band are listed for the entire sample in the electronic version of Table 3, and for the brightest 25 sources in the print version. A histogram of the number of foreground (dashed line) and Galactic center (solid line) sources as a function of the net counts is displayed in the top panel of Figure 2.2.
We computed approximate photon fluxes (in units of photons cm-2 s-1) for each source by dividing the net counts in each sub-band by the total live time (units of s) and the mean value of the ARF in that energy range (units of cm2; note that this value incorporates variations in exposure due to chip gaps and dead columns). The photon fluxes in each band are listed in Table 3, along with uncertainties or upper limits. The photon fluxes in the 2.0–8.0 keV energy band used throughout the paper are the sums of those in the sub-bands, using negative values when they occur (not the upper limits). Since the energy bands sampled the ARF for the ACIS-I detector well, the approximate photon fluxes that we computed differed from those derived from later spectral fits using XSPEC (Section 3.5) by no more than the uncertainty expected from Poisson counting noise.
A histogram of the number of sources as a function of the 0.5–8.0 keV photon flux is presented in the bottom panel of Figure 2.2. Galactic center sources are indicated with the solid line, and foreground sources with the dashed line. Sources are detected with photon fluxes as low as photons cm-2 s-1. The largest number of Galactic center sources is detected near photons cm-2 s-1 (2.0–8.0 keV), and the largest number of foreground sources is found near photons cm-2 s-1 (0.5–2.0 keV). Since we become less sensitive to detecting sources at positions far from the aim point (see Section 2.3), the smaller number of sources at low fluxes probably occurs because of incompleteness.
We used the spectral models from Section 3.5 to compute an average conversion factor between photon and energy flux. For Galactic center sources (not detected below 1.5 keV), we find that for the typical power-law spectrum absorbed by a column equivalent to cm-2 of H, an absorbed flux of 1 photons cm-2 s-1 erg cm-2 s-1 (2.0–8.0 keV). The unabsorbed flux is approximately 50% larger. For sources detected below 1.5 keV, we find that 1 photons cm-2 s-1 erg cm-2 s-1 between 0.5–2.0 keV. The absorption for these sources is relatively small ( cm-2).
2.3 Solid Angle of the Survey
In order to make quantitative statements about the spatial and luminosity distributions of the sources in this sample, it was necessary to understand the limiting flux at which we could reliably measure the flux from a source as a function of position on the sky. The signal-to-noise ratio with which we measure the flux from a source is , where is the net number of counts from a source, and is the uncertainty on the background in the source region. This definition is simply the flux divided by its uncertainty in Table 3, although here we make the simplifying assumption of uncertainties. The net counts are related to the flux from the source by , where is the effective area of the detector, and is the exposure time. For simplicity, the background can be written as the product of the background per pixel and the area of the PSF , . To obtain a conservative estimate of our flux limit, we will take , although in practice we determine the background over an area that is times larger than the source extraction region, which lowers significantly. The signal-to-noise of the source then can be written as
| (1) |
If we observe down to a well-defined signal-to-noise, we can then invert Equation 1 to derive position-dependent flux limits for our image
| (2) |
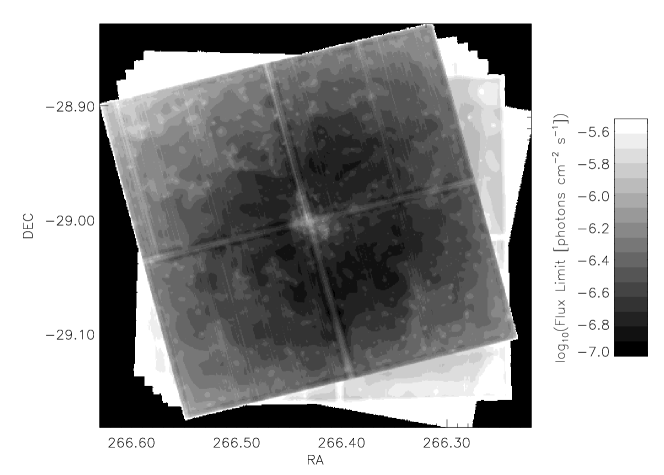

(compare Manners et al., 2002). Figure 7 illustrates a map of the limiting flux available at each position in our image for , as defined by Equation 2.
The map takes into account the varying background level, exposure, effective detector area, and PSF area over the field. The background level was estimated by removing circular regions containing the point sources, filling the resulting holes in the image with a Poisson distribution of counts that matches a surrounding annulus using dmfilth, and smoothing the final image using the routine csmooth. The diffuse features in the background increase the flux limit, which is particularly evident around the Sgr A complex just below and to the right of the center of the image. The exposure and effective area were estimated using standard CIAO tools. These produce the bright cross due to the gaps between the CCDs and the vertical stripes due to bad columns excluded in the analysis. The PSF area was determined from the 90% encircled energy contours used to extract the point sources. The increasing size of the PSF with field offset angle causes the steady increase in limiting flux at the edges of the image.
Figure 2.3 displays the solid angle observed as a function of limiting flux for and , which we computed by summing the pixels in the flux map image (Figure 7). The solid angle of our survey at low fluxes is strongly dependent on our assumed signal-to-noise. We believe that we have detected all sources with , based on the peak in the number of sources detected as a function of flux (Figure 2.2). On the other hand, is the limit at which we know the flux from a source with enough accuracy to determine the slope of the number count distribution (Murdoch, Crawford, & Jauncey 1973).
3 Results
3.1 Spatial Distribution

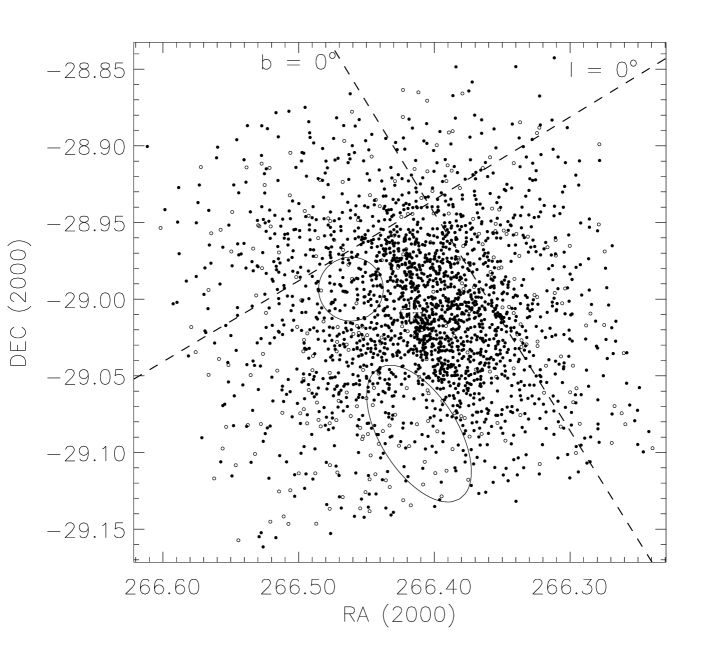
Figure 4 illustrates the spatial distribution of sources detected in the field, without correcting for the decreasing sensitivity of the instrument at larger field offsets from the aim point. An east-west asymmetry is evident about the Galactic center. The deficit of sources to the east of Sgr A∗ corresponds to the locations of two molecular clouds, M and M, which are indicated schematically by the two ovals in Figure 4 (Güsten, Walmsley, & Pauls 1981; Mezger et al. 1996). The clouds are thought to lie in or in front of the Galactic center (Zylka, Mezger, & Wink 1990), and therefore probably obscure X-ray sources that lie beyond them. They have mean column densities of cm-2, which is a factor of five higher than the mean Galactic value (Zylka et al., 1990). This would reduce the observed flux in the Chandra bandpass by 30%, which would decrease the number of sources observed by 65% given the luminosity distribution of Galactic center sources (see Section 3.2). Fewer sources are also detected near Sgr A East, probably because the strong diffuse emission masks the emission from point sources.
At about 8′ from the aim point, we estimate that we can detect all sources with a photon flux greater than photons cm-2 s-1 with a signal-to-noise of at least in the 2.0–8.0 keV band (compare Figures 2.2, 7, and 2.3). About 40% of the Galactic center sources detected within 8′ of Sgr A∗ have photon fluxes greater than this value. In Figure 9 we plot the number of Galactic center sources above this flux limit per unit solid angle as a function of angular separation from Sgr A*. We have fit this distribution with a power law of the form
| (3) |
where is the angular separation in arcminutes. Both the normalization and the power-law slope were allowed to vary. The resulting fit is acceptable, with a of 26 for 30 degrees of freedom. If we assume that these sources are distributed with spherical symmetry about the Galactic center, the implied spatial density falls off with radius as .
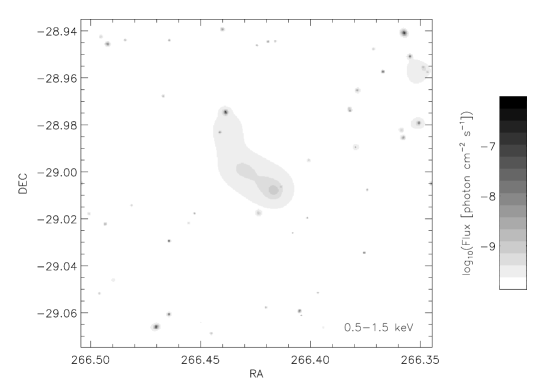
The background in the soft band is much lower, so foreground sources can be detected reliably down to a limit of photons cm-2 s-1 in the 0.5–2.0 keV band with a signal-to-noise of . There are 120 soft sources detected above this flux limit in the inner 8′ of the field. We have compared the radial distribution of foreground sources to a uniform distribution using a KS-test, and find that there is only a 55% chance that the two are different. Assuming the distribution is uniform, the mean surface density is sources arcmin-2, with a standard deviation of 0.2 sources arcmin-2. The foreground sources probably all reside in the Galactic disk, which should exhibit no significant radial density gradient in this 17′ field. However, some inhomogeneities in the surface density should be expected from spatial variations in the absorption column

throughout this field.
3.2 Flux Distribution
In Figure 10, we plot both the cumulative and the differential number counts as a function of flux for sources at the Galactic center (filled circles) and in the foreground (open circles), normalized to the solid angle of the survey in units of arcmin-2. We have been conservative in our source selection to avoid incompleteness in our sample caused by the varying sensitivity over our image (Figure 7). Table 4 lists the criteria used to select sources for this distribution. First, sources in a given flux range are required to lie within a maximum field offset angle. This criterion accounts for the increasing PSF size with field offset, which causes our sensitivity to decrease. Second, the flux limit derived from Equation 2 at the position of each source is required to be smaller than the value in Table 4 for that field offset angle. This excludes regions of high background, detector chip gaps, and bad CCD columns. The solid angles over which sources from each flux limit are acceptable are listed in Table 4, as well as the number of sources accepted in each flux range. Note that only about one-third of both the foreground and Galactic center sources detected in our image satisfy the above selection criteria, since the high background in the image adds significant uncertainty to our flux measurements. The distribution is constructed from the number of sources in a flux interval , divided by the size of the flux interval , divided by the solid angle of the survey at that flux. The flux interval is computed in units of photons cm-2 s-1. Finally, since the surface density of Galactic center sources decreases with increasing field offset, we normalized the numbers of hard sources in each flux range to the mean surface density in the largest 9′ survey area. The cumulative distribution is simply the integral of the differential distribution.
Using the un-binned flux values, we modeled the distributions using the maximum likelihood technique described in Murdoch et al. (1973). The Galactic center sources were not consistent with a single power-law distribution of the form
| (4) |
Therefore, guided roughly by the differential counts in Figure 10, we divided the distribution into two flux ranges, less than and greater than photons cm-2 s-1. These regions were consistent with power laws of the forms
| (5) |
where is in units of photons cm-2 s-1, and the normalization is in units of sources arcmin-2. The normalizations of each model distribution are set to the mean value that would be expected over the full 9′ survey area, given that the observed stellar density falls off approximately as . We take Equation 5 as a rough approximation of the distribution of the Galactic center sources.
Since the surface density of hard sources is strongly peaked at the Galactic center, it is reasonable to assume that most of them are within the nuclear bulge and hence at the same distance, kpc (Mezger et al., 1996, see also Section 3.1). As a result, if the photon fluxes can be converted to unabsorbed energy fluxes, this cumulative number–flux distribution would represent the intrinsic luminosity distribution of the sources. Unfortunately, the absorption varies significantly from source to source, so significant uncertainties would be introduced in converting this to a luminosity distribution. Moreover, the physical meaning of the slopes of the distributions is at the moment unclear, since we have not yet identified the nature of the sources. Therefore, we have made no attempt to match the normalizations of these two model distributions exactly, nor did we attempt to derive more rigorously the position of the break in the distribution.
The flux distribution of the foreground sources in Figure 10 (open circles) was similarly modeled. Only the soft band (0.5–2.0 keV) was used in computing the flux, since this minimizes the background. The power law determined from the maximum likelihood technique was
| (6) |
where is again in photons cm-2 s-1, and the normalization is sources arcmin-2. This distribution is much flatter than that at the Galactic center.
3.3 Confusion Limit
Despite the large number of sources in this image, we are still far
from being confusion-limited. Hogg (2001) demonstrated that for
steep () number count distribution, fewer than 10%
of sources will be affected by confusion if there are fewer than one source
per 50 “beams”. Here, a beam is defined to have an area
, where is the
full-width half-maximum of the PSF. In the inner 1′ of the
image in Figure 1,
there are 13 sources arcmin-2 with fluxes higher than
photons cm-2 s-1 (Equation 3). Since for Chandra is only 05 near the aim point, there is approximately once source
per 2000 beams in the densest part of our image. The confusion limit will
not be reached until the surface density increases by a factor of 40. From
Equation 5, we would have to observe to a completeness limit
a factor of 9 lower in order for confusion to be important.
On the other hand, at an offset of 8′from the aim point, the
spatial density of sources is 1.7 per arcmin (Equation 3), and
![[Uncaptioned image]](/html/astro-ph/0301371/assets/x13.png) Figure 11:
Histogram of hardness ratios from sources that are detected with greater than
90% confidence in each relevant energy band.
The hardness ratios are defined according to , where are the
counts in a low energy band, and are the counts in a high energy band.
The soft color is
defined as the fractional difference between counts with energies
between 2.0–3.3 keV and 0.5–2.0 keV, the medium color using counts
between 3.3–4.7 keV and 2.0–3.3 keV, and the hard color using counts
between 4.7–8.0 keV and 3.3–4.7 keV. Foreground
sources are indicated with the dashed histogram, while Galactic center
sources are indicated with the solid histogram.
Figure 11:
Histogram of hardness ratios from sources that are detected with greater than
90% confidence in each relevant energy band.
The hardness ratios are defined according to , where are the
counts in a low energy band, and are the counts in a high energy band.
The soft color is
defined as the fractional difference between counts with energies
between 2.0–3.3 keV and 0.5–2.0 keV, the medium color using counts
between 3.3–4.7 keV and 2.0–3.3 keV, and the hard color using counts
between 4.7–8.0 keV and 3.3–4.7 keV. Foreground
sources are indicated with the dashed histogram, while Galactic center
sources are indicated with the solid histogram.
″, which implies that there is one source per 200 beams. Thus, the outer edges of the image will become confusion limited if our completeness limit reaches a factor of 2 lower. Therefore, both the photometry and the positions of the X-ray sources in this sample are reliable over the entire image.
3.4 Hardness Ratios
We used the counts in each energy band to compute three hardness ratios, which we used to characterize the absorption column toward each source and the steepness of the high-energy portion of each spectrum. The ratios are defined as the fractional difference between the count rates in two energy bands, , where and are the numbers of counts in the higher and lower energy bands, respectively. The resulting ratio is bounded by and . The soft color is defined by the fractional difference between counts with energies between 2.0–3.3 keV
and 0.5–2.0 keV; the medium color using counts with energies between 3.3–4.7 keV and 2.0–3.3 keV, and the hard color using counts between 4.7–8.0 keV and 3.3–4.7 keV. The hardness ratios are listed in Table 3, with uncertainties calculated according to Equation 1.31 in Lyons (1991; page 26). Histograms of the hardness ratios for sources that are detected with greater than 90% confidence in each relevant energy band are plotted in Figure 3.3. We indicate separately sources in the foreground (dashed line) and at the Galactic center (solid line). By design, the foreground sources tend to have lower soft colors than the Galactic center sources, indicating more photons are received at low energies. Relatively few Galactic center sources are detected with 90% confidence in the 0.5–2.0 keV band by definition, so the soft colors have limited usefulness. The medium and hard colors provide more information about Galactic center sources.
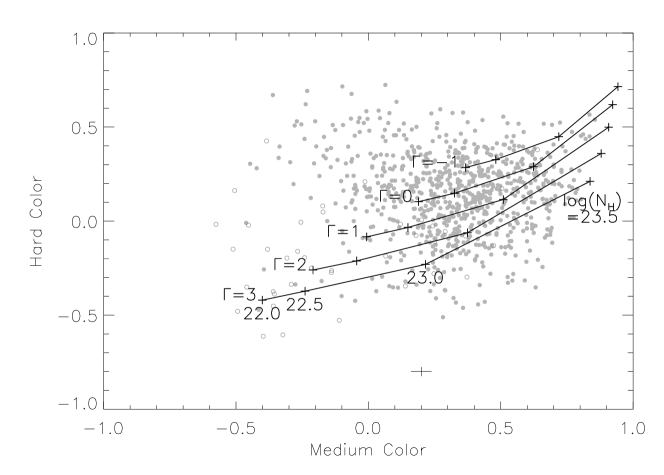
We have calculated the hardness ratios that we would expect to get from these energy bands for a variety of spectra using PIMMS. Variations in the soft color are dominated by differences in the absorption column toward the source, although we find that sources with column densities greater than cm-2 would have too few counts to be detected reliably below 2 keV. The hard color is determined almost exclusively by the temperature or steepness of the spectrum above 4 keV, as long as the absorbing column is less than about cm-2 of H. The medium color is affected by both the absorbing column and the intrinsic spectral shape. In order to examine the spectra further, in Figure 12 we compare the medium and hard colors of the point sources with those expected from a set of simulated absorbed power-law spectra (of the form ). We have indicated Galactic center sources by filled circles, and foreground sources with open circles. All sources detected with 90% confidence in the three energy bands above 2 keV are included in the plot, which amounts to 785 Galactic center sources and 39 foreground sources.
About half of the Galactic center sources cluster in a region consistent with absorption columns , and very flat spectra with photon indices (where negative values indicate rising numbers of photons with energy). Such hard spectra are unusual for X-ray point sources (see Table A Deep Chandra Catalog of X-ray Point Sources toward the Galactic Center). Simulations with PIMMS indicate that the thermal models expected for many of the classes of sources in Table A Deep Chandra Catalog of X-ray Point Sources toward the Galactic Center — e.g. ionized plasma with keV, blackbodies with keV, or Bremsstrahlung emission with keV — all produce hard colors less than 0.1. We have confirmed that the X-ray spectra of most of the Galactic center sources are intrinsically hard (as opposed to resulting only from high absorption) using the spectral fits reported in the next section.
3.5 Spectra
We modeled the spectra of sources with more than 80 net counts in the full band (approximately photons cm-2 s-1 between 0.5–8.0 keV) using simple models in XSPEC. The models consisted of a blackbody, bremsstrahlung, or power-law continuum multiplied by

factors to account for interstellar absorption with column density and dust scattering with optical depth . The column depth of dust was set to (Baganoff et al., 2003), and the halo size to 100 times the PSF size. We found that most of the sources that we modeled, 436 of 565, could be adequately fit (at least a 10% chance of exceeding the observed randomly) with an absorbed power law. The power-law models were not adequate for brighter sources with strong line emission, and for very soft sources. The bremsstrahlung and blackbody models succeeded only slightly less often, but more than half the time the temperatures obtained were extremely hot ( keV for bremsstrahlung or keV for blackbodies). A full exploration of the spectra of the point sources is beyond the scope of the current paper, but these preliminary spectral fits do confirm the results from our analysis of hardness ratios.
Four example spectra with a range of photon indices are displayed in Figure 13. Panel a displays a highly absorbed source with a relatively soft spectrum above 3.5 keV ( power law, or a hard color of ). Panel b exhibits a foreground source, which can be identified by its copious emission below 2 keV. This spectrum is adequately modeled with a power law of photon index , and has a hard color of . Panels c and d illustrate spectra from two very hard sources that have best-fit power laws of slope (hard color 0.16) and (hard color 0.57), respectively. Visual inspection confirms the hardness of the spectra, because these sources have as much or more flux above 5 keV than the other two sources, but less flux between 3.3–4.7 keV. The source in panel d also exhibits copious iron emission, so that the power law fit to this source is statistically unacceptable. Including a line of equivalent width 0.8 keV at 6.9 keV produces an acceptable fit, and increases the photon index to . We conclude that hard colors in Figure 12 reflect either spectra with photon indices (e.g. Figure 13 c), or in rarer instances sources with strong line emission (Figure 13 d).
4 Discussion
This 590 ks exposure of the 17′ by 17′ region around Sgr A∗ contains the largest number of sources ever detected in a single field by an X-ray instrument. This sample is an order of magnitude larger than previous X-ray surveys of the Galactic plane with Einstein (Hertz & Grindlay, 1984), ROSAT (Motch et al., 1997; Morley et al., 2001), and ASCA (Sugizaki et al., 2001). Previous observations of the Galactic center with other X-ray telescopes only revealed 17 sources in this field (Watson et al., 1981; Pavlinsky et al., 1994; Predehl & Truemper, 1995; Sidoli et al., 1999, 2001; Sakano et al., 2002), whereas we have resolved over 2000 sources.
4.1 Numbers of Sources
The surface density of sources observed in this field is extremely high. Above our completeness limit of erg cm-2 s-1, we estimate that there are approximately 15,000 sources deg-2 in the 2.0–8.0 keV energy band in the inner 9′ toward the Galactic center (Equations 3 and 5, and Figure 10). This surface density of sources is much higher than that of extra-galactic sources observed in fields far from the Galactic plane (Brandt et al., 2001; Rosati et al., 2002). Using the distribution of Brandt et al. (2001) and accounting conservatively for the 30% reduction in the flux from background sources due to the cm-2 of absorption toward the Galactic center, we would expect 630 extra-galactic sources deg-2 above our completeness limit. This implies that only 4% of the absorbed sources brighter than erg cm-2 s-1 should be AGN. Applying the same computation at our detection limit of erg cm-2 s-1, we find that only 1% of the sources should be AGN. Thus, we estimate that between 20–100 of the 2076 sources detected only above 2 keV are background AGN. The density of hard sources toward the Galactic center is also about 50 times higher than that inferred by Ebisawa et al. (2001a) in a field with similarly high absorption ( cm-2 of H) at , down to the same flux limit.
We find that the spatial density of Galactic center X-ray sources increases as approaching Sgr A∗ (assuming spherical symmetry; see Equation 3 and Figure 9). The density of stellar sources observed in the infrared also increases dramatically in the inner 300 pc of our Galaxy, which is referred to as the nuclear bulge (Mezger et al., 1996). Within the inner 30 pc of the nuclear bulge, the infrared population increases in space density approximately as , where is the distance from the Galactic center (Serabyn & Morris, 1996). Thus, the spatial distributions of X-ray and infrared sources are quite similar. This implies that these X-ray sources lie primarily in the nuclear bulge, and that their spatial distribution traces that of infrared stars.
Foreground sources (detected below 1.5 keV) have a mean surface density of 1800 sources deg-2 above erg cm-2 s-1 (0.5–2 keV; Figure 10). These soft sources are distributed uniformly over the field (Figure 4), as would be expected if they lie in the Galactic disk. However, the density of soft sources in this field is lower than that of Ebisawa et al. (2001a), who detected 183 soft sources down to a limiting flux of erg cm-2 s-1 in a 250 arcmin2 field at . This density, 2600 sources deg-2, is over 3 times higher than the density we would predict by extrapolating our number–flux counts to erg cm-2 s-1, 770 sources deg-2 (Equation 6). The lower number of sources observed in the field toward the Galactic center is probably due to the higher absorption, which prevents us from seeing to as large a distance in the disk. On the other hand, the slope of our distribution for the foreground sources () is similar to those derived from shallower ROSAT surveys of the Galactic plane at 30–300 times higher fluxes ( in Motch et al. 1997; in Morley et al. 2001).
4.2 Point Source Contribution to the Diffuse Emission
The point sources observed in the field contribute a significant fraction to the X-ray emission that has previously been ascribed to diffuse emission at the Galactic center (Koyama et al., 1996; Sidoli & Mereghetti, 1999). The flux produced by these point sources can be estimated from the distribution (Equation 5) according to
| (7) |
For a power-law number count distribution, this integrates to
| (8) |
We converted the photon fluxes used in Equation 5 into energy fluxes by assuming 1 photons cm-2 s-1 erg cm-2 s-1 (2.0–8 keV), and integrated over the fluxes for which our survey is complete (Table 4). We find that point sources with fluxes greater than erg cm-2 s-1 contribute a mean surface brightness of erg cm-2 s-1 arcmin-2 over the inner 9′ around Sgr A∗. This is about 10% of the diffuse flux from the inner regions of the Galaxy derived by Koyama et al. (1996; erg cm-2 s-1 in a 1∘ field, or erg cm-2 s-1 arcmin-2) and by Sidoli & Mereghetti (2001; erg cm-2 s-1 in a 190 arcmin2 field, or erg cm-2 s-1 arcmin2). A similar result was obtained by Ebisawa et al. (2001b) in a region at and .
However, the steep slope of the flux distribution (), implies that the integrated flux from point sources in the field will diverge if the distribution extends to arbitrarily low fluxes (see Figure 10). Point sources would account for all of the diffuse emission reported by Koyama et al. (1996) and Sidoli & Mereghetti (1999) if the luminosity distribution in Equation 5 extends a factor of 40–100 lower in flux. However, from the image in Figure 2, it is clear that filamentary features contribute a significant fraction of the diffuse emission, which implies that the flux distribution in the 2–8 keV band (where most of the diffuse emission is observed) must turn over between fluxes of and erg cm-2 s-1, or luminosities of to erg s-1 at the Galactic center.
4.3 The Nature of the Galactic Center Point Sources
Sources are detected at the Galactic center with fluxes between and erg cm-2 s-1 (2.0–8.0 keV; compare Figure 2.2). This translates to luminosities of to erg s-1 at 8 kpc, if an average decrease in flux of 30% due to absorption is accounted for. Comparing these values with Table A Deep Chandra Catalog of X-ray Point Sources toward the Galactic Center, only main sequence stars later than type O have X-ray luminosities below the lower limit of our sample. There are likely to be many examples of the other classes of sources in the field. Among ordinary stellar systems, about 10% of the X-ray stars in the Orion Nebula Cluster (Feigelson et al., 2002) and 70% of RS CVn systems (Dempsey et al., 1993) lie within the luminosity range of the detected sources. However, above our completeness limit of erg s-1, we should find only 1% of YSOs and 10% of RS CVns, and the large absorbing column toward the Galactic center would attenuate the soft spectra of these sources by factors of 2–6. These should contribute significantly only to the numbers of relatively faint sources with hard colors less than 0.1 (see Figures 3.3 and 12). Several isolated Wolf-Rayet and O stars also have been detected at the Galactic center (Cotera et al., 1999). Such systems could account for the brighter X-ray sources with soft spectra, particularly if they are binaries.
With significantly higher luminosities and relatively harder spectra, stellar remnants probably comprise the bulk of the Galactic center sources. Among the sources in Table A Deep Chandra Catalog of X-ray Point Sources toward the Galactic Center, low-mass X-ray binaries (LMXBs) and young, isolated pulsars are certainly luminous enough to be seen at the Galactic center, but they are expected to be quite rare, with only on order in the entire Galaxy (Iben, Tutukov, & Fedoroval, 1997; Romani, 1998; Possenti et al., 2002). Few examples of these should be present in our sample. On the other hand, Howell, Nelson, & Rappaport (2001) suggest that there could be cataclysmic variables (CVs) in our Galaxy. We would expect to detect 60% of CVs containing weakly-magnetized white dwarfs above our detection limit, and 7% above our completeness limit (Verbunt et al., 1997). However, most of these sources CVs (namely, the un-magnetized ones) also have relatively soft, thermal spectra (Table A Deep Chandra Catalog of X-ray Point Sources toward the Galactic Center).
The best candidates for the very hard X-ray sources in Figure 12 are CVs containing magnetized white dwarfs (polars and intermediate polars) and neutron stars in HMXBs. Magnetized CVs comprise on order 10% of accreting white dwarfs (e.g. Warner, 1995), and often exhibit flat spectra that are typically interpreted as hot ( keV) thermal spectra with multiple absorbing components that partially cover the X-ray emitting region (e.g., Ezuka & Ishida, 1999; Sugizaki et al., 2000). Wind-accreting X-ray pulsars in HMXBs also frequently exhibit non-thermal spectra that can be described by power laws below 10 keV (Campana et al., 2001, e.g.). Although HMXBs are usually observed with luminosities above erg s-1 (Campana et al., 2002a), several faint, pulsing sources recently have been discovered that are thought to be accreting neutron stars (Kinugasa et al., 1998; Torii et al., 1999; Oosterbroek et al., 1999; Sakano et al., 2000). Pfahl, Rappaport, & Podsiadlowski (2002) predict that there could be a few times wind-accreting neutron stars (HXMBs) in the Milky Way. Hard sources similar to those found in our survey are almost certainly fairly common in the Galactic disk, as an ASCA survey of the central region of the Galactic plane () turned up about a dozen sources with power laws out of 163 sources with fluxes as low as erg cm-2 s-1.
Whatever the nature of these hard sources, they represent an unprecedented sample of X-ray emitting objects. More than half of the sources brighter than erg cm-2 s-1 (2.0–8.0 keV) for which we can derive medium and hard colors have spectra consistent with power laws (Figure 12), which implies that there could be over 1000 of these hard sources in the inner 20 pc around Sgr A∗. In contrast, only on order 100 magnetic CVs (Warner, 1995; Ezuka & Ishida, 1999) and wind-accreting pulsars (Liu, van Paradijs, & van den Heuvel 2000) are known in our Galaxy.
In fact, it may prove difficult to understand why so many magnetized CVs or neutron star HMXBs would be present at the Galactic center. Assuming that all of the point sources are members of the nuclear bulge (which is about 300 pc across in the radial direction; Mezger et al. 1996), our image surveys a volume of approximately pc3, and the average stellar number density of the field is on order 1000 times that in the local neighborhood (compare Binney & Merrifield, 1998, Launhardt, Zylka, & Mezger 2002). If we take the local the local number density of polars and intermediate polars to be pc-3 (Warner, 1995), and assume that their density can be scaled to the Galactic center according to the stellar density, we would expect to observe only in our current image. Unfortunately, this estimate is only reliable to within an order of magnitude, because various selection effects in surveys of CVs introduce large uncertainties into (i) estimates of the local space density of CVs (compare, e.g., Warner, 1995; Schwope et al., 2002) and (ii) the fraction of magnetic CVs thought to exhibit flat spectra between 2–8 keV (compare Verbunt et al., 1997; Ezuka & Ishida, 1999, Haberl, Motch, & Zickgraf 2002).
Since the nuclear bulge contains on order 1% of the mass of the Galactic disk (Mezger et al., 1996), Pfahl et al. (2002) have predicted that it could contain several hundred of the young, wind-accreting neutron stars that may exist in the Galaxy. The early-type mass donors in these systems only have a typical lifetime of years (Pfahl et al., 2002), so the main theoretical uncertainty in determining the number of HXMBs expected in this field is the rate of recent star formation in the nuclear bulge (Mezger et al., 1996; Serabyn & Morris, 1996). However, the large numbers of faint neutron star HMXBs that Pfahl et al. (2002) predict have not yet been identified in the Galaxy — the known wind-accreting neutron stars are mostly transient systems with observed luminosities that range from erg s-1. The one system that has been detected with erg s-1 had a soft spectrum that was consistent with a power law (V 033253; see Campana et al., 2002a), and would not be among the hard sample from our image if it were placed at the Galactic Center (compare Figure 12).
5 Conclusions
We have presented a sample of 2357 X-ray sources detected during 590 ks of Chandra observations of the 17′ by 17′ field around Sgr A∗ (Figures 1 and 2). The completeness limit of our survey at the Galactic center is about erg cm-2 s-1(2–8 keV), while sources are detected with fluxes nearly an order of magnitude lower (Figure 2.2). Only 20–100 of these sources are expected to be background AGN. The large number of sources in this field probably results from the high stellar density at the Galactic center. Indeed, we have demonstrated that the surface density of Galactic center X-ray sources decreases as away from Sgr A∗ (Figure 9), just as the surface density of infrared stars does (Serabyn & Morris, 1996). We have also shown that the distribution of the Galactic center sources is very steep, rising as near our completeness limit (Figure 10). This indicates that point sources can contribute significantly to the diffuse component of the Galactic X-ray emission.
More than half of the sources for which we have spectral information are very hard, with spectra that are consistent with power laws (Figure 12). Such hard spectra have only been observed previously from magnetically accreting white dwarfs and wind-accreting neutron stars. It these X-ray sources are magnetic CVs, they would be the first low-mass stars identified in the nuclear bulge. If they are wind-accreting neutron stars, these systems would provide an important constraint on the amount of star formation that has taken place near the Galactic center in the last years. This highlights the importance of identifying the nature of the Galactic center sources with more certainty. The X-ray spectral and timing properties of these sources will be reported in detail in the near future, and we are in the process of identifying these sources at radio and infrared wavelengths.
References
- Asai et al. (1998) Asai, K., Dotani, T., Hoshi, R., Tanaka, Y., Robinson, C. R., & Terada, K. 1998, PASJ, 50, 611
- Baganoff et al. (2001) Baganoff, F. K., Bautz, M. W., Brandt, W. N., Chartas, G., Feigelson, E. F., Garmire, G. P., Maeda, Y., Morris, M., Ricker, G. R., Townsley, L. K., & Walter, F. 2001, Nature, 413, 45
- Baganoff et al. (2003) Baganoff, F. K. et al. 2003, ApJ, 591, 891
- Becker & Aschenbach (2002) Becker, W. & Aschenbach, B. 2002, Proceedings of the 270th WE-Heraeus Seminar on: “Neutron Stars, Pulsars, and Supernova Remnants”, eds. W. Becker, H. Lesch, & J. Trümper, MPE Report 278, p. 63
- Binney & Merrifield (1998) Binney, J. & Merrifield, M., 1998, Galactic Astronomy, Princeton University Press
- Brandt et al. (2001) Brandt, W. N. et al. 2001, AJ, 122, 2810
- Broos et al. (2002) Broos, P., Townsley, L., Getman, K. & Bauer, F. 2002, “ACIS Extract, An ACIS Point Source Extraction Package”, Pennsylvania State University
- Campana et al. (2001) Campana, S., Gastaldello, F., Stella, L., Israel, G. L., Colpi, M., Pizzolato, F., Orlandini, M., & Dal Fiume, D. 2001, ApJ, 561, 924
- Campana et al. (2002a) Campana, S., Stella, L., Gastaldello, F., Mereghetti, S., Colpi, M., Israel, G. L., Burderi, L., Di Salvo, T., & Robba, R. N. 2002, ApJ, 575, L15
- Campana et al. (2002b) Campana, S., Stella, L., Israel, G. L., Moretti, A., Parmar, A. N., & Orlandini, M. 2002b, astro–ph/0207422.
- Cotera et al. (1999) Cotera, A. S., Simpson, J. P., Erickson. E. F., Colgan, S. W. J., Burton, M. G., & Allen, D. A. 1999, ApJ, 510, 747
- Dempsey et al. (1993) Dempsey, R. C., Linsky, J. L., Schmitt, J. H. M. M., & Fleming, T. A. 1993, ApJ, 413, 333
- Ebisawa et al. (2001a) Ebisawa, K., Bamba, A., Kaneda, H., Maeda, Y., Paizis, A., Sato, G., & Yamauchi, S. 2001a, In New Visions of the X-ray Universe in the XMM-Newton and Chandra Era, symposium at ESTEC, The Netherlands. 29-30 Nov. 2001
- Ebisawa et al. (2001b) Ebisawa, K., Maeda, Y., Kaneda, H., & Yamauchi, S. 2001b, Science, 293, 1633
- Ezuka & Ishida (1999) Ezuka, H. & Ishida, M. 1999, ApJS, 120, 277
- Fabbiano (1989) Fabbiano, G. 1989, ARA&A, 27, 87
- Feigelson et al. (2002) Feigelson, E. D., Broos, P., Gaffney, J. A. III, Garmire, G., Hillenbrand, L. A., Pravdo, S. H., Townsley, L., & Tsuboi, Y. 2002, ApJ, 574, 258
- Freeman et al. (2002) Freeman, P. E., Kashyap, V., Rosner, R., & Lamb, D. Q. 2002, ApJS, 138, 185
- Garmire et al. (2002) Garmire, G. P., Bautz, M. W., Ford, P. G., Nousek, J. A., & Ricker, G. R. 2002, SPIE Vol. 4851, “Advanced CCD Imaging Spectrometer (ACIS) Instrument on the Chandra X-ray Observatory”
- Garmire et al. (2000) Garmire, G., Feigelson, E. D., Broos, P., Hillenbrand, L. A., Pravdo, S. H., Townsley, L. & Rsuboi, Y. 2000, AJ, 120, 1426
- Gehrels (1986) Gehrels, N. 1986, ApJ, 303, 336
- Grimm et al. (2002) Grimm, H.-J., Gilfanov, M., & Sunyaev, R. 2002, A&A, 391, 923
- Güsten et al. (1981) Güsten, R., Walmsley, C. M., & Pauls, T. 1981, A&A, 103, 197
- Haberl, Motch, & Zickgraf (2002) Haberl, F., Motch, C., & Zickgraf, F.-J. 2002, A&A, 387, 201
- Hempelmann et al. (1995) Hempelmann, A., Schmitt, J. H. M. M., Schultz, M., Ruediger, G., & Stepien, K. 1995, A&A, 294, 515
- Hertz & Grindlay (1984) Hertz, P. & Grindlay, J. E. 1984, ApJ, 278, 137
- Hogg (2001) Hogg, D. W. 2001, AJ, 121, 1207
- Howell et al. (2001) Howell, S. B., Nelson, L. A., & Rappaport, S. 2001, ApJ, 550, 897
- Iben, Tutukov, & Fedoroval (1997) Iben, Icko, Jr., Tutukov, A. V., & Fedoroval, A. V. 1997, ApJ, 486, 986
- Kaneda et al. (1997) Kaneda, H., Makishima, K., Yamauchi, S., Koyama, K., Matsuzaki, K., & Yamasaki, N. Y. 1997, ApJ, 491, 638
- Kilgard et al. (2002) Kilgard, R. E., Kaaret, P., Krauss, M. I., Prestwich, A. H., Raley, M. T., & Zezas, A. 2002, ApJ, 573, 138
- Kinugasa et al. (1998) Kinugasa, K. et al. 1998, ApJ, 495, 435
- Kohno et al. (2002) Kohno, M., Koyama, K., & Hamaguchi, K. 2002, ApJ, 567, 423
- Kong et al. (2002b) Kong, A. K. H., Garcia, M. R., Primini, F. A., Murray, S. S., Di Stefano, R., & McClintock, J. E. 2002b, ApJ, 577, 738
- Kong et al. (2002a) Kong, A. K. H., McClintock, J. E., Garcia, M. R., Murray, S. S., & Barret, D. 2002a, ApJ, 570, 277
- Koyama et al. (1986a) Koyama, K., Ikeuchi, S., & Tomisaka, K. 1986a, PASJ, 38, 503
- Koyama et al. (1996) Koyama, K., Maeda, Y., Sonobe, T., Takeshima, T., Tanaka, Y., & Yamauchi, S. 1996, PASJ, 48, 249
- Koyama et al. (1986b) Koyama, K., Makishima, K., Tanaka, Y., & Tsunemi, H. 1986b, PASJ, 38, 121
- Kraft, Burrows, & Nousek (1991) Kraft, R. P., Burrows, D. N., & Nousek, J. A. 1991, ApJ, 374, 344
- Krishnamurthi et al. (2001) Krishnamurthi, A., Reynolds, C. S., Linsky, J. L., Martín, E., & Gagné, M. 2001, AJ, 121, 337
- Launhardt, et al. (2002) Launhardt, R., Zylka, R., & Mezger, P. G. 2002, A&A, 384, 112
- Liu et al. (2000) Liu, Q. Z., van Paradijs, J., & van den Heuvel, E. P. J. 2000, A&AS, 147, 25
- Lyons (1991) Lyons, L. 1991, A practical guide to data analysis for physical science students, Cambridge University Press.
- Maeda et al. (2002) Maeda, Y. et al. 2002, ApJ, 570, 671
- Manners et al. (2002) Manners, J. C. et al. 2002, MNRAS submitted, astro-ph/0207622
- Mauche & Mukai (2002) Mauche, C. W. & Mukai, K. 2002, ApJ, 566, L33
- McNamara et al. (2000) McNamara, D. H., Madsen, J. B., Barnes, J., & Ericksen, B. F. 2000, PASP, 112, 202
- Mewe, Lemen, & van den Oord (1986) Mewe, R., Lemen, J. R., & van den Oord, G. H. J. 1986, A&AS, 65, 511
- Mezger et al. (1996) Mezger, P. G., Duschl, W. J., & Zylka, R., 1996, AARev, 7, 289
- Mezger et al. (1999) Mezger, P. G., Zylka, R., Philipp, S., & Lunhardt, R. 1999, A&A, 348, 457
- Morley et al. (2001) Morley, J. E., Briggs, K. R., Pye, J. P., Favata, F., Micela, G., & Sciortino, S. 2001, MNRAS, 326, 1161
- Morris (1993) Morris, M. 1993, ApJ, 408, 496
- Motch et al. (1997) Motch, C., Guillout, P., Haberl, F., Pakull, M. W., Peitsch, W., & Reinsch, K. 1997, A&A, 318, 111
- Mukai (2000) Mukai, K. 2000, New Astronomy Reviews, 44, 9
- Mukai & Shiokawa (1993) Mukai, K. & Shiokawa, K. 1993, ApJ, 418, 863
- Murdoch et al. (1973) Murdoch, H. S., Crawford, D. F., & Jauncey, D. 1973, ApJ, 183, 1
- Oosterbroek et al. (1999) Oosterbroek, T., Orlandini, M., Parmar, A. N., Angelini, L., Israel, G. L., Dal Fiume, D., Mereghetti, S., Santangelo, A., & Cusumano, G. 1999, A&A, 351, L33
- Pavlinsky et al. (1994) Pavlinsky, M. N., Grebenev, S. A., & Sunyaev, R. A. 1994, ApJ, 425, 110
- Pfahl et al. (2002) Pfahl, E., Rappaport, S., & Podsiadlowski, P. 2002, ApJ, 571, L37
- Pollock (1987) Pollock, A. M. T. 1987, ApJ, 320, 283
- Pooley et al. (2002) Pooley, D., Lewin, W. H. G., Verbunt, F., Homer, L., Margon, B., Gaensler, B. M., Kaspi, V. M., Miller, J. M. Fox, D. W., & van der Klis, M. 2002, ApJ, 573, 184
- Portegies-Zwart et al. (2002) Portegies-Zwart, P., Pooley, D., & Lewin, W. H. G. 2002, ApJ, 574, 762
- Possenti et al. (2002) Possenti, A., Cerutti, R., Colpi, M., & Mereghetti, S. 2002, A&A, 387, 993
- Predehl & Truemper (1995) Predehl, P. & Truemper, J. 1994, A&A, 290, L29
- Priebisch & Zinnecker (2002) Priebisch, T. & Zinnecker, H. 2002, AJ, 123, 1613
- Raymond & Smith (1977) Raymond, J. C. & Smith, B. W. 1977, ApJS, 35, 419
- Reid et al. (1999) Reid, M. J., Readhead, A. C. S., Vermeulen, R. C., & Treuhaft, R. N. 1999, ApJ, 524, 816
- Romani (1998) Romani, R. W. 1998 A&A, 333, 583
- Rosati et al. (2002) Rosati, P. et al. 2002, ApJ, 566, 667
- Rutledge et al. (2001) Rutledge, R. E., Bildsten, L., Brown, E. F., Pavlov, G. G., & Zavlin, V. E. 2001, ApJ, 551, 921
- Sakano et al. (2002) Sakano, M., Koyama, K., Murakami, H., Maeda, Y., & Yamauchi, S. 2002, ApJS, 138, 19
- Sakano et al. (2000) Sakano, M., Torii, K., Koyama, K., Maeda, Y., & Yamauchi, S. 2000, PASJ, 52, 1141
- Schwope et al. (2002) Schwope, A. D., Brunner, H., Buckley, D., Greiner, J., Heyden, K. v. d., Neizvestny, S., Potter, S., & Schwarz, R. 2002, A&A, 396, 895
- Serabyn & Morris (1996) Serabyn, E. & Morris, M. Nature, 1996, 382, 602
- Sidoli et al. (2001) Sidoli, L., Belloni, T., & Mereghetti, S. 2001, A&A, 368, 835
- Sidoli & Mereghetti (1999) Sidoli, L. & Mereghetti, S. 1999, A&A, 349, L49
- Sidoli et al. (1999) Sidoli, L., Mereghetti, S., Israel, G. L., Chiappetti, L., Treves, A., & Orlandini, M. 1999, ApJ, 525, 215
- Singh et al. (1996) Singh, K. P., Drake, S. A., & White, N. E. 1996, AJ, 111, 2415
- Skibo et al. (1997) Skibo, J. G., Johnson, W. N., Kurfess, J. D., Kinzer, R. L., Jung, G., Grove, J. E., Purcell, W. R., Ulmer, M. P., Gehrels, N., & Tueller, J. 1997, ApJ, 483, L95
- Soria & Wu (2002) Soria, R. & Wu, K. 2002, A&A, 384, 99
- Sugizaki et al. (2000) Sugizaki, M., Kinugasa, K., Matsuzaki, K., Terada, Y., Yamauchi, S., & Yokogawa, J. 2000, ApJ, 534, L181
- Sugizaki et al. (2001) Sugizaki, M., Mitsuda, K., Kaneda, H., Matsuzaki, K., Yamauchi, S., & Koyama, K. 2001, ApJS, 134, 77
- Szkody et al. (2002) Szkody, P., Nishikida, K., Raymond, J. C., Seth, A., Hoard, D. W., Long, K. S., & Sion, E. M. 2002, ApJ, 574, 942
- Tanuma et al. (1999) Tanuma, S., Yokoyama, T., Kudoh, T., Matsumoto, R., Shibata, K., & Makishima, K. 1999, PASJ, 51, 161
- Tanaka et al. (1999) Tanaka, Y., Miyaji, T., & Hasinger, G. 1999, Astron. Nachr., 320, 181
- Torii et al. (1999) Torii, K., Sugizaki, M., Kohmura, T., Endo, T., & Nagase, F. 1999, ApJ, 523, L65
- Townsley et al. (2000) Townsley, L. K., Broos, P. S., Garmire, G. P., & Nousek, J. A. 2000, ApJ, 534, L139
- Trudolyubov et al. (2002) Trudolyubov, S. P., Borozdin, K. N., Priedhorsky, W. C., Mason, K. O. & Cordova, F. A. 2002, ApJ, 571, L17
- Unavane & Gerard (1998) Unavane, M. & Gerard, G. 1998, MNRAS, 295, 145
- Valinia & Marshall (1998) Valinia, A. & Marshall, F. E. 1998, ApJ, 505, 134
- Verbunt et al. (1997) Verbunt, F., Bunk, W. H., Ritter, H., & Pfeffermann, E. 1997, A&A, 327, 602
- Wang et al. (2002) Wang, Q. D., Gotthelf, E. V., & Lang, C. C. 2002, Nature, 415, 148
- Warner (1995) Warner, B. 1995, Cataclysmic Variable Stars, Cambridge University Press
- Watson et al. (1981) Watson, M. G., Willingale, R., Hertz, P., & Grindlay, J. E. 1981, ApJ, 250, 142
- Wijnands et al. (2002) Wijnands, R., Guainazzi, M., van der Klis, M., & Méndez, M. 2002, ApJ, 573, L45
- Worrall et al. (1982) Worrall, D. M., Marshall, F. E., Boldt, E. A., & Swank, J. H. 1982, ApJ, 255, 111
- Yamauchi et al. (1996) Yamauchi, S., Kaneda, H., Koyama, K., Makishima, K., Matsuzaki, K., Sonobe, T., Tanaka, Y., & Yamasaki, N. 1996, PASJ, 48, L15
- Yamasaki et al. (1997) Yamasaki, S. et al. 1997, ApJ, 481, 821
- Yusef-Zadeh et al. (2002) Yusef-Zadeh, F., Law, C., Wardle, M., Wang, Q. D., Fruscione, A., Lang, C. C., & Cotera, A. 2002, ApJ, 570, 665
- Zylka et al. (1990) Zylka, R., Mezger, P. G., & Wink, J. E. 1990, A&A, 234, 133
| Object | aaLuminosities represent ranges reported in the literature. Below erg s-1, sources are difficult to detect, and lower bounds at this level generally represent the sensitivity limits of the respective observations. | SpectrumbbSpectra of point sources are typically described by thermal plasma (Raymond & Smith, 1977; Mewe, Lemen, & van den Oord, 1986), power laws (denoted by PL), or blackbodies (denoted by BB). | ReferencesccThe references are not a complete compilation, but represent a sampling of surveys and recent results that are amenable to comparisons with observations in the Chandra bandpass (0.5–10 keV). |
|---|---|---|---|
| MS StarsddLater than type O. | keV Plasma | [1,2] | |
| YSOs | keV Plasma | [3,4,5] | |
| RS CVn/Algol | keV Plasma | [6,7] | |
| WR/O Stars | keV Plasma | [8,9,10] | |
| CVs | keV Plasma | [11,12,13,14] | |
| Pulsars | PL ; keV BB | [15,16] | |
| NS LMXBs | keV BB ; PLeeFor the LMXBs, we include only spectral properties in quiescence ( erg s-1). | [17,18,19,20] | |
| BH LMXBs | PLeeFor the LMXBs, we include only spectral properties in quiescence ( erg s-1). | [17,21] | |
| HMXBs | PL | [22,23] |
References. — [1] Krishnamurthi et al. (2001); [2] Hempelmann et al. (1995); [3] Garmire et al. (2000); [4] Priebisch & Zinnecker (2002); [5] Kohno, Koyama, & Hamaguchi (2002); [6] Singh, Drake, & White (1996); [7] Dempsey et al. (1993); [8] Yusef-Zadeh et al. (2002); [9] Portegies-Zwart, Pooley, & Lewin (2002); [10] Pollock (1987); [11] Verbunt et al. (1997); [12] Mukai (2000); [13] Mauche & Mukai (2002); [14] Szkody et al. (2002); [15] Becker & Aschenbach (2002); [16] Possenti et al. (2002); [17] Asai et al. (1998); [18] Rutledge et al. (2001); [19] Wijnands et al. (2002); [20] Campana et al. (2002a); [21] Kong et al. (2002a); [22] Campana et al. (2001); [23] Campana et al. (2002b)
| Aim Point | |||||
|---|---|---|---|---|---|
| Start Time | Sequence | Exposure | RA | DEC | Roll |
| (UT) | (s) | (degrees J2000) | (degrees) | ||
| 1999 Sep 21 02:43:00 | 0242 | 40,872 | 266.41382 | -29.0130 | 268 |
| 2000 Oct 26 18:15:11 | 1561 | 35,705 | 266.41344 | -29.0128 | 265 |
| 2001 Jul 14 01:51:10 | 1561 | 13,504 | 266.41344 | -29.0128 | 265 |
| 2002 Feb 19 14:27:32 | 2951 | 12,370 | 266.41867 | -29.0033 | 91 |
| 2002 Mar 23 12:25:04 | 2952 | 11,859 | 266.41897 | -29.0034 | 88 |
| 2002 Apr 19 10:39:01 | 2953 | 11,632 | 266.41923 | -29.0034 | 85 |
| 2002 May 07 09:25:07 | 2954 | 12,455 | 266.41938 | -29.0037 | 82 |
| 2002 May 22 22:59:15 | 2943 | 34,651 | 266.41991 | -29.0041 | 76 |
| 2002 May 24 11:50:13 | 3663 | 37,959 | 266.41993 | -29.0041 | 76 |
| 2002 May 25 15:16:03 | 3392 | 166,690 | 266.41992 | -29.0041 | 76 |
| 2002 May 28 05:34:44 | 3393 | 158,026 | 266.41992 | -29.0041 | 76 |
| 2002 Jun 03 01:24:37 | 3665 | 89,928 | 266.41992 | -29.0041 | 76 |
| Source Name | RA | DEC | Offset | Net Cts | Soft | Med | Hard | Fluxes ( photons cm-2 s-1) | ||||||
|---|---|---|---|---|---|---|---|---|---|---|---|---|---|---|
| (J2000) | (′) | (ks) | (keV) | Color | Color | Color | ||||||||
| (1) | (2) | (3) | (4) | (5) | (6) | (7) | (24–26) | (27–29) | (30–32) | (33–35) | (36–38) | (39–41) | (42–44) | (45–47) |
| 174530.0290704 | 266.37505 | 29.11780 | 7.0 | 625.6 | 0.90 | 1.5 | ||||||||
| 174541.0290014 | 266.42083 | 29.00399 | 0.3 | 625.6 | 0.87 | 4.5 | ||||||||
| 174536.1285638 | 266.40059 | 28.94407 | 3.9 | 625.6 | 0.90 | 1.5 | ||||||||
| 174607.5285951 | 266.53132 | 28.99757 | 6.0 | 625.6 | 0.90 | 1.5 | ||||||||
| 174543.9290456 | 266.43305 | 29.08238 | 4.6 | 625.6 | 0.90 | 1.5 | ||||||||
| 174541.5285814 | 266.42296 | 28.97080 | 2.2 | 625.6 | 0.90 | 1.5 | ||||||||
| 174552.2290744 | 266.46754 | 29.12908 | 7.7 | 625.6 | 0.74 | 4.5 | ||||||||
| 174532.7290552 | 266.38663 | 29.09785 | 5.6 | 625.6 | 0.90 | 1.5 | ||||||||
| 174558.9290724 | 266.49557 | 29.12340 | 8.1 | 625.6 | 0.90 | 4.5 | ||||||||
| 174539.7290029 | 266.41567 | 29.00827 | 0.1 | 625.6 | 0.90 | 4.5 | ||||||||
| 174538.0290022 | 266.40861 | 29.00619 | 0.4 | 625.6 | 0.87 | 4.5 | ||||||||
| 174548.9285751 | 266.45400 | 28.96439 | 3.3 | 625.6 | 0.90 | 4.5 | ||||||||
| 174550.5285239 | 266.46067 | 28.87773 | 8.1 | 584.8 | 0.90 | 1.5 | ||||||||
| 174545.2285828 | 266.43870 | 28.97466 | 2.3 | 625.6 | 0.81 | 1.5 | ||||||||
| 174535.5290124 | 266.39823 | 29.02336 | 1.4 | 625.6 | 0.90 | 4.5 | ||||||||
| 174520.6290152 | 266.33585 | 29.03113 | 4.5 | 625.6 | 0.88 | 1.5 | ||||||||
| 174540.1290055 | 266.41733 | 29.01546 | 0.5 | 625.6 | 0.90 | 4.5 | ||||||||
| 174534.5290201 | 266.39408 | 29.03363 | 2.0 | 625.6 | 0.90 | 4.5 | ||||||||
| 174545.5285829 | 266.43972 | 28.97475 | 2.3 | 625.6 | 0.80 | 4.5 | ||||||||
| 174544.9290027 | 266.43745 | 29.00759 | 1.1 | 625.6 | 0.72 | 4.5 | ||||||||
| 174552.0285312 | 266.46681 | 28.88676 | 7.7 | 625.6 | 0.90 | 4.5 | ||||||||
| 174513.1285624 | 266.30498 | 28.94007 | 7.1 | 625.6 | 0.90 | 4.5 | ||||||||
| 174549.3285557 | 266.45546 | 28.93276 | 4.9 | 625.6 | 0.90 | 4.5 | ||||||||
| 174547.0285333 | 266.44610 | 28.89252 | 7.1 | 625.6 | 0.90 | 4.5 | ||||||||
| 174527.6285258 | 266.36518 | 28.88304 | 8.0 | 625.6 | 0.90 | 4.5 | ||||||||
Note. — This is a portion of the full table, which is available via the electron version of this paper. The columns are as follows: (1) Source name, which should be appended to the IAU designation CXOGC J. (2-3) The ra and dec in decimal degrees, J2000. (4) Offset of source from nominal aim point, Sgr A∗(see text). (5) The sum of the live times for all of the observations in which a source was detected, used to compute photon fluxes. Note that the effective exposure factoring in proximity to chip gaps and bad columns is encoded in the mean value of the ARF. (6) Fraction of the PSF energy enclosed by source extraction region. Sources with fractions near 70% are likely to be confused. (7) Energy at which PSF was estimated for , where keV for foreground sources and keV for sources at or beyond the galactic center. (8-23) In the machine-readable version of this table we list for each of the four energy bands: the total counts extracted from the source region, the estimated background in the source region, the ratio of the areas of the background and source regions weighted by the number of background counts, and the mean value of the ARF. (24-26) Net counts in the full band 0.5–8.0 keV. (27-35) Colors are defined according to , where and are the net counts in high and low energy bands, respectively. For the soft color, is in the 2.0–3.3 keV band, and is in the the 0.5–2.0 keV band. For the medium color, is in the 3.3–4.7 keV band, and is in the the 2.0–3.3 keV band. For the hard color, is 4.7–8.0 keV and is 3.3–4.7 keV. (35-47) Photon fluxes with 1- uncertainties on the last significant figure in parenthesis, or 90% upper limits in each of four energy bands: 0.5–2.0 keV, 2.0–3.3 keV, 3.3–4.7 keV, and 4.7–8.0 keV.
| Max. Offset | Flux Limit | Solid Angle | Number |
|---|---|---|---|
| (arcmin) | photons cm-2 s-1 | (arcmin2) | of Sources |
| Galactic Center Sources | |||
| 5 | 60.6 | 335 | |
| 7 | 148.3 | 241 | |
| 9 | 241.7 | 61 | |
| Foreground Sources | |||
| 7 | 143.4 | 48 | |
| 9 | 240.9 | 66 | |