Chapter 1 STACEE Observations of Mrk 421 During the 2001 Flare
Abstract
STACEE is a ground based -ray observatory that uses a heliostat array, built for solar energy research, to detect atmospheric Cherenkov radiation from -ray initiated extensive air showers. During the first half of 2001, a prototype detector, STACEE-48, was used to detect the blazar Markarian 421, which was in an extremely active state. Observations from March to May of 2001 yielded an integral flux of at energies above GeV, and provide some evidence of correlated trends on time scales of a week or more in the GeV and X-ray bands.
1. Introduction
The STACEE–48 detector (Covault et al. 2001, Boone 2002) operated from 2000 to 2001 at the National Solar Thermal Test Facility in New Mexico, USA. This prototype of the full STACEE experiment employed 48 steerable mirrors (heliostats), distributed over approximately square meters. This large collection area allows STACEE to operate into the lower energy -ray regime left unexplored by previous ground-based techniques.
Science observations of Markarian 421 were conducted from March through May of 2001, constituting 26 nights and roughly 36 hours of exposure time. Of this, 22 hours of source observations were deemed good-quality data and used for this analysis. Simulations of the detector performance indicate that the peak of the STACEE-48 energy response to a source with the approximate spectral index of Markarian 421 occurs at GeV, which has been adopted as our energy threshold for these data (see Boone et al. 2002 for details). Thus, these observations represent the lowest energy -ray detection of the 2001 flare by a ground-based instrument.
2. Spectral Results
The STACEE observations of Markarian 421 yielded an average -ray rate of min-1. Included in this rate is a correction for false triggers due to the presence of a bright star (HD 95934, magnitude 6.16 in the B band) within a few arcminutes of the source. The correction was determined by observing a star of comparable brightness (HIP 80460) with no known associated -ray source in the field of view. The excess rate from the HIP 80460 observations was attributed to a constant star effect, and thus subtracted from the Markarian 421 observations. The above rate, assuming a differential spectral index of , corresponds to an average integral -ray flux above 140 GeV of

If the spectrum of Markarian 421 is assumed to follow a power-law form in the range of energies to which STACEE is sensitive, the normalization of the differential spectrum can be inferred from the measured rate, provided the spectral index is assumed. In Fig. 1a (Boone et al. 2002), the range of possible power-law solutions to the STACEE rate for differential indices between 2.00 and 2.20 is given by the butterfly-shaped region. For comparison, Whipple observations around the same time are plotted for high (I), medium (V), and low (VIII) flux states (Krennrich et al. 2002). EGRET data from cycles 1 through 5 are also plotted for reference (Hartman et al. 1999).
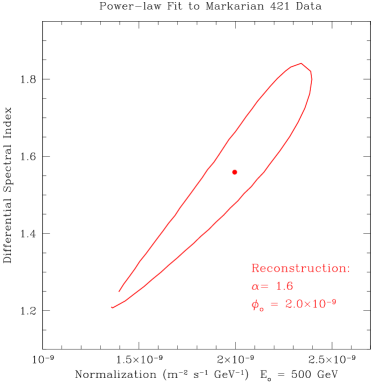
Since STACEE–48 did not record pulse amplitude information for each event, an unbiased determination of the differential flux is difficult. However, because the energy response of STACEE changes significantly as a function of the source elevation and the trigger configuration, it is possible to glean some information about the differential spectrum by using the forward-folding technique. Under this prescription, the Markarian 421 data set was first divided into elevation bands. The simulated detector response to an assumed power-law spectrum at a given elevation was then compared to the appropriate subset of the Markarian 421 observations for several different reimposed trigger criteria. This process was repeated for a number of different elevation bands. The differential index () and the normalization () of the assumed spectrum were then adjusted to minimize the difference between the expected and observed responses over all considered combinations.
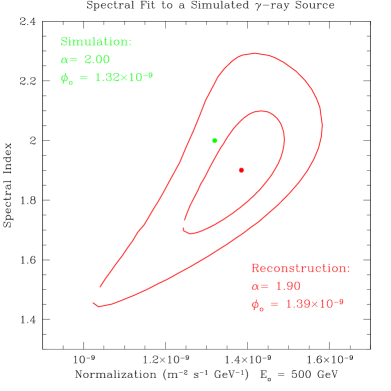
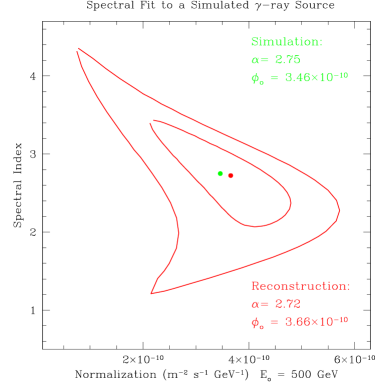
Figure 2 includes two tests of this method on simulated data sets with integral fluxes approximately ten times that expected from Markarian 421 (contours represent one sigma errors). Note that the normalization energy () has been adjusted to the non-standard value of 500 GeV. This transformation was necessary to decrease the strong correlation in the two parameters. The success of the simulated tests indicates that, in principle, the technique is capable of extracting the spectral parameters. However, due to systematic effects in the simulations themselves, these tests do not vouch for the validity of the technique when used on actual data.
This discrepancy is reflected in the application of the technique to the Markarian 421 data in Fig. 1b (contour is the one sigma error). In units of TeV, the reconstructed normalization translates to cm-2 s-1 TeV-1. This value, in conjunction with the extremely hard spectral index of 1.6 does not agree with the average STACEE flux in Fig. 1a or the STACEE/Whipple flux ratios described in Boone et al. (2002). Whether these inconsistencies arise from inaccuracies in our detector simulations, the inappropriateness of a power-law postulate, insufficient statistics, or the high variability of the source, remains to be seen.
3. Temporal Results
Figure 3a (Boone et al. 2002) contains three light curves for Markarian 421 from March through May of 2001. The upper panel, from the RXTE All Sky Monitor is from the 2 to 20 keV energy band (results provided by the RXTE ASM team). The lower panel, from the Whipple detector (Holder et al. 2001), spans energies from 250 GeV to 8 TeV. The STACEE observations, depicted in the central panel, represent the photon flux between 50 and 300 GeV. Points are photon count rates, averaged on a day by day basis.


A correlation analysis was performed on the STACEE and RXTE data sets using the discrete correlation function (DCF) described in Edelson & Krolik (1988). Unbinned discrete correlation coefficients (UDCF) were formed for each pair of points in the respective data sets as follows:
These coefficients were then grouped by their associated time differences (), and averaged to form the DCF.
Figure 3b is a plot of the DCF as a function of time lag for the STACEE and RXTE data sets between MJD 51984 and MJD 52052. Error bars are constructed according to the DCF prescription, and can be understood as the error on the mean for each bin. Although the peak value of the DCF occurs at two days (corresponding to the STACEE data leading the RXTE data by two days), the large error bars on this point indicate that it is not statistically significant with respect to a value of zero (only 2.6). The most significant point in the DCF is (4.0). However, as most bins have approximately 20 entries, it is expected that even completely uncorrelated data sets could exhibit DCF values of (see Edelson & Krolik 1988 for details). Thus, it is difficult to draw any meaningful conclusions from the DCF alone.
4. Conclusions
The STACEE–48 instrument was used to successfully detect Markarian 421 during its flare in the early part of 2001. The average flux observed appears consistent with the variable spectral energy distribution (SED) reported by the Whipple experiment. The data are not suitable for an event-by-event energy analysis, and the forward folding technique yields results which are not consistent with the STACEE average flux. Therefore, it appears that the spectral analysis of these data may be limited to the time-averaged flux reported here and elsewhere. However, the SED shown in Fig. 1a suggests that the STACEE sensitivity may include the peak of the TeV emission for Markarian 421. Thus, more detailed spectral information from STACEE is highly desirable. The current incarnation of the experiment, STACEE–64, is instrumented with waveform digitizers on all channels, which should greatly improve the energy resolution.
A visual inspection of the contemporaneous light curves from RXTE, STACEE, and Whipple suggests correlated trends across all three energy bands. And though a more formal correlation analysis with the DCF does not yet provide compelling statistical evidence for a correlation on day time scales, it does not preclude it either. We suspect that this ambiguity may be due to the rather sparse sampling in the STACEE data set. In fact, it may be that the traditional DCF analysis is generally less suited to GeV-TeV observations, which tend to redefine the notion of “sparsely sampled” data. Alternative timing analysis methods are currently under investigation.
5. References
1. Boone, L. M., et al. 2002, ApJ, 579, L5
2. Boone, L. M. 2002, PhD. thesis, Univ. California, Santa Cruz
3. Covault, C. E., et al. 2001, in Proc 27th ICRC (Hamburg), 1, 2810
4. Edelson, R. A. & Krolik, J. H., 1988, ApJ, 333, 646
5. Hartman, R. C., et al. 1999, ApJS, 123, 79
6. Holder, J., et al. 2001, in Proc 27th ICRC (Hamburg), 1, 2613
7. Krennrich, F., et al. 2002, ApJ, 575, L9