–SFR relation in star forming galaxies
Abstract
We compare the results of Grimm et al. (2003) and Ranalli et al. (2003) on the –SFR relation in normal galaxies. Based on the stellar mass dependence for LMXBs, we show, that low SFR ( M☉/year) galaxies in the Ranalli et al. sample are contaminated by the X-ray emission from low mass X-ray binaries, unrelated to the current star formation activity.
The most important conclusion from our comparison is, however, that after the data are corrected for the “LMXB contamination”, the two datasets become consistent with each other, despite of their different content, variability effects, difference in the adopted source distances, X-ray flux and star formation rate determination and in the cosmological parameters used in interpreting the HDF-N data. They also agree well, both in the low and high SFR regimes, with the predicted –SFR dependence derived from the parameters of the “universal” HMXB luminosity function. This encouraging result emphasizes the potential of the X-ray luminosity as an independent star formation rate indicator for normal galaxies.
keywords:
Galaxies: starburst – X-rays: galaxies – X-rays: binaries1 Introduction
Based on Chandra observations of nearby star forming galaxies and studies of high mass X-ray binaries (HMXB) population in the Milky Way and SMC, Grimm, Gilfanov & Sunyaev (2003) proposed recently that high mass X-ray binaries can be used as a star formation rate (SFR) indicator. They found, that in a broad range of star formation regimes and rates the X-ray luminosity distribution of HMXBs can be approximately described by a “universal” luminosity function – a power law with the slope of and a cut-off at , which normalization is proportional to the SFR. As the 2–10 keV luminosity of a normal galaxy with sufficiently high ratio ( – total stellar mass) is dominated by the emission from high mass X-ray binaries, the X-ray luminosity can be used as a star formation rate indicator for normal galaxies.
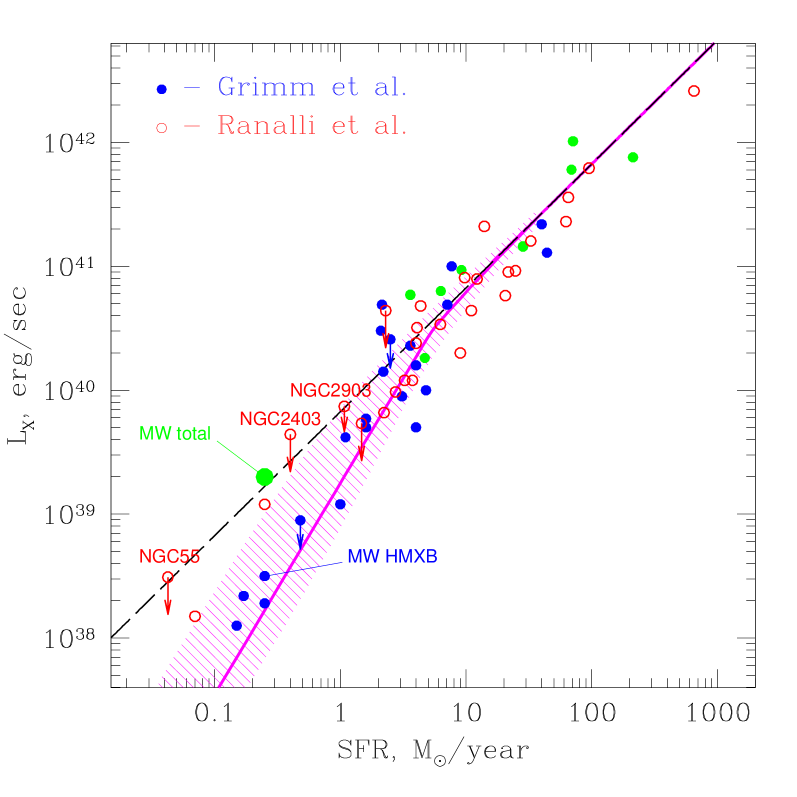
Although the normalization of the luminosity function and the number of sources are proportional to the SFR, the –SFR dependence is non-linear in the low SFR regime and becomes linear only at sufficiently high values of SFR (thick solid line in Fig.1). This non-linear behavior at low SFR values is not related to intrinsic non-linear SFR dependent effects in the population of the HMXB sources. It is rather caused by the fact that the quantity of interest is a sum of the luminosities of discrete sources – , with obeying a power law luminosity distribution. The non-linear behavior is caused by the properties of probability distribution, namely, the difference between its expectation mean (average) and its mode (most probable value). This effect was discussed in Grimm et al. (2003) and Gilfanov (2003) and will be given a detailed treatment in Gilfanov, Grimm & Sunyaev (2003). The position of the break in the –SFR relation is defined by the parameters of the luminosity function. For particular values of the slope and cut-off luminosity found by Grimm et al. (2003), the boundary between non-linear and linear regime lies at SFR M☉/year or, equivalently, erg/sec. Chandra and ASCA measurements of the total X-ray luminosity of a number of nearby star forming galaxies were in a good qualitative and quantitative agreement with the predicted –SFR relation (Fig.1, thick solid curve and filled circles). Moreover, the distant star forming galaxies, observed by Chandra in the Hubble Deep Field North (Brandt et al., 2001) at redshifts of , also obey the same relation. In the linear high SFR regime it is given by:
| (1) |
where SFR is the formation rate of massive stars, . Grimm et al. (2003) pointed out importance of two contaminating factors, unrelated to the current star formation activity: (i) emission of the central supermassive black hole, which even in the low luminosity AGNs can easily out-shine X-ray binaries and (ii) contribution of the low mass X-ray binaries, which might be especially important in the low SFR regime.
Ranalli, Comastri & Seti (2003) independently studied X-ray luminosity of normal galaxies using the ASCA and BeppoSAX archival data and Chandra observations of the HDF-N and found a tight correlation between their X-ray, radio (1.4 GHz) and FIR fluxes. They suggested that the 2–10 keV luminosity of normal galaxies can be used as a SFR indicator and derived the relation:
| (2) |
This formula agrees reasonably well with that obtained by Grimm et al. (2003) for the high SFR regime, eq.(1). However, Ranalli et al. (2003) noted, that the –SFR relation was linear in the entire range of the star formation rates, including the low SFR regime, in apparent contradiction to Grimm et al. (2003) results.
In this Letter we compare the Grimm et al. (2003) and Ranalli et al. (2003) samples of the galaxies. We demonstrate, that the X-ray emission from the low SFR galaxies in the Ranalli et al. (2003) sample is likely to be “contaminated” by low mass X-ray binaries, which are unrelated to current star formation activity. After the “LMXB contamination” is accounted for, the two datasets agree qualitatively and quantitatively and are consistent with the –SFR relation expected on the basis of the “universal” HMXB luminosity function derived by Grimm et al. (2003).
2 The samples
In the following we denote Ranalli et al. (2003) and Grimm et al. (2003) samples as R and G correspondingly. The data from both samples are plotted together in Fig.1.
2.1 The local galaxies
The two samples, although differently constructed, overlap substantially, with 9 galaxies (out of 23 in each sample), present in both. The sample R was derived using more rigorously defined construction algorithm. In almost all cases the authors adopted different distances and different values of SFR. Grimm et al. (2003) derived SFR values averaging the results of several independent estimators based on UV, FIR, Hα and radio flux measurements, whereas Ranalli et al. (2003) used radio flux measurements. The X-ray fluxes were obtained from different observations, sometimes by different instruments and are, obviously, affected by variability of the X-ray emission from the galaxies. For some of the galaxies the X-ray luminosity was calculated by Grimm et al. (2003) as a direct sum of the luminosities of compact sources detected by Chandra.
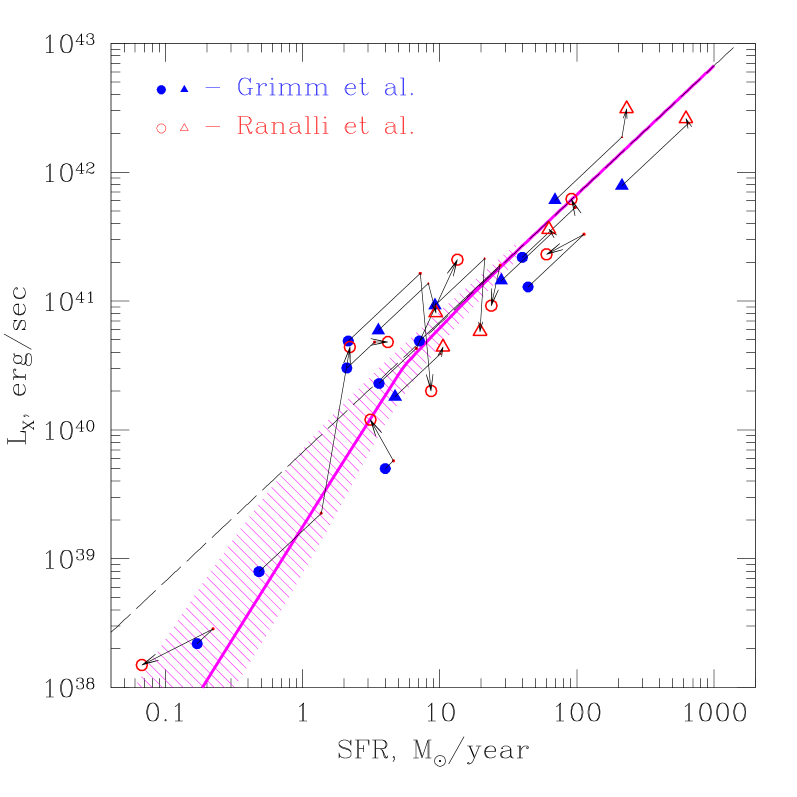
The Fig.2 compares positions of the galaxies present in the both samples in the –SFR plane. Note, that the difference in the adopted distances does not have effect at high values of SFR where the –SFR relation is linear, but it might destroy the correlation in the non-linear low SFR regime.
2.2 Hubble Deep Field North
Both Grimm et al. (2003) and Ranalli et al. (2003) used similar selection criteria. Each sample contains seven sources, of which six are present in both samples. The sources #185 and #148 (according to Table 2 in Brandt et al. (2001)) are absent from the R and G correspondingly. The latter was excluded from sample G because no 1.4 GHz flux was detected, with the upper limit of 23 Jy (Richards et al., 1998). The main difference lies in computing the X-ray fluxes and luminosities. Grimm et al. (2003) used 2–8 keV fluxes from Chandra catalog and K-corrected them to 2–10 keV rest-frame luminosity using the spectral indexes from Brandt et al. (2001). Ranalli et al. (2003) derived the X-ray count rates in two redshift-corrected energy bands and based their final K-correction on the recomputed spectral indexes. The following cosmological parameters were used: km/s/Mpc, (sample R) and km/s/Mpc, , (sample G). The positions of the data points in the –SFR plane are compared in Fig.2.
3 LMXB contribution
Due to long evolutionary time scale, the population of low mass X-ray binaries is unrelated to the current star formation activity. It is, rather, proportional to the stellar mass of the host galaxy (Gilfanov, 2003). Hence, the X-ray emission from LMXBs can contaminate the –SFR relation, as exemplified by the Milky Way galaxy, in which the LMXBs contribution exceeds (Fig.1, Grimm, Gilfanov & Sunyaev, 2002). Although LMXB and HMXB sources can not be easily separated based on the X-ray data, and optical identifications are (potentially) available only for the most nearby galaxies, the number and combined luminosity of LMXBs can be sufficiently accurately predicted based on the stellar mass of the host galaxy (Gilfanov, 2003). Thus, relative contributions of LMXB and HMXB sources to the X-ray luminosity of the galaxy are defined by its position on the SFR plane (Fig.3).
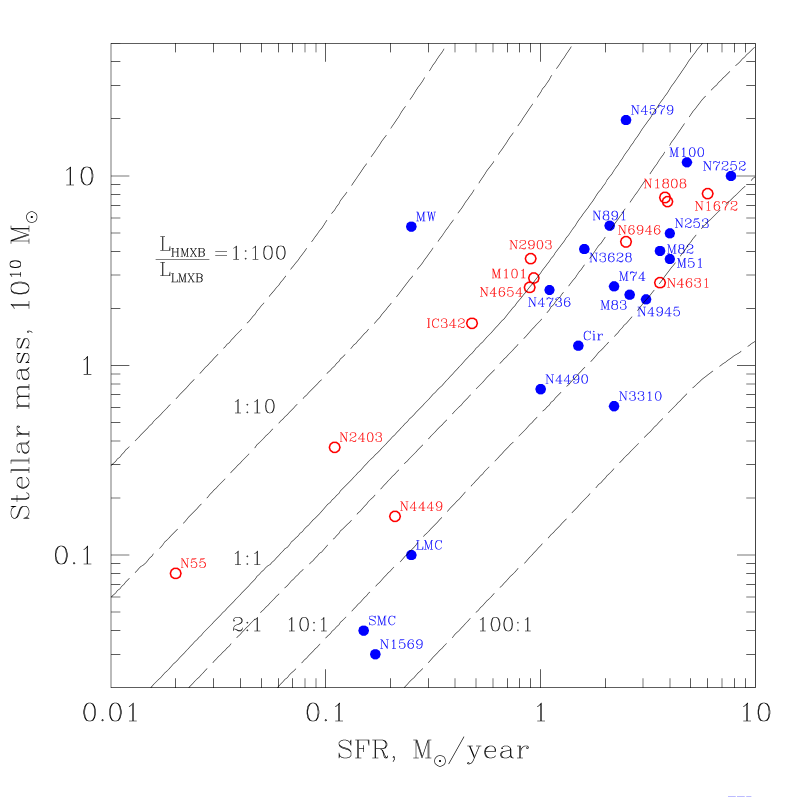
Stellar masses of the galaxies were calculated using K-band magnitudes from 2MASS Large Galaxy Atlas (Jarrett et al., 2000) with the color based correction to the mass-to-light ratio (Bell & de Jong, 2001). The mass of the Milky Way was calculated using its K-band luminosity obtained by Malhotra et al. (1996) from 3D modeling of the DIRBE data, and assuming the same mass-to-light ratio as in M31. The stellar masses of LMC and SMC were estimated from their dynamical masses (Grimm et al., 2003), assuming . The distances for the galaxies from the sample G are same as in Grimm et al. (2003). We re-examined the distance to low SFR galaxies. For NGC55 (1.6 Mpc) and M101 (7.2 Mpc) we adopted values from Puche, Carignan & Wainscoat ( 1991) and Jurcevic, Pierce & Jacoby (2000). The distances to NGC2403 (3.7 Mpc), NGC2903 (9.5 Mpc), NGC4449 (3.8 Mpc) and NGC4654 (17.6 Mpc) were estimated from IR Tully-Fisher relation (Aaronson et al., 1982) using data from Tormen & Burstein (1995) and calibration from Sakai et al. (2000). The distances to other galaxies from R sample are the same as in Ranalli et al. (2003).
The galaxies from R and G samples are plotted in the SFR plane in Fig.3, along with the contours of constant ratio. The luminosities of LMXB and HMXB sources were estimated from their respective average luminosity functions obtained by Grimm et al. (2003) and Gilfanov (2003). In estimating the LMXB luminosity we used average normalization for late type galaxies. Although in the limit of large number of sources linear relations hold, and , the contours are not straight lines at M M⊙ and SFR M⊙/yr due to effects of statistics (Gilfanov et al., 2003).
As expected, the “LMXB contamination” plays role mostly at low SFR values and becomes unimportant at high star formation rates. In all but one galaxies from the sample R having SFR M☉/yr, the expected contribution of LMXBs exceeds . These galaxies are shown in Fig.1 as upper limits. For two galaxies (NGC55 and NGC2403) mostly deviating from the common trend in Fig.1, the expected LMXB contribution exceeds .
4 Combined sample and predicted –SFR relation
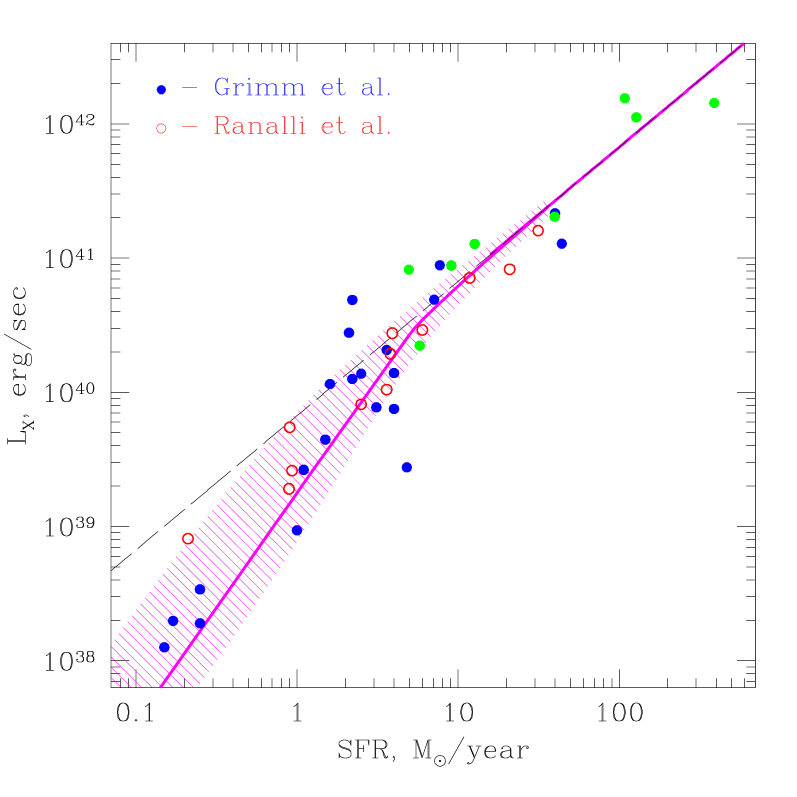
The Fig.4 shows all data from the samples G and R, excluding duplications. The tightness of relation at large (Fig.14 in Gilfanov 2003) allows one to approximately correct observed luminosities for the LMXB contribution. This correction was applied for all galaxies, except those with M⊙ and . The latter (NGC55, NGC2403 and IC342) are not plotted in Fig.4.
The solid curve in Fig.4 shows the predicted –SFR relation, calculated using the parameters of the “universal” HMXB luminosity function derived by Grimm et al. (2003) from analysis of five nearby star forming galaxies with best known luminosity functions. It corresponds to the mode of the probability distribution – the most likely value of the X-ray luminosity of a randomly chosen galaxy. The dashed line, on the contrary, shows the expectation mean – the value, that would result from averaging of the X-ray luminosities of many galaxies having similar values of SFR. Due to the properties of the probability distribution of the total luminosity of a population of discrete sources, , these two quantities are not identical in the low SFR limit, when the number of sources is small.
Due to skewness of the probability distribution (Fig.2 in Gilfanov 2003), large and asymmetric dispersion around the solid curve in Fig.4 is expected in the non-linear low SFR regime. The probability to find a galaxy below the curve is at SFR=/yr and increases to at SFR=/yr, near the break of the –SFR relation. Of course in the linear regime (SFR/yr) it asymptotically approaches , as expected. This asymmetry is already seen from the distribution of the points in Fig.4 – at low SFR values there are more points above the solid curve, than below. Moreover, the low probability high luminosity tail of the distribution will lead to appearance of galaxies-outliers with significantly larger than expected value of the total luminosity. Such galaxies will inevitably appear as the plot is populated with more objects. Non-gaussianity of the distribution makes least square and fitting techniques inadequate for analysis of the –SFR relation in the low SFR regime.
5 Conclusion
We compared results of Grimm et al. (2003) and Ranalli et al. (2003) on relation of the X-ray luminosity and the star formation rate in normal galaxies (Fig.1 and 2).
Addressing the discrepancy in the low SFR regime, we note that six out of seven galaxies from Ranalli et al. (2003), having SFR M☉/yr, are likely to be contaminated by the X-ray emission from low mass X-ray binaries, having no relation to the current star formation activity. Furthermore, at and SFR M⊙/yr, the expected luminosity of X-ray binaries does not exceed erg/s. This is comparable or smaller than that of low luminosity AGNs often found by Chandra in otherwise apparently normal galaxies. The AGN contribution can not be identified and separated, unless high angular resolution imaging data are available. Secondly, the probability distribution of the total luminosity of a population of discrete sources, , is significantly non-Gaussian for low values of . This should not be ignored when analyzing and interpreting the –SFR relation in the low SFR regime.
The most important conclusion is, however, that after the potentially “LMXB contaminated” galaxies are excluded, the two datasets become consistent with each other, despite of their different content, variability effects, difference in the adopted source distances, X-ray flux and star formation rate determination and in the cosmological parameters used in interpreting the HDF-N data. The difference in the calibration of the –SFR relation is insignificant considering the number and amplitude of the uncertainties involved. They also agree well, both in the low and high SFR regimes, with the predicted –SFR dependence derived from the parameters of the “universal” HMXB luminosity function (Fig.4). This is an encouraging result emphasizing the potential of X-ray luminosity as an independent star formation rate indicator.
6 Acknowledgements
We are grateful the referee, Dr. Pranab Ghosh, for critical and stimulating comments on the original manuscript which helped to improve the paper.
References
- Aaronson et al. (1982) Aaronson M. et al., 1982, ApJS, 50, 241
- Bell & de Jong (2001) Bell E. & de Jong R., 2001, ApJ, 550, 212
- Brandt et al. (2001) Brandt W.N. et al., 2001, AJ, 122, 2810
- Gilfanov (2003) Gilfanov M., submitted to MNRAS, astro-ph/0309454
- Gilfanov et al. (2003) Gilfanov M., Grimm H.-J. & Sunyaev R., 2003, in preparation
- Grimm et al. (2002) Grimm H.-J., Gilfanov M.& Sunyaev R., 2002, A&A, 391, 923
- Grimm et al. (2003) Grimm H.-J., Gilfanov M.& Sunyaev R., 2003, MNRAS, 339, 793
- Jurcevic et al. (2000) Jurcevic J.S., Pierce M.J. & Jacoby G.H., 2000, MNRAS, 313, 868
- Jarrett et al. (2000) Jarrett T.H., Chester T., & Cutri R., 2003, AJ, 125, 525
- Malhotra et al. ( 1996) Malhotra S. et al., 1996, ApJ, 473, 687
- Puche et al. ( 1991) Puche D., Carignan C. & Wainscoat R., 1991, AJ, 101, 447
- Ranalli et al. (2003) Ranalli P., Comastri A. & Seti G., 2003, A&A, 399, 39
- Richards et al. (1998) Richards E.A. et al., 1998, Astron.J., 116, 1039
- Sakai et al. ( 2000) Sakai S. et al., 2000, ApJ, 529, 698
- Tormen & Burstein ( 1995) Tormen G. & Burstein D., 1995, ApJS, 96, 123