T. Goto et al.The Environment of Passive Spiral Galaxies in the SDSS \Received2003/01/16\Accepted2003/06/23
galaxies: clusters: general galaxies: evolution galaxies: spiral
The Environment of Passive Spiral Galaxies in the SDSS
Abstract
In previous work on galaxy clusters, several authors reported the discovery of an unusual population of galaxies, which have spiral morphologies, but do not show any star-formation activity. These galaxies are called “passive spirals”, and have been interesting since it has been difficult to understand the existence of such galaxies. Using a volume-limited sample (0.050.1 and ; 25813 galaxies) of the Sloan Digital Sky Survey data, we found 73 (0.280.03%) passive spiral galaxies and studied their environments. It is found that passive spiral galaxies exist in a local galaxy density of 1–2 Mpc-2 and have a 1–10 cluster-centric virial radius. Thus, the origins of passive spiral galaxies are likely to be cluster-related. These characteristic environments coincide with a previously reported environment where the galaxy star-formation rate suddenly declines and the so-called morphology-density relation turns. It is likely that the same physical mechanism is responsible for all of these observational results. The existence of passive spiral galaxies suggests that a physical mechanism that works calmly is preferred to dynamical origins such as major merger/interaction since such a mechanism would destroy the spiral-arm structures. Compared with the observed cluster galaxy evolution such as the Butcher–Oemler effect and the morphological Butcher–Oemler effect, passive spiral galaxies are likely to be a key galaxy population in transition between red, elliptical/S0 galaxies in low-redshift clusters and blue, spiral galaxies more numerous in higher-redshift clusters.
1 Introduction
Recent morphological studies of distant cluster galaxies have revealed the presence of an unusual population of galaxies with a spiral morphology and lack of star-formation activity (Couch et al. 1998; Dressler et al. 1999; Poggianti et al. 1999). The origins of these “passive spirals” have remained a mystery since it has been difficult to understand the existence of such galaxies. The phenomena suggest that star formation in these system has ended calmly, without disturbing their spiral-arm structures. Many people speculated that cluster-related phenomena might be responsible for creation of passive spiral galaxies since they are found during cluster studies. However, it has not been well established whether these phenomena are more relevant in clusters, or are common in the field regions as well, simply because it has been difficult to study this rare class of galaxies in the field region.
Also, the existence of a similar type of galaxies has been reported. Galaxies with a low arm/inter-arm contrast in their disks were classified as anemic by van den Bergh (1976). He found an excess of anemic spiral galaxies in the Virgo cluster. Various Hi follow-up observations have revealed a lower gas density in anemic spiral galaxies, presumably lowering the star-formation rate and making the spiral arms smoother (Bothun, Sullivan 1980; Wilkerson 1980; Phillipps 1988; Cayatte et al. 1994; Bravo-Alfaro et al. 2001). Especially, Elmegreen et al. (2002) found that the gas surface density of anemic spirals is below the threshold for star formation (Kennicutt 1989), revealing that low star formation in anemic spirals in fact comes from a low gas density. Although the definition of anemic spiral galaxies is somewhat different from that of passive spirals, considering similarities in properties (presence of spiral arms and lack of star formation), these two types of galaxies could be essentially the same population of galaxies, sharing the same nature and origin.
Various possible mechanism are proposed to explain these phenomena. Poggianti et al. (1999) found passive spiral galaxies in their sample of distant clusters, and speculated that these findings show that the time scale of spectral changes of cluster galaxies is shorter than the time scale of morphological change of galaxies. They proposed ram-pressure stripping (Spitzer, Baade 1951; Gunn, Gott 1972; Farouki, Shapiro 1980; Kent 1981; Fujita 1998; Abadi et al. 1999; Fujita, Nagashima 1999; Quilis et al. 2000) as a possible physical mechanism responsible for these phenomena. Another possible cause is abrupt truncation of gas infall onto disks from the halo regions (Larson et al. 1980). Dynamical causes such as major galaxy merging or harassment, which explain other properties of cluster galaxies very well (e.g., the Butcher–Oemler effect; Butcher, Oemler 1978, 1984), cannot explain these phenomena since such processes disturb the spiral arms and do not end up with passive spirals. A pioneering work to simulate passive spiral galaxies by combining a numerical simulation and a phenomenological model was performed by Bekki et al. (2002). They demonstrated that halo gas stripping caused by a dynamical interaction between the halo gas and the hot ICM is a plausible mechanism. Although these mechanisms are all plausible, no final conclusion about what mechanisms are responsible for these phenomena has yet drawn.
It is also interesting to investigate a possible link between passive spirals and statistical observational features of cluster galaxies. In cluster regions, it is known that fractions of blue galaxies are larger at higher redshifts. (the Butcher–Oemler effect; Butcher, Oemler 1978, 1984; Rakos, Schombert 1995; Couch et al. 1994,1998; Margoniner, de Carvalho 2000; Margoniner et al. 2001; Ellingson et al. 2001; Kodama, Bower 2001; Goto et al. 2003a). Cluster galaxies are also known to change their morphology during the cosmic timescale, e.g., spiral to S0 transition (Couch, Sharples 1987; Dressler et al. 1997; Couch et al. 1998; Fasano et al. 2000; Diaferio et al. 2001) or the morphological Butcher–Oemler effect (Goto et al. 2003a). If passive spiral galaxies are cluster-originated, they might fit well in both spectral and morphological evolution of cluster galaxies, as galaxies in transition between blue and red, or spiral and S0s.
Since the Sloan Digital Sky Survey (SDSS; York et al. 2000) observes the spectra of one million galaxies in one quarter of the sky, It provides us with the opportunity to study this interesting population of galaxies in all environments, from cluster core regions to general field regions. Several of the largest cluster catalog are compiled using the SDSS data (Annis et al. 1999; Kim et al. 2002; Goto et al. 2002a; Miller et al. in preparation). In addition, a wide spectral coverage of 3800–9000 Å allows us to study both [Oii] and H emission lines at the same time, which can reduce possible biases from dust extinction and stellar absorption on the emission lines. In this paper, we concentrate on revealing the environment of passive spiral galaxies. In section 2, we explain the data used in the study. In section 3, we carefully define passive spiral galaxies. In section 4, we present the environment of passive spiral galaxies. In section 5, we discuss the possible caveats and interpretation of the results. In section 6, we summarize our findings. The cosmological parameters adopted throughout this paper are =75 km s-1 Mpc-1, and (,,)=(0.3,0.7,0.0).
2 Data
In this section, we outline the data used in this paper. The galaxy catalog is taken from the Sloan Digital Sky Survey (SDSS; for more details, see Fukugita et al. 1996; Gunn et al. 1998; Lupton et al. 1999, 2001; York et al. 2000; Eisenstein et al. 2001; Hogg et al. 2001; Richards et al. 2002; Stoughton et al. 2002; Strauss et al. 2002; Smith et al. 2002; Blanton et al. 2003a; Pier et al. 2003). The SDSS imaging survey observes one quarter of the sky to depths of 22.3, 23.3, 23.1, 22.3, and 20.8 in the and filters, respectively (see Fukugita et al. 1996 for the SDSS filter system, Hogg et al. 2001 and Smith et al. 2002 for its calibration). Since the SDSS photometric system is not yet finalized, we refer to the SDSS photometry presented here as and . We correct the data for galactic extinction determined from maps given by Schlegel, Finkbeiner, and Davis (1998). We include galaxies to =17.7 (Petrosian magnitude), which is the target selection limit of the main galaxy sample of the SDSS spectroscopic survey. The spectra are obtained using two fiber-fed spectrographs (each with 320 fibers) with each fiber subtending 3 arcsec on the sky. (We investigate aperture bias due to the limited size of the SDSS fiber spectrograph in the appendix). The wavelength coverage of the spectrographs is 3800 Å to 9200 Å, with a spectral resolution of 1800. These spectra are then analyzed via the SDSS SPECTRO1D data-processing pipeline to obtain various quantities for each spectrum such as redshift, spectral classification, and various line parameters. (see Stoughton et al. 2002; Frieman et al. in preparation, for further details). The SDSS has taken 189763 galaxy spectra as of the date of writing. Among them we restrict our sample to galaxies with S/N in band greater than 5 and with a redshift confidence of . Since we use a concentration parameter in selecting passive spiral galaxies, we also remove galaxies with a PSF size in band greater than 2.”0 to avoid poor seeing mimicking less concentrated galaxies. Then we make a volume-limited sample by restricting our sample to 0.050.1 and . This magnitude limit corresponds to +0.3 mag (Blanton et al. 2001). The lower redshift cut is made to avoid strong aperture effects (see appendix for detailed investigation in aperture effects). When calculating absolute magnitudes, we use a -correction code provided by Blanton et al. (2003b; v1_11). In this volume-limited sample, there are 25813 galaxies.
3 Selection of Passive Spiral Galaxies
3.1 Line Measurements
We measured [Oii], H and H equivalent widths (EWs) by the flux-summing method as described in Goto et al. (2003b). We briefly summarize the method here. To estimate the continuum, we fit a line using a wavelength range around each line as listed in table 1. The continuum values were weighted according to the inverse square of the errors during the fitting procedure. We then sum the flux in the wavelength range listed in the same table to obtain the equivalent width of the lines. For the H line, we used two different wavelength ranges: wider one for a strong line and narrower one for a weak line (details are described in Goto et al. 2003b). Note that for the H line, we did not deblend the adjacent [Nii] lines. As a result, our H equivalent width had contamination from the [Nii] lines. However, the contamination was less than 5% from [Nii](6648 Å) and less than 30% from [Nii](6583 Å). These measurements show good agreement with measurements via Gaussian fitting (Goto et al. 2003b). We, however, stress the importance in using the flux-summing method instead of a Gaussian-fitting method, which is often used in other work (e.g., Gómez et al. 2003). Although a Gaussian fitting method works very well for strong lines on high signal-to-noise spectra, the fit often fails on low signal-to-noise spectra, especially when the line is weak. Therefore, a Gaussian-fitting method is not suitable to study passive spiral galaxies, which intrinsically have little emission lines. On the other hand, the flux-summing method is less affected by the noise of the spectra, and thus, is suitable for this study.
We quantified errors of these measurement using spectra observed twice in the SDSS. The procedure was exactly the same as described in Goto et al. (2003b). First, the difference of equivalent width was plotted against S/N of the spectra . We then fit a 3rd polynomial to the 1 of the distribution. The polynomial was later used to assign errors to every spectra according to its S/N. The exact formula are given in Goto et al. (2003b). Typical errors of high signal-to-noise spectra are 1.3, 1.0 and 0.4 Å for [Oii], H and H EWs, respectively (See Figures 9–11 of Goto et al. 2003b).
3.2 Selection Criteria
We selected passive spiral galaxies using the following criteria. Galaxies with an inverse of concentration parameter, 0.5. The inverse concentration parameter () is defined as the ratio of the Petrosian 50% light radius to the Petrosian 90% light radius in band (radius which contains 50% and 90% of Petrosian flux, respectively). Shimasaku et al. (2001) and Strateva et al. (2001) studied the completeness and contamination of this parameter in detail. See Goto et al. (2003a) and Gómez et al. (2003) for more usage of this parameter. The border line between spiral galaxies and elliptical galaxies are around =0.33. Therefore 0.5 can select very less-concentrated spiral galaxies. In different work, 549 galaxies in our volume-limited sample were manually classified by Shimasaku et al. (2001) and Nakamura et al. (2003). In figure 1, we overplot eye-classified galaxies on a vs. plane. The contours show the distribution of all galaxies in our volume-limited sample. Note that our volume-limited sample contains a high fraction of concentrated galaxies as shown by contours due to its bright absolute magnitude limit (Yagi et al. 2002; Goto et al. 2002b). In the top left panel, eye-classified ellipticals are overplotted. In the top right, bottom left, bottom right panels, eye-classified S0s, Sa-Sb, Sc or later are overplotted, respectively. As shown in Strateva et al. (2001), also separates early and late-type galaxies well. To exclude contamination from S0 galaxies as much as possible, we adopted stricter criteria (0.5) than the 0.4 criteria often used in other work (e.g., Gómez et al. 2003; Goto et al. 2002b, 2003a). As these panels show, few of elliptical or S0 galaxies have . Therefore, we in fact were able to select spiral galaxies using parameter, without significant contamination from the E/S0 population. We caution readers that the selection of less-concentrated galaxies has a known bias against edge-on galaxies, in the sense that edge-on disc galaxies are excluded from our sample. A detailed investigation and correction of this bias will be presented in Yamauchi et al. (in preparation). However, we accept this bias in our sample selection since (i) the bias is independent of the local galaxy environment; (ii) edge-on galaxies might be affected by a larger amount of dust extinction, and thus could cast some doubts on the truly passive nature of our sample galaxies.
From the spectral features, we select galaxies using the following
criteria:
| (1) |
| (2) |
where the emission lines have positive signs. In other words, we selected galaxies with [Oii] and H less than 1 detection (in emission). A galaxy that satisfies both the concentration and spectral criteria was regarded as being a passive spiral galaxy in this work. An alternative way is to use the star-formation rate (SFR). However,, since passive spirals intrinsically have little emissions in [Oii] and H, it is erroneous to calculate SFR based on [Oii] or H. Therefore it is clearer to select a sample based on the detection or non-detection of emission lines. Figure 2 shows the distribution of passive spiral galaxies in the vs. plane.
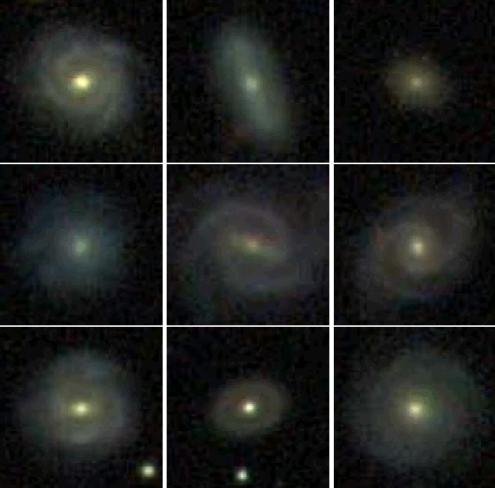
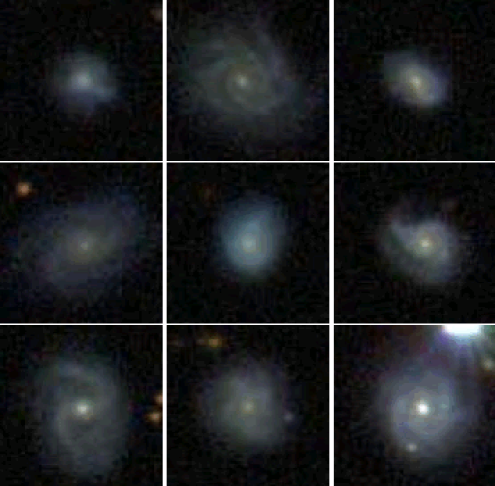
Figure 3 shows example images (30”30”) of passive spiral galaxies. In figure 4, corresponding spectra are shown. Unusual properties of these galaxies are already clear just by comparing these two figures, i.e., clear spiral arm structures are seen in the images, whereas there is no current star-formation activity as shown by the lack of [Oii] and H emission lines in the spectra. It is interesting to study from where these unique features originate. For a comparison, we also select active (normal) spiral galaxies in our sample as galaxies with 0.5 and 1 detections in both [Oii] and H in emission. We removed galaxies with an AGN signature from the active spiral sample using a prescription given in Kewley et al. (2001) and Gómez et al. (2003). When a galaxy satisfied all three line ratio criteria to be an AGN (Figure 15, or equations 5, 6, and 7 of Kewley et al. 2001), we removed it from our sample as an AGN. Images and spectra of active (normal) spiral galaxies are shown in figures 5 and 6. Compared with these galaxies, passive spirals have smoother profiles.
Among 25813 galaxies in our volume-limited sample (0.050.1 and ), there are 73 (0.280.03%) passive spiral galaxies in total. The number of active spirals is 1059 (4.100.12%). The relatively small percentages stem from our stringent criteria for the inverse concentration parameter, .
4 Environment of Passive Spiral Galaxies
4.1 Local Galaxy Density
First, we clarify the environment where passive spiral galaxies exist. For each galaxy, we measure the projected metric distance to the 5th nearest galaxy (within 3000 km s-1 of the galaxy in redshift space) from within the same volume-limited sample as defined above (0.050.1 and ). If the projected area (in ), enclosed by the 5th nearest neighbor distance, touched the boundaries of the SDSS data, we corrected the area appropriately for the amount of missing area outside the survey boundaries. Then, we divided 5 (galaxies) by the area subtended by the 5th nearest galaxy to obtain the local galaxy density in Mpc-2. This methodology allowed us to quote pseudo three-dimensional local galaxy densities for all of our galaxies in the volume-limited sample, and did not require us to make any correction for background and foreground contamination.
In figure 7, we plot the density distribution of passive spiral galaxies by the dotted line. The solid line shows the distribution of all galaxies in our volume-limited sample. The long-dashed line shows the distribution of cluster galaxies defined as galaxies within 0.5 Mpc from the nearest C4 galaxy cluster (Gómez et al. 2003) in the angular direction and within from the redshift of a cluster. Kolomogorov–Smirnov tests show that all of the distributions are different from each other with more than a 99.9% significance level. The environment of passive spiral galaxies is not in a cluster region, nor in the general field as a normal galaxy. On the contrary, the distribution of passive spiral galaxies is right in the middle of cluster galaxies and field galaxies. The dotted line also shows that passive spiral galaxies avoid cluster core regions; at the same time they do not show the same distribution as field galaxies. For a comparison, we plot a distribution of active (normal) spiral galaxies by the short-dashed line. Compared with that of all galaxies, the distribution slightly shifts to a less-dense environment, as expected from the morphology–density relation. The distribution is different from that of passive spirals with more than 99.9% significance.
4.2 Cluster-Centric Radius
In figure 8, we plot the distribution of passive spiral galaxies as a function of the cluster-centric radius. Here, the cluster-centric radius is measured as the projected distance to the nearest cluster within 3000 km s-1 from the cluster redshift. The cluster list is taken from Miller et al. in preparation, which measures a cluster center as the position of the brightest cluster galaxy. The physical distance is normalized to the virial radius using the relation in Girardi et al. (1998). We divide distributions by that of all galaxies and then normalize them to unity for clarity. Note that comparisons of fractions between different curves are meaningless due to this normalization. The dotted, hashed line shows the distribution of passive spiral galaxies. The solid lines show that of active (normal) spiral galaxies. The dashed line is for early-type galaxies selected using parameter (0.33) with no constrains on the emission lines. The fraction of early-type galaxies is higher in smaller cluster-centric radius and that of spiral galaxies are higher in larger-radius regions, which represents the so-called “the morphology-density relation” (Dressler 1980; Dressler et al. 1997; Postman, Geller 1984; Fasano et al. 2000; Goto et al. 2003c). Passive spiral galaxies are preferentially in 1–10 virial radius, which suggests that they exist in cluster infalling regions along with the previous figure.
4.3 Photometric and Spectroscopic Properties
In figure 9, we plot the distribution of passive spiral galaxies in the rest-frame vs. plane. Instead of Petrosian magnitude, we use the model magnitude to compute the colors of galaxies since the signal-to-noise ratio is higher for the model magnitude. In the SDSS, the model magnitudes are measured using the Petrosian radius measured in band. (Thus the same radius is used to measure the model magnitudes in 5 filters. See Stoughton et al. 2002 for more details on the SDSS magnitudes.) The observed colors are -corrected to the restframe using the -correction given in Blanton et al. (2003b; v1_11). The contours show the distribution of all galaxies in the volume-limited sample for comparison. A peak of the contour around (, ) = (0.75, 0.4) consists of elliptical galaxies. The distribution of spiral galaxies extends to the bluer direction in both and . Interestingly, passive spiral galaxies are almost as red as elliptical galaxies in , reflecting the truly passive nature of these galaxies. Note that because colors are photometrically determined, they are free from the aperture bias. In color, some passive spirals are almost as blue as spiral galaxies. Although a detailed comparison with population synthesis models is needed, a combination of dust extinction and low metallicity might be able to explain the bluer color.
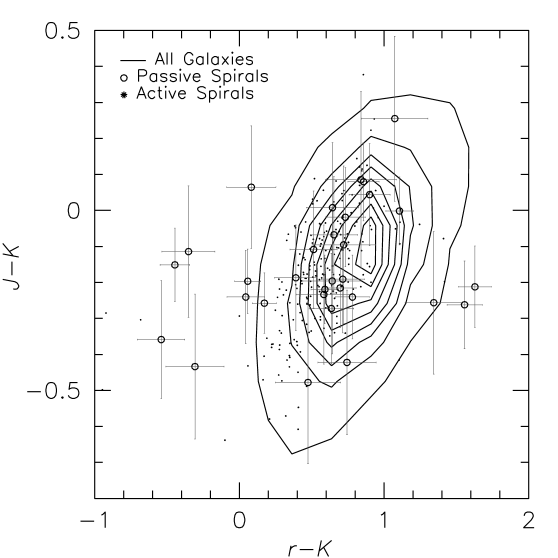
In figure 10, we present restframe vs. colors of passive and active galaxies by open and solid dots, respectively. Infrared colors are obtained by matching our galaxies to the Two Micron All Sky Survey (2MASS; Jarrett et al. 2000) data. Infrared magnitudes are shifted to the rest-frame using -corrections given in Mannucci et al. (2001). If passive spiral galaxies are actually star-forming, but emission lines are invisible at the optical wavelength due to heavy obscuration by dust, then such dusty galaxies should have a redder color in by 1 mag (e.g., see Figure 2 of Smail et al. 1999). Among our sample galaxies, 31/73 passive spirals (9317/25813 all galaxies) were measured with 2MASS. As in the previous figure, the solid lines show distribution of all galaxies in the volume-limited sample. Compared with the solid lines, active spirals show a slightly bluer distribution in . There are three passive spirals around 1.5, which might have star formation hidden by dust at optical wavelength. The majority of passive spirals, however, do not show significantly bluer distribution in than all galaxies, suggesting that the majority of passive spirals do not have dust-enshrouded star formation.
In figure 11, we plot the distributions of H EW for passive spirals (dotted lines), active spirals (dashed lines) and all galaxies (solid lines) in the volume-limited sample. H EWs are measured using the flux-summing method discussed in Goto et al. (2003b). The flux-summing method is robust for weak absorption lines and noisy spectra. In the figure, the absorption lines have positive EWs. As shown in the figure, passive spirals have very weak H absorption peaked at around 0 Å. In contrast, active spirals have much stronger H absorption. Since H absorption becomes strong only when A-type stars are dominant in the galaxy spectra, it is a good indicator of the post-starburst phase of a galaxy. For example, E+A galaxies (Zabludoff et al. 1996; Balogh et al. 1999; Dressler et al. 1999; Poggianti et al. 1999) are thought to be post-starburst galaxies since they do not have any current star formation (no [Oii] nor H in emission), but do have many A-type stars (strong H absorption). Such a phase can only appear when a starbursting galaxy truncates its starburst (a post-starburst phase). Therefore, small H EWs of passive spirals indicate that they are not in a post-starburst phase. The origin of passive spirals are likely to be different from that of E+A (or post-starburst) galaxies, which recently have been found to be merger/interaction related (Goto et al. 2003b,d). Passive spirals seem to have stopped their star formation gradually, rather than experiencing sudden truncation.
5 Discussion
In subsection 3.2, we have selected an unusual population of galaxies with a spiral morphology and without emission lines such as H and [Oii]. The optical color–color diagram (figure 9) also revealed that these galaxies are as red as elliptical galaxies, reflecting the passive nature of these galaxies. One possible explanation for these galaxies is heavy obscuration by dust. In such a case, passive spiral galaxies might have star-formation activity just as normal galaxies, but the star-formation might be hidden by dust. The scenario could be consistent with both of our observational results: lack of emission lines and red colors in the optical wavelength. However, in color (figure 10), the majority of passive spiral galaxies do not appear to be much redder than normal galaxies. For example, radio-detected galaxies in Smail et al. (1999) are redder than other galaxies by 1 mag in . Therefore, figure 10 is against the dust-enshrouded scenario, which should results in a very red color, and thus suggests the truly passive nature of these galaxies. In addition, it is not likely that very dusty galaxies preferentially live in cluster infalling regions.
In subsection 4.1, we reveal that passive spiral galaxies preferentially exist in cluster infalling regions, using both the local galaxy density (figure 7) and the cluster-centric radius (figure 8). This is direct evidence to connect the origins of these galaxies to the cluster environment. The characteristic environments are 1–2 Mpc-2 in the local galaxy density and 1–10 virial radius in the cluster-centric radius. Quite interestingly, these environments coincide with the characteristic density and radius where star-formation rate declines toward the cluster center or the dense environment. Gómez et al. (2003) and Lewis et al. (2002) studied the star-formation rate in a galaxy as a function of the cluster-centric radius and the local galaxy density, and found that the star-formation rate declines around the same environment as we found in the present study. Furthermore, Goto et al. (2003c) studied the morphology–density relation using similar SDSS data (0.050.1 and ) and an automated galaxy classification (Yamauchi et al. in preparation). They found that the morphological fraction of galaxies starts to change approximately at the same environment as our study: the fraction of S0 and elliptical galaxies starts to increase (and Sc galaxies decrease) toward cluster center, or larger galaxy density right at around 1 cluster-centric virial radius, or local galaxy density 1 Mpc-2. These coincidences in the environment suggest that the same mechanism might be responsible for all of the effects happening: the creation of passive spiral galaxies; the decrease of the galaxy star-formation rate; and the morphological change in the relative galaxy fraction. These coincidences might be explained naturally by the following interpretation: As galaxies approach this critical environment (1–2 Mpc-2 or 1–10 virial radius), they stop their star formation as shown in Gómez et al. (2003), by changing spiral galaxies into passive spiral galaxies as found in this study. If a spiral galaxy stops star formation calmly without its morphology being disturbed, it is likely to develop to be a S0 galaxy (Bertin, Romeo 1988; Bekki et al. 2002) as is seen in the morphology–density relation of Goto et al. (2003c). According to this scenario, passive spirals are likely to be a population of galaxies in transition. In addition, there have been many results from other observations and surveys that supports this scenario. Abraham et al. (1996) reported that cluster members become progressively bluer as a function of the cluster-centric distance out to 5 Mpc in Abell 2390 (). Terlevich, Caldwell, and Bower (2001) reported that colors of early-type galaxies are systematically bluer outside of the core of the Coma cluster. Pimbblet et al. (2002) studied 11 X-ray luminous clusters (0.070.16), and found that median galaxy color shifts bluewards with decreasing local galaxy density. At higher redshift, Kodama et al. (2001) reported that the colors of galaxies abruptly change at sub-clump regions surrounding a cluster at . Although it is difficult to directly compare this environment with ours due to the different definitions of the local galaxy density, it is highly possible that their color change occurs in the same environment that we found. van Dokkum et al. (1998) found S0 galaxies in the outskirt of a cluster at . These S0s show a much wider scatter in their colors, and are bluer on average than those in cluster cores, providing possible evidence for recent infall of galaxies from the field. In addition, many studies reported that star formation in the cores of clusters is much lower than that in the surrounding field (e.g., Balogh et al. 1997, 1998, 1999, 2002; Poggianti et al. 1999; Martin et al. 2000; Couch et al. 2001).
The existence of passive spiral galaxies also brings us a hint about the origin of these three phenomena. It supports a transformation of galaxies, which does not disturb the arm structures of spiral galaxies. Possible preferred candidate mechanisms include ram-pressure stripping (Spitzer, Baade 1951; Gunn, Gott 1972; Farouki, Shapiro 1980; Kent 1981; Fujita 1998; Abadi et al. 1999; Fujita, Nagashima 1999; Quilis et al. 2000) and simple removal of gas reservoir (Larson et al. 1980; Balogh et al. 1999; Bekki et al. 2001,2002). The evaporation of the cold gas in disc galaxies via heat conduction from the surrounding hot ICM might be able to reduce the star-formation rate in a galaxy (Cowie, Songaila 1977; Fujita 2003). It has been known that preheating of the intergalactic medium can affect the morphologies of galaxies by strangling the gas accretion (strangulation; Mo, Mao 2002; Oh, Benson 2002). In fact, Finoguenov et al. (2003a) found filamentary gas in the Coma cluster, and predicted the existence of passive spirals around the filament. Although the characteristic environment (1–2 Mpc-2 or 1–10 virial radius) might seem to have slightly too low density for ram-pressure or strangulation to occur, it is possible for galaxy sub-clumps around a cluster to have local hot gas that is dense enough for stripping (Fujita et al. 2003). Indeed, Kodama et al. (2001) found that galaxy colors change at such sub-clumps around a cluster.
Perhaps major merger/interaction origins are less preferred since such dynamical processes disturb the arm structures in spiral galaxies, and thus do not result in creating passive spirals. For example, Finoguenov et al. (2003b) found a disturbed signature in M86, proposing that M86 is likely to be merger originated. The weak H absorption lines shown in figure 11 also support a quiescent transformation of galaxies. However, we can not exclude a minor merger origin since such a process might be able to occur without disturbing the spiral arms. In their morphology–density relation study, Goto et al. (2003c) observed a decrease of S0s and an increase of ellipticals at cluster cores (virial radius 0.3 or galaxy density 6 Mpc-2), and proposed that the major merger/interaction might be dominant in the cluster core regions. The proposal is consistent with our results, which showed devoid of passive spiral galaxies within 0.6 virial radius, or greater than 3 Mpc-2 in local galaxy density. On the other hand, some theoretical work predicts that it is difficult to have frequent merger/interaction in cluster cores since the relative velocities of galaxies are so high in such regions (Ostriker 1980; Binney, Tremaine 1987; Mamon 1992; Makino, Hut 1997). In such a case, S0s (or passive spirals) might simply fade away to be a small elliptical galaxy. In summary, implication for the cluster core regions is either (i) passive spiral galaxies merged into large elliptical galaxies in cluster cores, or (ii) the discs of passive spiral galaxies completely fade away to become small elliptical galaxies.
Also, in terms of cluster galaxy evolution, passive spiral galaxies might fit well with the previous observational results. It has been known that a fraction of blue galaxies is larger in higher redshift (the Butcher–Oemler effect; Butcher, Oemler 1978, 1984; Couch, Sharples 1987; Rakos, Schombert 1995; Couch et al. 1998; Margoniner, de Carvalho 2000; Margoniner et al. 2001; Ellingson et al. 2001; Kodama, Bower 2001; Goto et al. 2003a) and that the fraction of cluster spiral galaxies are also larger in the past (Dressler et al. 1997; Couch et al. 1998; Fasano et al. 2000; Diaferio et al. 2001; Goto et al. 2003a). Many people have speculated about the morphological transformation from spiral galaxies to S0 galaxies (e.g., Dressler et al. 1997; Smail et al. 1998; Poggianti et al. 1999; Fabricant et al. 2000; Kodama, Smail 2001). Fraction of early-type galaxies in rich clusters are smaller in the past (Andreon et al. 1997; Dressler et al. 1997; Lubin et al. 1998; van Dokkum et al. 2000). From a morphological point of view, since passive spiral galaxies have already stopped star formation, in the near future, their disc structures will become fainter and fainter, to be seen as disc galaxies with smoother profile, i.e., possibly S0 galaxies. Spectrally, passive spirals are already almost as red as elliptical galaxies, but their spiral arms must have experienced star-formation activity until recently; therefore, a passive spiral galaxy itself must have been much bluer in the past, just like the blue population of galaxies that are numerous in the higher redshift clusters. Therefore, although this is not direct evidence, it is very likely that passive spiral galaxies are a population of galaxies in transition, during the course of the Butcher–Oemler effect and the morphological Butcher–Oemler effect. Perhaps, it is also worth noting that E+A (K+A or post-starburst) galaxies often thought to be cluster-related are found to have their origin in merger/interaction with accompanying galaxies (Goto et al. 2003b,d), and thus E+A galaxies are not likely to be a product of the morphological transition in the cluster regions.
6 Conclusions
Using a volume-limited sample of the SDSS data, we studied the environment of passive spiral galaxies as a function of the local galaxy density and cluster-centric radius. Since passive spirals were only found in cluster regions in previous work, this was the first attempt to select passive spirals uniformly, in all environments. It is found that passive spiral galaxies exist in a local galaxy density of 1–2 Mpc-2 and 1–10 virial radius. Thus, the origins of passive spiral galaxies are likely to be cluster-related. These characteristic environments coincide with the environment where the galaxy star-formation rate suddenly declines (Lewis et al. 2002; Gómez et al. 2003) and the fractions of galaxy morphology start to deviate from the field value (Goto et al. 2003c). Therefore, it is likely that the same physical mechanism is responsible for all of these observational results: the morphology-density relation; the decline of star formation rate; and the creation of passive spiral galaxies. The existence of passive spiral galaxies suggest that a physical mechanism that works calmly is preferred to dynamical origins such as a major merger/interaction since such a mechanism can destroy the spiral-arm structures. Passive spiral galaxies are likely to be a galaxy population in transition between red, elliptical/S0 galaxies in low redshift clusters and blue, spiral galaxies numerous in higher redshift clusters as seen in the Butcher–Oemler effect and the morphological Butcher–Oemler effect.
We are grateful to Sidney van den Bergh, Don York, Masayuki Tanaka, Robert C. Nichol, Andrew Hopkins, Alex Finoguenov and Michael Balogh for valuable comments, which contributed to improve the paper. We thank an anonymous referee for useful comments. T.G. acknowledges financial support from the Japan Society for the Promotion of Science (JSPS) through JSPS Research Fellowships for Young Scientists.
Funding for the creation and distribution of the SDSS Archive has been provided by the Alfred P. Sloan Foundation, the Participating Institutions, the National Aeronautics and Space Administration, the National Science Foundation, the U.S. Department of Energy, the Japanese Ministry of Education, Culture, Sports, Science and Technology, and the Max Planck Society. The SDSS Web site is http://www.sdss.org/.
The SDSS is managed by the Astrophysical Research Consortium (ARC) for the Participating Institutions. The Participating Institutions are The University of Chicago, Fermilab, the Institute for Advanced Study, the Japan Participation Group, The Johns Hopkins University, Los Alamos National Laboratory, the Max-Planck-Institute for Astronomy (MPIA), the Max-Planck-Institute for Astrophysics (MPA), New Mexico State University, Princeton University, the United States Naval Observatory, and the University of Washington.
Aperture Bias
Since SDSS spectroscopy is performed with a fiber spectrograph, which captures light within a 3 arcsec aperture, aperture bias is a concern. Aperture bias could result in an increase of passive spiral galaxies with decreasing redshift since at a lower redshift, a 3 arcsec fiber misses more light from a disc of a galaxy. Using the data from LCRS with a 3.5 arcsec fiber spectrograph, Zaritsky et al. (1995) showed that at , the spectral classifications of galaxies are statistically unaffected by aperture bias. Using a similar sample of the SDSS galaxies, Gómez et al. (2003) also limited their galaxies to , and proved that aperture bias does not change their results. We followed these two authors and limited our sample with 0.05 to minimize this potential bias. In the main analysis of the paper, there are several pieces of evidence suggesting that these passive spiral galaxies are not seriously biased by the aperture effect. In figure 9, passive spiral galaxies are much redder than normal galaxies. To calculate colors, we used a model magnitude which uses the Petrosian radius in for all colors (Stoughton et al. 2002), and is thus free from 3” aperture bias. Therefore, the red colors of these galaxies suggest that they are truly passive systems, and not an artifact of the aperture effect. Also, in figure 7, we compare the density distribution of passive spirals with normal star-forming spirals. The two distributions are statistically different. Again, if passive spirals are the artifact of aperture bias, the density distributions of star-forming and passive spiral galaxies should be similar. Therefore, this difference suggests that passive nature of these galaxies is truly unique to them. Figure 12 shows a difference in color between the fiber magnitude (measured with 3” aperture) and the model magnitude (measured using Petrosian radius in , usually larger than 3”, especially in low redshift) as a function of redshift. The color difference, , is defined as follows.
| (3) |
Therefore, is larger for more extended nearby galaxies with a strong color gradient. In figure 12, the contours show the distribution of all galaxies in our volume-limited sample. The solid, dotted and dashed lines show the medians of all galaxies, passive spirals, and active spirals. Since both passive and active spirals are less concentrated, their medians have somewhat higher values than all galaxies. If aperture bias is severe, should be much larger at a lower redshift since the difference between a 3” aperture and the Petrosian radius of galaxies is larger. However, in figure 12, of passive spirals is almost constant throughout the redshift range that we used (0.050.1). The figure suggests that the aperture effect is constant within the redshift range, and thus does not invite a strong redshift dependent bias. In figure 13, we present the fraction of passive spiral galaxies as a function of redshift. It clearly shows a strong aperture effect at . However, throughout this paper, we limit our sample between z=0.05 and 0.1, where fractions of passive spirals are constant within the error. This suggests that the aperture bias is not strong within our sample. Since the aperture effect results in missing the light from outer disc of spiral galaxies, another possibility is that if the distribution of spiral galaxies with a large bulge depend on the environment, we might have an environment dependent bias. However, we know that spiral galaxies with a large bulge are numerous in a dense environment such as cluster cores (Dressler et al. 1997; Fasano et al. 2000; Goto et al. 2003c). Nevertheless, we did not find passive spirals in cluster core regions (Figures 7, 8), suggesting that the passive spiral galaxies are not the product of an environmental dependence of large bulge spirals plus the aperture bias. We end this section by quoting that Hopkins et al. (2003) compared the star-formation rate estimated from H (SDSS data; subject to 3 arcsec aperture bias) and that from the radio flux (FIRST data; i.e., with no aperture bias), concluding that both star-formation rate estimates agree with each other after correcting the H flux using the ratio of the 3” fiber magnitude to the Petrosian (total) magnitude in band.
References
- [Abadi, Moore, & Bower(1999)] Abadi, M. G., Moore, B., & Bower, R. G. 1999, MNRAS, 308, 947
- [Abraham et al.(1996)] Abraham, R. G., et al. 1996, ApJ, 471, 694
- [Andreon, Davoust, & Heim(1997)] Andreon, S., Davoust, E., & Heim, T. 1997, A&A, 323, 337
- [Annis et al.(1999)] Annis, J. et al. 1999, Bulletin of the American Astronomical Society, 31, 1391
- [Balogh et al.(1997)] Balogh, M. L., Morris, S. L., Yee, H. K. C., Carlberg, R. G., & Ellingson, E. 1997, ApJ, 488, L75
- [Balogh et al.(1998)] Balogh, M. L., Schade, D., Morris, S. L., Yee, H. K. C., Carlberg, R. G., & Ellingson, E. 1998, ApJ, 504, L75
- [Balogh et al.(1999)] Balogh, M. L., Morris, S. L., Yee, H. K. C., Carlberg, R. G., & Ellingson, E. 1999, ApJ, 527, 54
- [Balogh et al.(2002)] Balogh, M. L., Couch, W. J., Smail, I., Bower, R. G., & Glazebrook, K. 2002, MNRAS, 335, 10
- [Bekki, Couch, & Shioya(2002)] Bekki, K., Couch, W. J., & Shioya, Y. 2002, ApJ, 577, 651
- [Bekki, Shioya, & Couch(2001)] Bekki, K., Shioya, Y., & Couch, W. J. 2001, ApJ, 547, L17
- [Bertin & Romeo(1988)] Bertin, G., & Romeo, A. B. 1988, A&A, 195, 105
- [1] Binney, J., & Tremaine, S. 1987, Galactic Dynamics (Princeton: Princeton Univ. Press)
- [Blanton et al.(2001)] Blanton, M. R., et al. 2001, AJ, 121, 2358
- [Blanton et al.(2003)] Blanton, M. R., et al. 2003b, AJ, 125, 2348
- [Blanton et al.(2003)] Blanton, M. R., Lin, H., Lupton, R. H., Maley, F. M., Young, N., Zehavi, I., & Loveday, J. 2003a, AJ, 125, 2276
- [Bothun & Sullivan(1980)] Bothun, G. D. & Sullivan, W. T.,III 1980, ApJ, 242, 903
- [Bravo-Alfaro, Cayatte, van Gorkom, & Balkowski(2001)] Bravo-Alfaro, H., Cayatte, V., van Gorkom, J. H., & Balkowski, C. 2001, A&A, 379, 347
- [Butcher & Oemler(1978)] Butcher, H., & Oemler, A. ,Jr., 1978, ApJ, 226, 559
- [Butcher & Oemler(1984)] Butcher, H., & Oemler, A. ,Jr., 1984, ApJ, 285, 426
- [Cayatte, Kotanyi, Balkowski, & van Gorkom(1994)] Cayatte, V., Kotanyi, C., Balkowski, C., & van Gorkom, J. H. 1994, AJ, 107, 1003
- [Couch & Sharples(1987)] Couch, W. J., & Sharples, R. M. 1987, MNRAS, 229, 423
- [Couch, Ellis, Sharples, & Smail(1994)] Couch, W. J., Ellis, R. S., Sharples, R. M., & Smail, I. 1994, ApJ, 430, 121
- [Couch et al.(1998)] Couch, W. J., Barger, A. J., Smail, I., Ellis, R. S., & Sharples, R. M. 1998, ApJ, 497, 188
- [Couch et al.(2001)] Couch, W. J., Balogh, M. L., Bower, R. G., Smail, I., Glazebrook, K., & Taylor, M. 2001, ApJ, 549, 820
- [Cowie & Songaila(1977)] Cowie, L. L., & Songaila, A. 1977, Nature, 266, 501
- [Diaferio et al.(2001)] Diaferio, A., Kauffmann, G., Balogh, M. L., White, S. D. M., Schade, D., & Ellingson, E. 2001, MNRAS, 323, 999
- [Dressler(1980)] Dressler, A. 1980, ApJ, 236, 351
- [Dressler et al.(1997)] Dressler, A., et al. 1997, ApJ, 490, 577
- [Dressler et al.(1999)] Dressler, A., Smail, I., Poggianti, B. M., Butcher, H., Couch, W. J., Ellis, R. S., & Oemler, A. ,Jr., 1999, ApJS, 122, 51
- [Eisenstein et al.(2001)] Eisenstein, D. J., et al. 2001, AJ, 122, 2267
- [Ellingson, Lin, Yee, & Carlberg(2001)] Ellingson, E., Lin, H., Yee, H. K. C., & Carlberg, R. G. 2001, ApJ, 547, 609
- [Elmegreen et al.(2002)] Elmegreen, D. M., Elmegreen, B. G., Frogel, J. A., Eskridge, P. B., Pogge, R. W., Gallagher, A., & Iams, J. 2002, AJ, 124, 777
- [Fabricant, Franx, & van Dokkum(2000)] Fabricant, D., Franx, M., & van Dokkum, P. 2000, ApJ, 539, 577
- [Farouki & Shapiro(1980)] Farouki, R., & Shapiro, S. L. 1980, ApJ, 241, 928
- [Fasano et al.(2000)] Fasano, G., Poggianti, B. M., Couch, W. J., Bettoni, D., Kjærgaard, P., & Moles, M. 2000, ApJ, 542, 673
- [2] Finoguenov, A., Briel, U. G., & Henry, J. P., 2003a, A&A, submitted
- [3] Finoguenov, A., Pietsch, W., Aschenbach, B., Miniati, F., 2003b, submitted to A&A
- [Fukugita et al.(1996)] Fukugita, M., Ichikawa, T., Gunn, J. E., Doi, M., Shimasaku, K., & Schneider, D. P. 1996, AJ, 111, 1748.
- [Fujita(1998)] Fujita, Y. 1998, ApJ, 509, 587
- [Fujita & Nagashima(1999)] Fujita, Y., & Nagashima, M. 1999, ApJ, 516, 619
- [4] Fujita, Y. et al. 2003, ApJ, submitted
- [Girardi et al.(1998)] Girardi, M., Giuricin, G., Mardirossian, F., Mezzetti, M., & Boschin, W. 1998, ApJ, 505, 74
- [Gómez et al.(2003)] Gómez, P. L., et al. 2003, ApJ, 584, 210
- [Goto et al.(2002)] Goto, T., et al. 2002a, AJ, 123, 1807
- [Goto et al.(2002)] Goto, T., et al. 2002b, PASJ, 54, 515
- [5] Goto, T., et al. 2003a, PASJ, 55, No.4 (#2341)
- [6] Goto, T., et al. 2003b, PASJ, 55, No.4 (#2421)
- [7] Goto, T., et al. 2003c, in preparation
- [8] Goto, T., et al. 2003d, PASJ, submitted (#2489)
- [Gunn & Gott(1972)] Gunn, J. E., & Gott, J. R. III. 1972, ApJ, 176, 1
- [9] Gunn, J. E., et al. 1998, AJ, 116, 3040
- [Hogg, Finkbeiner, Schlegel, & Gunn(2001)] Hogg, D. W., Finkbeiner, D. P., Schlegel, D. J., & Gunn, J. E. 2001, AJ, 122, 2129
- [10] Hopkins, A. et al. 2003, ApJ, submitted, stro-ph/0306621
- [Jarrett et al.(2000)] Jarrett, T. H., Chester, T., Cutri, R., Schneider, S., Skrutskie, M., & Huchra, J. P. 2000, AJ, 119, 2498
- [Kennicutt(1989)] Kennicutt, R. C., Jr. 1989, ApJ, 344, 685
- [Kent(1981)] Kent, S. M. 1981, ApJ, 245, 805
- [Kewley et al.(2001)] Kewley, L. J., Dopita, M. A., Sutherland, R. S., Heisler, C. A., & Trevena, J. 2001, ApJ, 556, 121
- [Kim et al.(2002)] Kim, R. S. J. et al. 2002, AJ, 123, 20
- [Kodama et al.(2001)] Kodama, T., Smail, I., Nakata, F., Okamura, S., & Bower, R. G. 2001, ApJ, 562, L9
- [Kodama & Bower(2001)] Kodama, T., & Bower, R. G. 2001, MNRAS, 321, 18
- [Kodama & Smail(2001)] Kodama, T., & Smail, I. 2001, MNRAS, 326, 637
- [Larson, Tinsley, & Caldwell(1980)] Larson, R. B., Tinsley, B. M., & Caldwell, C. N. 1980, ApJ, 237, 692
- [Lewis et al.(2002)] Lewis, I., et al. 2002, MNRAS, 334, 673
- [Lubin et al.(1998)] Lubin, L. M., Postman, M., Oke, J. B., Ratnatunga, K. U., Gunn, J. E., Hoessel, J. G., & Schneider, D. P. 1998, AJ, 116, 584
- [Lupton, Gunn, & Szalay(1999)] Lupton, R. H., Gunn, J. E., & Szalay, A. S. 1999, AJ, 118, 1406
- [Lupton et al.(2001)] Lupton, R. H., Gunn, J. E., Ivezić, Z., Knapp, G. R., Kent, S., & Yasuda, N. 2001, in ASP Conf. Ser. 238, Astronomical Data Analysis Software and Systems X, ed. F. R. Harnden, Jr., F. A. Primini, and H. E. Payne (San Francisco: Astronomical Society of the Pacific), 269
- [Makino & Hut(1997)] Makino, J., & Hut, P. 1997, ApJ, 481, 83
- [Mamon(1992)] Mamon, G. A. 1992, ApJ, 401, L3
- [Mannucci et al.(2001)] Mannucci, F., Basile, F., Poggianti, B. M., Cimatti, A., Daddi, E., Pozzetti, L., & Vanzi, L. 2001, MNRAS, 326, 745
- [Margoniner & de Carvalho(2000)] Margoniner, V. E., & de Carvalho, R. R. 2000, AJ, 119, 1562
- [Margoniner, de Carvalho, Gal, & Djorgovski(2001)] Margoniner, V. E., de Carvalho, R. R., Gal, R. R., & Djorgovski, S. G. 2001, ApJ, 548, L143
- [Martin, Lotz, & Ferguson(2000)] Martin, C. L., Lotz, J., & Ferguson, H. C. 2000, ApJ, 543, 97
- [Mo & Mao(2002)] Mo, H. J., & Mao, S. 2002, MNRAS, 333, 768
- [Nakamura et al.(2003)] Nakamura, O., Fukugita, M., Yasuda, N., Loveday, J., Brinkmann, J., Schneider, D. P., Shimasaku, K., & SubbaRao, M. 2003, AJ, 125, 1682
- [11] Oh, S. P.,& Benson, A. J. 2003, MNRAS, submitted
- [Ostriker(1980)] Ostriker, J. P. 1980, Comments on Astrophysics, 8, 177
- [Phillipps(1988)] Phillipps, S. 1988, A&A, 194, 77
- [Pier et al.(2003)] Pier, J. R., Munn, J. A., Hindsley, R. B., Hennessy, G. S., Kent, S. M., Lupton, R. H., & Ivezić, Ž. 2003, AJ, 125, 1559
- [Pimbblet et al.(2002)] Pimbblet, K. A., Smail, I., Kodama, T., Couch, W. J., Edge, A. C., Zabludoff, A. I., & O’Hely, E. 2002, MNRAS, 331, 333
- [Poggianti et al.(1999)] Poggianti, B. M., Smail, I., Dressler, A., Couch, W. J., Barger, A. J., Butcher, H., Ellis, R. S., & Oemler, A. ,Jr., 1999, ApJ, 518, 576
- [Postman & Geller(1984)] Postman, M., & Geller, M. J. 1984, ApJ, 281, 95
- [Quilis, Moore, & Bower(2000)] Quilis, V., Moore, B., & Bower, R. 2000, Science, 288, 1617
- [Rakos & Schombert(1995)] Rakos, K. D., & Schombert, J. M. 1995, ApJ, 439, 47
- [Richards et al.(2002)] Richards, G. T., et al. 2002, AJ, 123, 2945
- [Schlegel, Finkbeiner, & Davis(1998)] Schlegel, D. J., Finkbeiner, D. P., & Davis, M. 1998, ApJ, 500, 525
- [Shimasaku et al.(2001)] Shimasaku, K., et al. 2001, AJ, 122, 1238
- [Smail, Edge, Ellis, & Blandford(1998)] Smail, I., Edge, A. C., Ellis, R. S., & Blandford, R. D. 1998, MNRAS, 293, 124
- [Smail et al.(1999)] Smail, I., Morrison, G., Gray, M. E., Owen, F. N., Ivison, R. J., Kneib, J.-P., & Ellis, R. S. 1999, ApJ, 525, 609
- [Smith et al.(2002)] Smith, J. A., et al. 2002, AJ, 123, 2121
- [Spitzer & Baade(1951)] Spitzer, L. Jr., & Baade, W. 1951, ApJ, 113, 413
- [Stoughton et al.(2002)] Stoughton, C., et al. 2002, AJ, 123, 485
- [Strateva et al.(2001)] Strateva, I., et al. 2001, AJ, 122, 1861
- [12] Strauss, M. A., et al. 2002, AJ, 124, 1810
- [Terlevich, Caldwell, & Bower(2001)] Terlevich, A. I., Caldwell, N., & Bower, R. G. 2001, MNRAS, 326, 1547
- [van den Bergh(1976)] van den Bergh, S. 1976, ApJ, 206, 883
- [van Dokkum et al.(1998)] van Dokkum, P. G., Franx, M., Kelson, D. D., Illingworth, G. D., Fisher, D., & Fabricant, D. 1998, ApJ, 500, 714
- [van Dokkum et al.(2000)] van Dokkum, P. G., Franx, M., Fabricant, D., Illingworth, G. D., & Kelson, D. D. 2000, ApJ, 541, 95
- [Wilkerson(1980)] Wilkerson, M. S. 1980, ApJ, 240, L115
- [Yagi et al.(2002)] Yagi, M., Kashikawa, N., Sekiguchi, M., Doi, M., Yasuda, N., Shimasaku, K., & Okamura, S. 2002, AJ, 123, 87
- [York et al.(2000)] York, D. G., et al. 2000, AJ, 120, 1579
- [Zabludoff et al.(1996)] Zabludoff, A. I., Zaritsky, D., Lin, H., Tucker, D., Hashimoto, Y., Shectman, S. A., Oemler, A. ,Jr., & Kirshner, R. P. 1996, ApJ, 466, 104
- [Zaritsky, Zabludoff, & Willick(1995)] Zaritsky, D., Zabludoff, A. I., & Willick, J. A. 1995, AJ, 110, 1602


| Blue continuum | Line | Red continuum | |
|---|---|---|---|
| 3653–3713 Å | 3713–3741 Å | 3741–3801 Å | |
| H | 6490–6537 Å | 6555–6575 Å | 6594–6640 Å |
| H | 4030–4082 Å | 4088–4116(4082-4122) Å | 4122–4170 Å |