Numerical simulations of interacting gas-rich barred galaxies. Vertical impact of small companions.
Abstract
We investigate the dynamical effects of an interaction between an initially barred galaxy and a small spherical companion using an -body/SPH algorithm. In the models described here the small companion passes through the disc of the larger galaxy near-perpendicular to its plane. The impact positions and times are varied with respect to the phase of the bar and the dynamical evolution of the disc.
The interactions produce expanding ring structures, offset bars, spokes, and other asymmetries in the stars and gas. These characteristic signatures of the interaction are present in the disc for about 1 Gyr. We find that in some cases it is possible to destroy the bar while keeping the disc structure. In general the central impacts cause larger damage to the bar and the disc than the peripheral ones. The interaction tends to accelerate the transition from a strongly barred galaxy to a weakly or non-barred galaxy. The final disc morphology is determined more by the impact position relative to the bar rather than the impact time.
keywords:
galaxies: evolution – galaxies: interactions – galaxies: structure – galaxies: kinematics and dynamics.1 Introduction
The evolution of disc galaxies is driven through both internal and external processes. Internal instabilities in the disc often give rise to the formation of a bar, which as many as half of all disc galaxies are now known to harbour. In the last few years near-infrared (NIR) observations (Pompea & Rieke 1990; Rix 1993; Rix & Rieke 1993; Seigar & James 1998; Eskridge et al. 2000) have confirmed that bars are a very common feature in disc galaxies and by no means an exception. The presence of a bar changes both the kinematics and mass (stellar and gas) distributions within the disc and can give raise to dynamical resonances (e.g., Sellwood & Wilkinson 1993). Likewise, an only recently recognised important external agent is the interaction with small companions. A statistical survey by Zaritsky et al. (1993, 1997) gave a lower limit to the average number of companions for field spiral galaxies of . Since these two processes are thought to be so common, it is a reasonable assumption that the interaction between a barred disc galaxy and a small companion would be a common event.
Although only a small fraction of the mass of a galaxy, gas can significantly influence the evolution of disc galaxies (e.g., Shlosman & Noguchi 1993). Due to the torques of a stellar bar, the dissipative gas can be driven towards the galactic centre and channelled toward the inner kpc (Shlosman, Begelman & Frank 1990; Athanassoula 1992b) driving active galactic nuclei (AGN) or nuclear starbursts [Heller & Shlosman 1994] and creating nuclear and circumnuclear discs and rings. Recent NIR-Observations [Pèrez-Ramírez et al. 2000] have shown a relation between the circumnuclear star formation in barred galaxies and the circumnuclear spiral or ring structure present in these galaxies. The shape of dust lanes inside the bar, coinciding with the location of shocks in the gasflow, reveals information about the internal dynamics of the bar and disc [Athanassoula 1992b]. Many numerical simulations including a dissipative disc component have emphasised the importance of the gas in isolated barred galaxies (e.g., Shlosman & Noguchi 1993; Friedli & Benz 1993; Heller & Shlosman 1994; Berentzen et al. 1998) and interacting galaxies as well (e.g., Noguchi 1987; Hernquist & Weil 1993; Barnes & Hernquist 1996).
Since the pioneering work of Toomre & Toomre [Toomre & Toomre 1972] much effort has been spent to investigate galaxy-galaxy interactions (e.g., see the review by Barnes & Hernquist 1992, and references therein). Noguchi [Noguchi 1988] started with numerical simulations to study the formation of bars in tidal interactions and the response of the gas to a tidal bar. Gerin, Combes & Athanassoula [Gerin et al. 1990] have performed both 2-D and 3-D -body simulations to study the response of an initial bar formed in a globally unstable disc [Ostriker & Peebles 1973] to a tidal encounter with a spherical perturber. They studied the effect of a close encounter, both in and out of plane, with trajectories with pericenters outside the disc. This work has been continued by Sundin & Sundelius [Sundin & Sundelius 1991] and Sundin, Donner & Sundelius [Sundin et al. 1993], who, using 2D -body simulations, studied the response of a bar, which had been induced by a satellite on a planar parabolic orbit. In these works, the change in pattern speed, angular momentum distribution and resonances in the disc were investigated for different orbits and masses of the perturber. Further work, concentrating on the formation of collisionally induced rings, has been performed by Athanassoula, Puerari & Bosma (1997, hereafter APB97). These purely collisionless simulations have shown that off-centred impacts of a sufficiently massive companion hitting the inner parts of a barred disc galaxy can displace the bar to one side, causing asymmetries and the formation of rings. We should note that off-centred bars may also form spontaneously in galaxies.
In this paper we focus upon the evolution of a gas-rich barred disc galaxy which is perturbed by the impact of a less massive spherical companion galaxy. An -body/SPH algorithm is used to evolve the stellar and gas components of the two systems. In the models described here the small companion passes through the disc of the larger galaxy near-perpendicular to its plane. The impact position and time are varied with respect to the bar and to the evolutionary phase of the isolated barred galaxy. The mass of the companion galaxy has been chosen such that the interaction can be considered as a perturbation to the bar and disc. The set of encounter parameters has been deduced from the previous simulations by APB97 and chosen as to produce the strongest effects, like asymmetries, off-centred bars and rings. We describe how the evolution of the bar strength, pattern speed, and gas inflow rate are affected by the interaction.
2 Methods
The method consists of an -body algorithm to evolve the collisionless component, representing the stars and dark matter, combined with a smoothed particle hydrodynamics (SPH) algorithm to evolve the dissipative component, representing the gas (e.g., review by Monaghan 1992). For the simulations presented in this paper we use the hybrid -body/SPH code which is described in detail by Heller [Heller 1991] and Heller & Shlosman [Heller & Shlosman 1994]. The algorithm employs such features as a spatially varying smoothing length, a hierarchy of time bins to approximate individual particle timesteps, a viscosity “switch” to reduce the effects of viscous shear, and the special purpose GRAPE-3AF hardware to compute the gravitational forces and neighbour interaction lists (Sugimoto et al. 1990; Steinmetz 1996). Besides speed in the direct force summation, the GRAPE hardware has the additional advantage that it does not impose any constraints on the spatial distribution of the particles.
The model of the disc galaxy (or host galaxy) is composed of a stellar and gaseous disc, embedded in a hot spherical dark matter halo. An isothermal equation of state is used for the gas component. The spherical companion galaxy (or perturber) consists of stars only.
2.1 Initial conditions
2.1.1 Host galaxy and companion
The model parameters for the host and the companion galaxy are selected similar to those used by APB97, so as to allow a meaningful comparison between the collisionless and dissipative models. The host galaxy is a barred model referred to as mb in APB97. Our model here, however, differs from mb in that about 23% of the mass of the stellar disc has been replaced by a gaseous disc. The radial scale-length and total mass of the disc have been retained in the model.
Both the stellar and the gaseous disc are initially setup with a Kuzmin-Toomre (hereafter KT) projected radial surface density profile (Kuzmin 1956; Toomre 1963)
| (1) |
In the above , and are the cylindrical radius, the total mass and the radial scale-length, respectively. The resulting truncated mass profile for the disc is then set up with the disc mass , where and are the masses of the stellar and the gaseous disc, respectively, which have been truncated at a radius The vertical disc profile follows the distribution of an isothermal sheet [Spitzer 1942], where is the vertical scale-height with and for the stellar and gaseous disc, respectively.
Both the halo and the companion have a generic Plummer (hereafter Pl) density profile [Plummer 1911]
| (2) |
where is the spherical radius. and denote the total mass and radial scale-length for each individual component. The truncated mass profile for the halo and the companion are set up with a cut-off mass and radial scale-length with and , respectively, with the cut-off radius .
The initially spherical halo, not being in virial equilibrium with the embedded disc, is allowed to relax in the potential of the dynamically frozen disc, whose mass is slowly turned-on over time following the spline function
| (3) |
where the turn-on time in our units has been chosen as . The halo is relaxed for a total time period of . From the resulting potential we then assign velocities to the disc particles, with the radial dispersion based on Toomre’s stability criterion [Toomre 1964] and correcting for asymmetric drift.

| Type | MD | a | RD | zs/g | ||
| Disc | ||||||
| – stars | KT | 13 500 | 0.54 | 1.0 | 5.0 | 0.20 |
| – gas | KT | 10 000 | 0.16 | 1.0 | 5.0 | 0.05 |
| Type | MH | bH | rH | |||
| Halo | ||||||
| – stars | Pl | 32 500 | 1.30 | 5.0 | 10.0 | |
| Type | MC | bC | rC | |||
| Comp. | ||||||
| – stars | Pl | 10 000 | 0.40 | 0.195 | 3.0 |
The spherical companion galaxy is similar to the model referred to as csd in APB97. The mass of the companion has been chosen such that the mass ratios of companion to the host disc and to total host mass are, respectively, and . Based on the results of APB97, we expect to obtain with these mass ratios the formation of spokes and rings following the interaction. The initial model parameters are summarised in Table 1. The initial velocity distribution of the disc is shown in Fig. 1. The tangential velocity curve has its turn-over radius at roughly 2a and stays flat in the outer disc.
2.1.2 Units
The adopted units for mass, distance, and time are M⊙, kpc and yr, respectively, for which the gravitational constant G is unity. The dynamical time is yr, where is the total mass within a sphere of radius equal to the half mass radius , which is, after relaxation of the halo, approximately 8.5 kpc or in terms of the disc scale-length, . The initial stellar disc rotation period in these units then corresponds to . A fixed gravitational softening length of kpc is used for all particles. An isothermal equation of state is used for the gas with a sound speed of km s-1. The corresponding thermal temperature of the gas is 104 K.
2.1.3 Interaction parameters
Before adding the companion to the model we evolve the isolated barred host galaxy for , or yr. The initial centre of mass positions and velocities of the host and companion have then been obtained by integrating their orbits backward in time, starting from the impact time at which the centre of mass of the companion lies in the disc plane. During this integration the disc (with bar) and halo particles are frozen with respect to each other, but allowed to rotate as a single system with the (negative) angular frequency or pattern speed of the bar, as determined from the isolated disc model (hereafter I0). The companion is represented by a point mass for this integration. This approximation is sufficient since the encounter is fast enough that dynamical friction does not significantly modify the orbit.
| Model | Name | Bar | ||
|---|---|---|---|---|
| Isolated model | I0 | |||
| Central impact | C1 | strong | ||
| C2 | weak | |||
| Major axis impact | A1 | strong | ||
| A2 | weak | |||
| Minor axis impact | B1 | strong | ||
| B2 | weak |
The impact velocity of the companion has been chosen to be of the order of , with being the escape velocity from the centre of the host system. The hyperbolic orbit is then integrated backward for a time period of , which places the companion well outside the halo of the disc system. The simulations presented in this paper will be confined to almost perpendicular passages. Impacts along trajectories 30 degrees (and sometimes higher) from the disc normal still yield ring shaped features [Lynds & Toomre 1976]. The effects of oblique impacts have been studied by Toomre [Toomre 1978], Athanassoula [Athanassoula 1999] and APB97. An overview of the isolated and interaction models is given in Table 2. The columns, from left to right, give the type and the name of the model, the bar impact time , the strength of the bar at and the end time of each simulation.
3 Results
3.1 Model I0 : Isolated barred galaxy
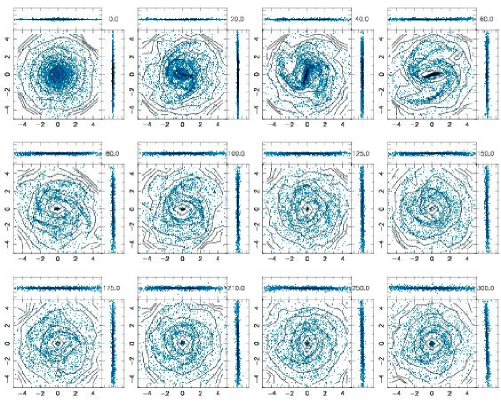
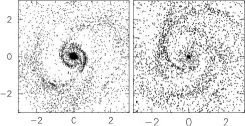
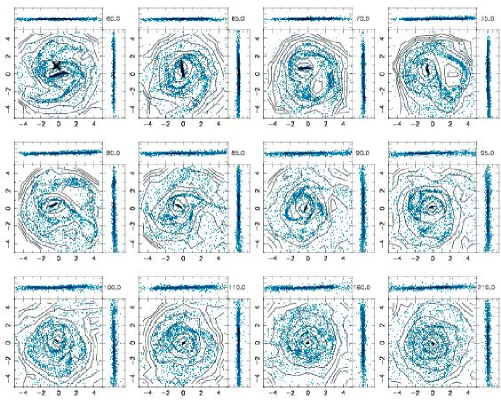
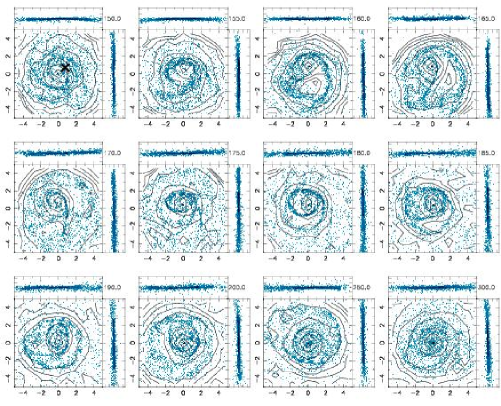
The morphological evolution of the stellar and gaseous disc is shown in Fig. 2. The model of the disc galaxy was constructed so as to be globally unstable to non-axisymmetric perturbations and form a large-scale bar in a few disc rotations. At , or after some , the stellar bar reaches its maximum strength, defined by the normalised amplitude of the Fourier component of the stellar disc particle distribution inside a cylindrical radius of 3.75 kpc and one scale-height of the disc plane. Care was taken in all models not to include any power from spiral features. The result is shown in Fig. 3a. At the time of its maximum strength the bar has a major axis length of kpc and an axial ratio of approximately , as determined by simple measurements of the stellar isodensity contours. Both stellar and gaseous trailing spiral arms emerge from the end of the bar. While the stellar arms slowly dissolve and are hardly visible by , large spiral features in the gas persist throughout the run. The spiral pattern in the gas evolves from a two-arm to a flocculent-type spiral after the stellar arms have dissolved. The gas also forms straight off-set shocks at the leading edge of the stellar bar. The shape and position of the shock loci indicate that the Lagrangian radius is small and that the resonant orbit family is either absent or negligible at this early stage of evolution [Athanassoula 1992b].

As soon as the bar forms, a substantial gas inflow sets in due to its gravitational torque, and within some , or approximately two bar rotations, some 50% of the total gas, or M⊙, is driven towards the centre (Fig. 3 c) and accumulates there in a dense oval nuclear disc. This disc is elongated along the bar major axis and has a mean radius of approximately kpc. Although the nuclear disc appears to be aligned with the bar major axis, its shape and orientation could well be affected by the numerical softening, since its radius is a little less than half the softening length . The mass of the nuclear disc represents some 18% of the total dynamical mass within a radius of 1.0 kpc. As a result of the growing mass concentration at the centre, the amplitude of the stellar bar decreases rapidly (Heller & Shlosman 1994). At the initial burst of inflow slows down and the stellar bar becomes quasi-stable (see Fig. 3 a), decaying at a much slower rate of , as estimated by a linear least-squares fit. Likewise, owing to the inflow of gas to the centre, the pattern speed of the bar, as given by the phase angle of the Fourier component, increases linearly (Heller & Shlosman 1994) till (Fig. 3 b). After the central inflow of gas stops, i.e. at around , the bar is rotating uniformly with a constant rate of , or 29 km s-1 kpc-1, throughout the rest of the simulation.
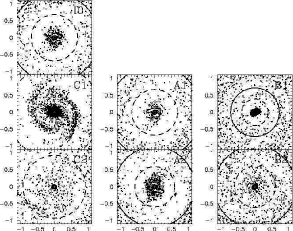
The gaseous nuclear disc (hereafter n-disc) which has formed by the burst of gas inflow at first remains connected with the outer disc by two trailing spiral segments, which by way of their shocks feed material inward and thus contribute to its growth. Initially the nuclear disc is oval in shape, but as the bar weakens it becomes more circular. After the nuclear disc does not grow in mass anymore and the still inflowing gas starts to accumulate in a circumnuclear disc (hereafter cn-disc) surrounding the nuclear disc. This elongated cn-disc is orientated perpendicular to the bar major axis and has a lower surface density than the nuclear disc. In addition the cn-disc is more extended in size than the n-disc and has a radius of kpc at the end of the simulation. The final morphology of the nuclear region is shown in Fig. 4.
The orientation of both the nuclear and the circumnuclear disc relative to the stellar bar indicate that the gas populates the main families of periodic orbits in the barred potential (e.g., Contopoulos & Papayannopoulos 1980; Athanassoula et al. 1983). The orbits, which support the bar, are elongated along the bar major axis, while the orbits between the inner and outer Inner Lindblad Resonances (hereafter: iILR and oILR, respectively) are orientated perpendicular to the bar [Contopoulos & Mertzanides 1977].
In order to identify the presence and location of the main planar resonances in the disc at different times we average the mass distribution azimuthally and derive the curve, where and denote the circular and the epicyclic frequency, respectively. At the end of the run () this curve shows a pronounced maximum at a radius of kpc exceeding the pattern speed of the bar, indicating the presence of ILRs. The resonant radii, obtained with this approximation, are given in Table 3.
| time | model | i ILR | o ILR | UHR | CR | OLR | |
|---|---|---|---|---|---|---|---|
| 60 | I0 | 0.28 | 0.11 | 0.23 | 1.40 | 2.16 | 3.85 |
| 150 | I0 | 0.30 | 0.03 | 0.64 | 1.25 | 1.99 | 3.48 |
| 210 | I0 | 0.30 | 0.03 | 0.64 | 1.27 | 2.01 | 3.52 |
| C1 | 0.11 | 0.02 | 1.37 | 2.26 | 3.52 | 4.78 | |
| A1 | 0.28 | 0.04 | 0.67 | 1.38 | 2.12 | 3.71 | |
| B1 | 0.53 | 0.09 | 0.39 | 0.72 | 1.09 | 1.90 | |
| 300 | I0 | 0.29 | 0.03 | 0.68 | 1.31 | 2.08 | 3.68 |
| C2 | 0.16 | 0.01 | 0.93 | 2.22 | 3.63 | 4.93 | |
| A2 | 0.28 | 0.02 | 0.59 | 1.18 | 1.93 | 3.47 | |
| B2 | 0.33 | 0.02 | 0.61 | 1.20 | 1.85 | 3.14 |

At its maximum strength, however, the stellar bar provides a strong non-linear perturbation to the gravitational potential of the disc and applying linear theory to identify the dynamical resonances is not sufficient. A more reliable way is to search for the existence of the main orbit families [Athanassoula 1992a]. For this we constructed surfaces of sections (SOS) by integrating orbits of a given Jacobian energy EJ in the equatorial plane, marking the points in the plane each time the orbits cross the line with (e.g., Binney & Tremaine 1987). The gravitational potential of each snapshot has been calculated on a non-equally spaced Cartesian grid with a size of 6 by 6 kpc. From that the potential and its derivatives are evaluated by using a piecewise polynomial function represented by a tensor product of one-dimensional B-splines. The times chosen for the SOS, i.e. at impact time and at the end of each run, are given in Table 2. We were thus able to confirm the presence of the ILRs in all of the cases, except for models IO () and C1 ().
Most of the gas initially residing within corotation is driven towards the centre, resulting in a noticeable deficiency of gas outside the cn-disc, which could be interpreted as representing an HI hole. In contrast to this hole an oval ring of gas accumulates near the end of the weak stellar bar, close to the position of the ultra-harmonic resonance (UHR) at kpc. After the resonance ring has formed () little further net radial redistribution of the gas (less than 1%) occurs.
The stellar disc thickens vertically. We follow the time evolution of its radially averaged vertical scale-height by fitting a sech density distribution to the particle distribution. The result is shown in Figure 5. We find a linear increase of the vertical scale-height by a total of roughly 25% in the isolated model. We also notice a thickening of the gaseous disc, especially some slight flaring in the outer parts. Some of the thickening, however, might be induced numerically, either due to the limited number of particles in the model or to the relatively large softening. Since we use the same model later for the host galaxy, it will show the same numerical heating and any further change in scale-height may be attributed to the interaction.
In this isolated model there is no perceptible sign of a peanut-shaped bar due to a buckling instability. This could be due to the fact that, even if the stellar disc were susceptible to such an instability, the presence of the gas would greatly dampen it [Berentzen et al. 1998].
3.2 Interacting models
The two times chosen for the impact of the companion correspond to the time (1) when the bar is at its maximum strength () and (2) when the bar is weak and has settled down to a quasi-stable state (). Both times represent a characteristic epoch in the evolution of the disc. In the first case the bar has already formed and dynamically dominates the disc, but has still not had time to modify significantly the radial mass distribution of stars and gas. In the second case the stellar bar has weakened and the dynamical influence of the bar can be neglected compared to the effects of the interaction alone. The impact position, i.e. the position of the centre of mass of the companion in the equatorial plane of the disc at , also has been varied with respect to the bar. In the models with major axis impacts, the impact position has a distance from the centre of kpc, which corresponds roughly to the corotation radius in the isolated model. For the minor axis impacts, the distance is kpc.
3.3 Central passage : Models C1 and C2
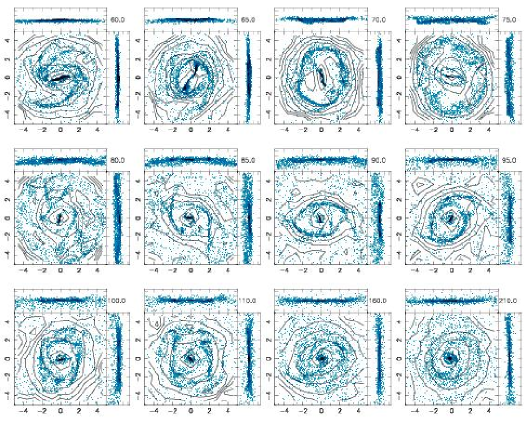
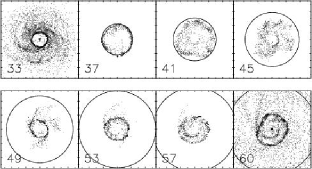
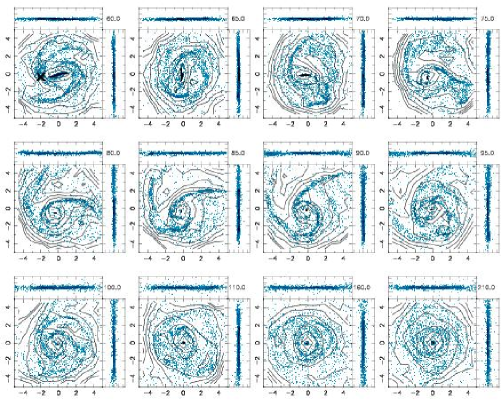
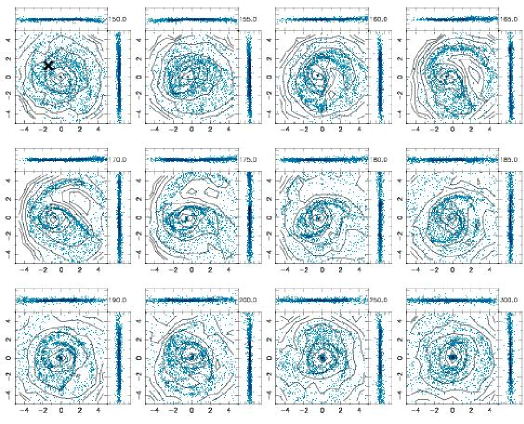
In the simulations described in this section the companion hits the disc of the host galaxy at its centre. The morphological evolution of the models C1 () and C2 () is shown in Figures 6 and 7, respectively. Prior to impact both models show an axisymmetric vertical bending in both the stellar and the gaseous disc, with the inner regions pulled out in the direction of the approaching companion, as illustrated for the gaseous disc in the figures at and for models C1 and C2, respectively.
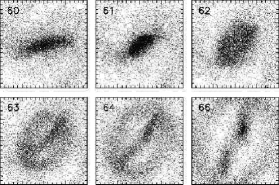
The impact of the companion produces some expanding rings in the stars and gas, of which the latter are more sharply pronounced. The axial symmetry of the disc in model C1 is broken by the strong stellar bar and therefore the induced rings do not maintain their circular shape at larger radii (Fig. 6, after ). Between the first and the second ring form several spokes, which are more pronounced in the gas, while their stellar counterparts are hardly visible by eye. All these induced features persist for only a few dynamical times after which the disc settles down once again to a quasi-steady state. Although the stellar bar gets destroyed in both simulations, its dynamical imprint remains in the gas: namely the nuclear and circumnuclear discs, and the inner pseudo-ring. These components become visible again shortly following the impact and survive in the disc till the end of the runs (see Fig. 8).
3.3.1 Evolution of the bar
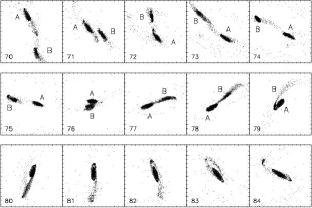
In the early impact model C1 both the stellar bar and the gas, which had accumulated prior to the impact in the shock loci inside the bar, get torn apart by the impact into two separate fragments. Fig. 9 shows this evolution for the stellar bar. When the companion passes through the disc, it exerts an extra inwards gravitational force on the disc particles and causes their orbits to contract. This affects the main orbit families of the bar and therefore the bar temporarily shortens somewhat (Fig. 9, ). After the companion has left the disc there is a strong rebound of the orbits, resulting in a radially expanding density wave. With the expansion of the particle orbits, the bar gets torn apart and the extremities of the two stellar fragments remain temporarily connected with the expanding stellar ring. At all times the two bar fragments are enclosed by the expanding ring. When the ring reaches a radius of approximately kpc, the two bar fragments detach from it and sink back towards the centre, where they finally merge some , or 0.1 Gyr, after the impact and form a dense, almost axisymmetric centre. Likewise, the gas concentrations at the shock loci inside the bar get torn apart, following the movement of the stellar bar fragments. As shown in Fig. 10 the two separated gas fragments flow back and forth inside the bar potential being trapped around -like orbits. During this period they appear as two separate nuclei, before they finally merge and form a single nuclear disc some 0.2 Gyr after the impact.
In the later impact model C2 the stellar bar already has been weakened significantly due to the gas inflow. In this case also the impact produces expanding rings in the disc, but no stellar or gaseous fragments as in model C1.
In both models the stellar bar gets destroyed by the interaction almost immediately after the impact. The bar strength as a function of time is shown in Fig. 19 (full line). In model C2 the already weak bar gets destroyed when the first stellar ring detaches from the central region. The temporary increase of the amplitude after the impact in model C1 results from the two stellar fragments which contribute to a bisymmetric distribution, but does not represent a stronger bar. No further stellar signatures of the former bar are left in the disc at the end of the runs.
3.3.2 Rings and spokes
The passage of the companion through the disc excites both radial and vertical oscillations in the disc. The induced radial oscillatory motion of the particles produces expanding density ring-waves (e.g., Lynds & Toomre 1976) centred on the impact position, while the vertical oscillations lead to an increase of the vertical velocity dispersion and a significant thickening of the disc.
As shown in Fig. 6 and 7, an expanding ring is produced by the impact in both the stars and the gas. The ring first becomes visible in the gas, since the stellar ring is much broader and only becomes visible at sufficiently large radii. As the ring expands outward it becomes broader and its amplitude in both stars and gas decreases slowly as predicted by the impulse approximation (e.g., Binney & Tremaine 1987). The ring in model C1 becomes asymmetric (Fig 6, ), since the underlying disc potential is perturbed by the presence of the stellar bar at least in the early phases of ring formation. In model C2, however, the induced ring is more symmetric, since the perturbation due to the bar is weaker. In both models, the first ring reaches about 9 kpc at which point the inner part of the gaseous ring starts to fragment, with most of its mass flowing back towards the inner few kpc.
Following the first, a second expanding ring forms in both models, and becomes first visible in the gas after some , or Gyr after the impact (see Fig. 11). The second ring expands out to a radius of kpc where it dissolves and its material is redistributed in the central region. In the stellar disc the second ring is hardly visible, since its amplitude is too low and it does not expand as far out as the first one. While only two rings form in the stars – a third one can (hardly) be identified only in the radial density profile of the disc – we find several consecutive expanding ring features in the gas which are more asymmetric than the first two rings (e.g., Fig. 7 and Fig. 14 ).
The gas fragments that detach from the inner side of the first ring flow back to the central disc region and are sheared out by the differential rotation of the disc, forming several spokes between the two collisional rings (Fig. 11). As noted by APB97, spokes form only between the first and the second ring, the presence of the latter being necessary. The properties of spokes in collisional ring galaxies are discussed in detail by Hernquist & Weil [Hernquist & Weil 1993].


To track the position of the rings and derive their expansion velocity, we determine the azimuthally averaged density of annuli of varying radii in the disc. Then we fit a polynomial function to subtract the background of the disc and a Gaussian to fit the density distribution inside the ring. Using this method we get information about the position, width and mass of the rings. The results are shown in Figure 12. We find that the gaseous ring traces the position of the stellar ring, i.e. its position coincides with that of the stellar ring (Fig. 12a) and both expand with the same velocity. With increasing radius the stellar and gaseous rings become broader (Fig. 12b) and less dense, as predicted by the impulse approximation (e.g., Binney & Tremaine 1987).
By integrating the Gaussian with the fitted parameters we can estimate the gas mass contributing to the rings. Fig. 12c shows the mass of the gaseous rings as a function of time. Unlike stars, the orbits of the gas cannot cross and up to gas is piled up in the ring as it expands outward. Due to shock dissipation and self-gravity of the ring, its inner parts start to fragment and thus its mass decreases. We fit a logarithmic function to the radii of the gaseous rings from which we derive their expansion velocity. Fig. 13 shows the position and expansion velocity of the first and second ring in model C2. As has been previously found (e.g. APB97) the expansion velocity of the rings decreases with radius, as predicted by the impulse approximation. The expansion velocity of the first ring drops gradually from 88 km s-1 (7.5 ) to 35 km s-1 (3 , where is the sound speed in the gas). The second ring starts with a lower velocity, which decreases from 29 km s-1 (2.5 ) to 11.72 km s-1 (1 ).

In Fig. 15 a and b we show the isocontours of the radial velocities for the stellar and gaseous disc, respectively, as a function of both radius and time. It shows the radial osciallation of the disc material, first inward following the impact, followed by an outward movement as the ring passes through, and finally again inward. The amplitude of this motion can be seen to be considerable. With each passage of a ring the local radial velocity dispersion (not shown here) in the disc increases, until further density enhancements of this kind are no longer supported.
The passage of the companion also gives rise to vertical oscillations in the disc (e.g., Weinberg 1991; Mihos & Hernquist 1994) giving it a layered appearance in the edge-on projection (see Fig. 6, e.g., and Fig 7, e.g., ). The same type of vertical motion can be seen in the numerical models by Lynds & Toomre [Lynds & Toomre 1976] and also in Mihos & Hernquist [Mihos & Hernquist 1994]. In fact the layered appearance is a projection effect resulting from the different vertical position of the outer, still unperturbed, gas disc and the expanding ring. As a consequence of the vertical bending in the disc, induced by the companion prior to impact, the first expanding ring starts forming above the equatorial plane (Fig. 7, ). At larger radii, i.e. at later times, the ring crosses the plane of the disc (defined by the centre of mass of the gaseous disc) driven by the passage of the companion. With each passage of a ring through the equatorial disc plane the vertical velocity disperion increases and results in a significant thickening of the disc. The vertical scale-height of the stellar disc is shown in Fig. 5. We find an abrupt increase of from a value of roughly 0.6 kpc to 1 kpc at after the impact.
To analyse the radial and vertical oscillations in the disc in more detail, we trace the orbits of individual particles in and as a function of time. With a Fourier transformation we find that the principal frequencies correspond to the radial and vertical epicyclic frequencies in the disc. The increase of kinetic energy in is therefore responsible for the heating or thickening of the disc after the impact.
3.3.3 Nuclear and circumnuclear disc
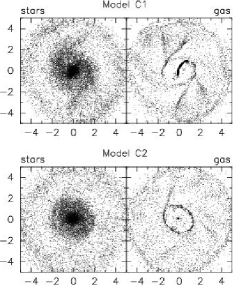
In model C1 (strong bar) the two gas nuclei, which have formed after the interaction in the disrupted bar, merge and form a single nuclear disc. This nuclear disc, however, is less massive and more extended than the one in the isolated model. After the n-disc has formed, it remains connected by two gaseous trailing spiral segments with the second induced ring ( in Fig. 6). The gas which is driven towards the centre continuously by way of the spiral shocks accumulates in a circumnuclear disc. Compared to the isolated model, we find about 5% more gas in the cn-disc inside kpc. We also find some two-armed trailing spiral structure of varying strength in the cn-disc. At the end of the run of model C1, smoothly distributed gas remains in the outer disc, as well as in a dense nuclear disc/core (like in the isolated model) surrounded by a circumnuclear disc with a radius of kpc (Fig. 4). This disc is orientated almost perpendicular to the nuclear disc and is connected by two trailing spiral arms with an outer distorted ring which has formed at a radius of kpc, close to the UHR of the former bar (see Fig. 8).
In model C2 the gaseous nuclear disc has already formed before the impact. With the companion passing through the disc, the inner disc region is pulled out of the disc plane towards the direction of the companion. The gaseous nuclear disc reaches a maximum vertical distance relative to the (first) expanding ring of approximately kpc at , or yr, after the impact. After the collisional rings have dissolved and the n-disc has recentered vertically, more gas is driven towards the centre by way of the spiral shocks which have newly formed in the surrounding disc. The radius of the nuclear disc is larger than in the isolated model at the same time, but has about the same mass. The inflowing gas accumulates in a circumnuclear disc, which has a mean radius of kpc at the end of the simulation and is connected by two spiral arms with the outer ring, which has formed close to the UHR. The region between the cn-disc and the ring at the UHR (at roughly kpc) shows a clear deficiency of gas, which also exists in model C1.
After the bar has been destroyed, the gaseous nuclear discs in both models maintain their slightly elongated shape and still rotate with the same pattern speed as the former stellar bar before the impact. In both models we find spiral shocks in the circumnuclear disc (Fig. 4), which persist till the end of the simulation.
3.4 Major axis passages : Models A1 and A2
In these simulations the companion hits the disc on the bar major axis at a radius of approximately 6.0 kpc, i.e. in model A1 close to the end of the strong bar and close to the corotation radius as determined from the isolated model. The morphological evolution of these models is shown in Fig. 16 and 17 for the early (A1) and late (A2) impact, respectively.
When the companion approaches the disc it exerts an extra gravitational force on the disc particles and the bar gets shifted towards the impact position, almost merging with the spiral arm close to the impact position (Fig. 16, ). While the central impacts produce a closed expanding ring structure, the off-centered passages produce long spiral arms, which do not form a closed ring (see Fig. 16, and Fig. 17, ), in good agreement with the results of Toomre [Toomre 1978] for non-barred galaxies.
3.4.1 Evolution of the bar
Immediately following the passage of the companion through the disc plane, the stellar bar gets displaced from the centre to a maximum radius of 2.4 kpc in the direction of the impact position in both models A1 (early impact) and A2 (late impact). The off-centering of the bar in these types of interaction has already been described by several authors (e.g., Gerber & Lamb 1994, 1996; Athanassoula 1996a; APB97). To measure the displacement of the bar we trace its centre of mass iteratively within a cylindrical shell of constant radius and then determine the distance to the centre of mass of the halo, which we can assume to be the dynamical centre of the galaxy. Figure 18 shows the relative distance of the centre of mass of the bar from this centre in the galactic plane as a function of time. In both models, the bar, still rotating around its own centre, reaches its maximum distance at or 0.1 Gyr after the impact and recenters over a period of some 2 disc rotations, or 0.6 Gyr. The shape of the stellar bar does not change significantly while being off-centered. The bar strength is not affected by the interaction compared to the isolated model (Fig. 19), although the bar also weakens due to gas inflow.
In model A1 the off-centered bar detaches from the ring due to its rotation and moves to the centre again. We find that the outer spiral arms in model A2 rotate temporarily with about half of the bar pattern speed for some 0.6 Gyr after the impact. Fig. 21 shows the phase angle of the component of the stellar disc mass distribution as a function of radius for different times. The stellar bar detaches from the spiral arms at about after the impact and reconnects again at . A similar effect has been described by Sellwood & Sparke (1988) (see their Fig. 2) who studied the dynamics of an isolated galaxy with different pattern speeds for the bar and the spiral arms. In their models the bar detaches periodically from the spiral arms. In our simulation, however, the bar detaches only once from the spiral arms, because the spiral pattern speed increases again to its initial value of after roughly after the impact. The pattern speed of the bar in model A1 decreases after the interaction for some 0.3 Gyr, but reaches its initial value of 0.3 when the bar has recentered (see Fig. 20). The spiral arms in this model rotate with the same pattern speed as the bar and remain connected to it at all times.
3.4.2 Nuclear and circumnuclear discs
In model A1 the gas, which was before the impact in the shock loci inside the stellar bar, is driven towards the centre of the displaced bar and accumulates in a small elongated nuclear disc, which is aligned with the bar major axis. At an elongated gaseous ring starts to form with a constant mean radius of approximately kpc, located close to the bar UHR. The ring and the nuclear disc are connected by spiral arms, which form at about . By way of the spiral shocks more gas is driven towards the centre and accumulates in a circumnuclear disc, which is slightly elongated perpendicular to the stellar bar.


The evolution in model A2 is similar. The gaseous nuclear disc is already present before the impact and after the stellar bar has recentered, spiral shocks between the nuclear disc and a gaseous ring, which has formed close to the UHR, drive more gas to the centre. This gas accumulates in a circumnuclear disc. In both models, A1 and A2, we find a small gap between the nuclear and circumnuclear disc with a deficiency of gas. The final gas morphology of the central disc region in both models is shown in Fig. 4.
3.4.3 Rings and spiral arms

As in the central impact models, the passage of the companion through the disc produces a radially expanding density wave in both the stars and the gas, originating from the impact position. However, since the impact in model A1 and A2 is off-centered, the symmetry of the ring wave is broken as soon as it encounters the stellar bar and spiral arms in the disc. This is illustrated for model A2 in Figure 22. An expanding ring-like structure forms at the impact position, but gets sheared out by the differential rotation in the disc as it expands, forming a pocket structure as mentioned by Gerber & Lamb (1994) who studied the caustics produced by an off-centered impact in a non-barred disc model. Because the mass distribution in the disc is more symmetric than in model A1, the features produced are more symmetric. Inside the ring or pocket there is a deficiency of gas. The density wave expands out more freely in the direction of disc rotation. When it encounters the spiral arm, it joins it to form one long tidal arm, which is connected to the end of the off-centered bar (see e.g. Fig. 16, after the impact).
In both models a second expanding density wave starts to form at after the impact, starting from the impact position in the rotating frame of the disc. When the density wave merges with the spiral arm, a tidal arm is formed which is more linear than the first tidal arm that previously formed on the opposite side of the bar. By this time the first tidal arm in model A1 already extends out to a radius of kpc, exceeding the initial disc radius. Between the two tidal arms there is a clear deficiency of stars and gas. Both tidal arms wind up and dissolve slowly with most of their material redistributed in the inner 15 kpc again. Some material, however, is left in the outer disc, giving it an asymmetric shape.
3.5 Minor axis passages : Models B1 and B2
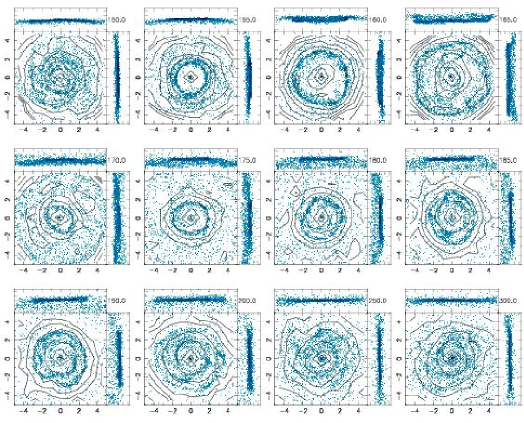
In this section we describe the evolution of the models in which the companion hits the disc in the direction of the bar minor axis at a distance of approximately kpc, just outside the bar. The impact times for models B1 and B2 are and , respectively. Figures 23 and 24 show the evolution of both the stellar and the gaseous disc.
Before the impact the evolution of the disc is similar to the isolated model I0. In contrast to the central impact cases we do not find a vertical bending of the disc prior to impact in either of the two models. After the impact the bar is temporarily off-centered, and the passage of the companion excites radial oscillations in the disc, resulting in the formation of an expanding density wave. Due to its off-centering the impact produces two long tidal arms rather than a closed ring structure. Finally the stellar bar gets almost destroyed by the interactions in both models.
3.5.1 Evolution of the bar
Immediately following the impact, the stellar bar gets displaced from the centre in both models to a maximum distance of approximately 3.0 kpc towards the impact position, i.e. to a distance comparable to the one of the impact location from the centre of the target disc (Fig. 18). The off-centered bar still rotates around its own centre, while moving radially in the disc. The bar reaches its maximum distance from the dynamical centre at a time of after the impact of the perturber, which is the same time-scale as in the major axis impact models. The offset of the bar lasts for a period of roughly Gyr, or about two disc rotations, in both models, as for models A1 and A2.
We measure the strength and pattern speed of the bar with the method decribed in section 3.1. Care was taken that no power from spiral features was included in the computation by checking that the phase angle is constant with radius. As the bar strength weakened the error in the pattern speed measurement increased, but was always below about 5%. While the pattern speed in model B2 remains constant after the impact, we find an increase of in the early impact model B1 from 0.3 to a rate of 0.5 (see Fig. 20), presumably due to the torque by the companion on the strong bar. Since the rotation curve of the disc does not change significantly after the impact, the change of is accompanied by a change of the positions of the resonances in the disc. In fact this change can be observed in the resonance gas ring located close to the bar UHR. While increases, the UHR moves inward and the ring shrinks from a radius of approximately kpc to 2.4 kpc, compatible with the change of .
By the end of the simulation the stellar bar is almost destroyed by the interactions in both models. However, the dissolution time-scale for the early impact case B1 is longer than in the corresponding model with central impact (Fig.19). There is an indication that this might also be true, but to a lesser degree, for the late impact case B2. The vertical scale-height of the disc, however, does not increase considerably after the interaction (see Fig. 5).
3.5.2 Nuclear and circumnuclear disc
In model B1, where the bar is strong at impact time, the leading gaseous shocks remain inside the off-centered stellar bar. As the bar is recentering, the gas flows toward the centre of the bar. Following the bar recentering this gas forms a dense nuclear disc which is aligned with the bar major axis. Over time the nuclear disc looses its elongated shape and becomes more circular, while the inflow rate inside a central region of pc remains constant at about yr-1. The total amount of gas driven towards the centre, which is limited by the amount of gas within the bar region before the impact, is the same as in the isolated model. In this model, however, no circumnuclear gaseous disc forms (see Fig. 4).
The nuclear disc in model B2 has already formed before the impact and remains in the centre of the temporarily off-centered bar. Some of the inflowing gas accumulates in a large diffuse circumnuclear disc, almost extending out to the gas ring at 3 kpc, which has formed following the impact.
3.5.3 Rings and spiral arms
The passage of the companion through the disc produces an expanding density wave, that becomes visible first in the gas. The general evolution of this ring-wave is similar to the one in the major axis impact models. As can be seen in Fig. 23 and 24 the density wave expands more freely in the direction of disc rotation and maintains longer its circular shape on that side ( after the impact) before merging with the spiral arm in the outer disc. As soon as the wave encounters the spiral arm, the ring feature opens up and forms a long tidal arm, extending out to a maximum radius of approximately kpc. Then the tidal spiral arm dissolves slowly and most of its material is redistributed in the initial disc region. The other part of the ring remains close to the off-centered bar and is connected to it by a straight spoke (). Between the bar and the spoke, which is visible in both the stars and the gas, there is a clear deficiency of gas.
In both models a second expanding density wave ring becomes visible after the impact, when the bar has almost recentered. The second ring in model B1 merges with a spiral arm segment, which has formed after the impact (Fig. 23). In B2 the second ring is more symmetric than the first one and encloses the weak bar completely. However, the ring is not centered with respect to the bar. In fact the bar remains connected to the ring for a few dynamical times (Fig.24). Similar to the previous simulations, additional ring-like structures or segments form in the gas at later times, merging with the spiral arms in the disc. These features are not supported by a stellar counterpart and are washed out relatively fast.
4 Discussion
4.1 Bar amplitude
The evolution of the bar strength for the different models is shown in Fig. 19 a) and b). In the isolated model the stellar bar forms within a few disc rotations and reaches its maximum strength at . As a result of the gas inflow the amplitude decreases rapidly at first, but then settles down to a quasi-stationary state, in which its strength decreases linearly on a time-scale which is significantly longer than the dynamical one, as described in §3.1.
The passage of the companion through the disc has several effects on the morphological evolution of the bar, such as a temporary off-centering and a weakening or destruction of the bar. The strength of these effects depends strongly on the impact location relative to the bar. With the central passage the bar is destroyed very shortly after the impact of the companion (, or 0.5 disc rotations). For the early impact, the bar gets torn into two fragments which move outward with the expanding ring and later merge again, while for the late impact, no bar is left after the first stellar ring becomes visible. In both models the destruction of the bar is accompanied by a considerable vertical thickening of the disc. Impacts on the bar major axis (models of type A) show a similar evolution of bar strength as in the isolated model, although the bar is temporarily off-centered after the impact for some 0.6 Gyr. Comparison with the isolated model shows that the bar strength in these models is more significantly affected by the gas inflow than by the interaction itself. When the companion is close to the disc plane, the tidal force it exerts on the bar is directed almost parallel to the bar major axis and thus does not disrupt much the bar structure. In the models with the minor axis passage (models B1 and B2) the bar is nearly destroyed, but its amplitude decreases more slowly () than in the corresponding central passage, an effect which is particularly evident in model B1. The decay of the bar amplitude in both models can be described as quasi-exponential. The dissolution of the bar is not accompanied by a vertical thickening of the disc in these models. For the minor axis impacts it seems to be possible to destroy the stellar bar, while keeping the disc, in contrast to the pure N-body simulations, where it is found that an interaction sufficiently strong to destroy the bar also destroys the disc [Athanassoula 1996b], i.e. the ratio between the vertical and the radial scale-heights increased very significantly. This could be due to the fact that the decrease in the bar amplitude in the purely stellar cases can be due only to the impact, while in simulations including a gaseous component it is due to the cummulative effects of the impact and the gaseous central mass concentration.
Central impacts and passages through the bar minor axis seem to cause more damage to the bar than the major axis impacts. The disc thickens more if it is hit at the centre than at the periphery so that the disc of models of type C thickens considerably, while models of type A and B do not show a significant difference in this regard. Between early and late impact models with same impact positions we find differences in the bar evolution shortly after the impact because of the different initial state of the bar at impact time, but the long term evolution of the bar in both types of models is similar. We conclude that the fate of the bar is more sensitive to the impact location of the companion relative to the bar than to the evolutionary phase of the bar during impact. In general the impact of a companion tends to accelerate the evolution from a strongly barred spiral to a weakly or non-barred galaxy, a trend also found in the isolated model, but on longer time-scales.
4.2 Bar pattern speed
The evolution of the pattern speed in the isolated model is mainly influenced by two processes. Angular momentum is transferred to the outer disc and halo resulting in a decrease of the pattern speed (e.g., Tremaine & Weinberg 1984; Weinberg 1985; Little & Carlberg 1991; Hernquist & Weinberg 1992; Athanassoula 1996b, 2002; Debattista & Sellwood 1998, 2000), while mass accretion into the nuclear region steepens the rotation curve at the centre and leads to an increase of (e.g., Friedli & Benz 1993; Heller & Shlosman 1994; Berentzen et al. 1998). In our isolated model we find that during the early phases of the bar evolution, i.e. during its growth and dissolution before it has reached quasi-stability, the pattern speed increases linearly from at to at , and thereafter stays constant to the end of the run. This behavior is in agreement with other numerical simulations which have included a gas component (e.g., Friedli & Benz 1993; Heller & Shlosman 1994; Berentzen et al. 1998), showing either constant or slightly increasing pattern speeds.
Due to the interaction we find for models with impacts on either the major or the minor axis of the bar some variations in the pattern speed (see Fig. 20). In the late impact models, shortly after the impact, the pattern speed decreases temporarily by about , but when the bar recenters again increases back to its original value, though with oscillations that are damped over time. One of our models, however, shows an evolution in pattern speed which is different from that of our other vertical impact models. In model B1, where the companion hits the disc on the minor axis of the strong bar, we find an increase of from 0.3 to 0.5. The bar maintains this high rotation after recentering and so has gained angular momentum. This effect is likely due to torques exerted by the perturber galaxy on the bar. For the central passage models C1 and C2 the bar seems to be slowed down by the interaction, although the amplitude of the bar is only marginal and a pattern speed is difficult to measure with confidence. The collisionless models studied by Athanassoula [Athanassoula 1996a] and APB97 showed a decrease of the bar pattern speed in those models where an abrupt change of occurred after the impact. Sundin et al. [Sundin et al. 1993] found that depending on the mass of the perturber, both an increase or a decrease of was possible. In their models, however, the trajectory of the perturbing galaxy lies in the equatorial plane of the disc.
4.3 Off-centred bars
Another important feature produced by the interaction is the displacement of the bar from the centre of the galaxy. Asymmetries of this type are frequently found in disc galaxies, particularly in late type galaxies (e.g., de Vaucouleurs & Freeman 1972; Odewahn 1996). While this kind of asymmetry could be produced by strong modes in the disc, an off-centred impact of a companion galaxy should generally give rise to more significant shifts, depending on the impact parameters. In all our models with off-set passages we notice a strong displacement of the bar structure for approximately 0.6 Gyr, independent of the evolutionary phase of the bar at impact time. The maximum displacement of the bar centre, which is in our models roughly kpc, depends only on the impact position or distance of the companion from the bar centre, but not on the strength of the bar at impact time. The size of the displacement in our models is in good agreement with the relative displacement parameter found by Feitzinger [Feitzinger 1980] for Magellanic type galaxies. The off-centring of the bar is also accompanied by asymmetries in the spiral structure. The morphology of the discs with off-centred bars in our simulations is dominated by one long spiral arm, which formed after the impact by an expanding density wave, in agreement with the results of Athanassoula [Athanassoula 1996b] and with the morphology of several asymmetric barred galaxies as e.g. NGC 4027. The induced asymmetries are visible in the disc, for about 0.6 Gyr after the impact.
4.4 Nuclear and circumnuclear disc
The presence of the bar results in a considerable change in the mass distribution of the gas. Due to the bar torques, gas is driven towards the centre of the galaxy and accumulates in nuclear and circumnuclear discs. These type of discs form in both the isolated and the interacting models, although their shape and size varies depending on the interaction parameters (Fig. 4). The circumnuclear disc is always elongated perpendicular to the major axis of the bar, indicating that the gas in it populates the orbits and is trapped therefore between the inner and the outer ILR, which have been confirmed to be present by the surfaces of section. The gas in the nuclear disc represents some 18% of the total dynamical mass inside the central region, i.e. within a radius of 1 kpc. This is about the same fraction as found in the isolated barred galaxy model by Berentzen et al. (1998).
The cn-discs in the interacting models with central impact are much larger than in the isolated model (up to a factor of three in radius). Since the bar is destroyed by the interaction almost immediately in these models, there acts no torque on the gas to drive it closer to the centre. In the major axis impacts the bar keeps roughly the same strength as in the isolated model and therefore we do not find a significant difference in the morphology of the central region. Very little additional gas is driven towards the centre by the impact itself.
4.5 Rings and spokes
In our central impact models C1 and C2 we find expanding ring structures in the disc, following the passage of the companion. The process of ring formation by interactions is described for non-barred galaxies in detail by Lynds & Toomre [Lynds & Toomre 1976]. These authors show that the expanding stellar ring is a density wave feature travelling through the disc and due to radial oscillations of the disc particles, as later confirmed by simulations (e.g., APB97). We find such radial oscillations for both the stellar and the gas particles, of which the latter contribute longer to the rings. The gaseous ring always remains within the expanding stellar ring, having roughly the same radius, but considerably smaller width. The gaseous rings fragment on the inner side due to the self-gravity of the gas and its dissipative nature, while gas piles up in the ring during its expansion, because the gaseous orbits cannot cross. In contrast, the stellar ring becomes weaker and broader while expanding, but the gas ring can be identified for a longer time.
The expansion velocity of the rings decreases with radius as predicted by the impulse approximation and as found in -body simulations (APB97). The expansion velocity of the first ring drops gradually from 88 km s-1 (7.5 ) to 35 km s-1 (3 , where is the sound speed in the gas). With the passage of the ring the local velocity dispersion in the disc increases. The second ring in our models starts off slower than the first, with an expansion velocity which decreases from 29 km s-1 (2.5 ) to 11.72 km s-1 (1 ). Note that there is a transition in the gas from a supersonic density wave supported by the stellar rings to an acoustic wave.
A well known example of a collisionally induced ring galaxy is the Cartwheel galaxy (A0035-324). Density enhancements like the rings are accompanied by the formation of bright young blue stars and HII regions, while the induced stellar ring represents mainly the underlying disc population. The star-formation rate found in the outer ring of the Cartwheel galaxy is about (Higdon 1995). After the passage of such star-forming rings, color gradients are expected in the disc and have been observed in several ring galaxies (Korchagin, Vorobyov & Mayya 1999). In particular, such radial age gradients have been found in the optical and the NIR in the Cartwheel galaxy (Marcum, Appleton & Hidgon 1992). In numerical simulations which have included star formation [Mihos & Hernquist 1994], however, such gradients remained for only a short period of time, before the nuclear starburst dominated the rings. In our model C2 we find that the second gas ring, which forms after the impact, consists mainly of particles which had already contributed to the first one. Thus, if we assume that some fraction of this gas is used up by star formation, we might expect the inner ring to contain considerably less gas than the outer ones, as confirmed by the observations of Cartwheel.
4.6 Role of the halo
To study the role of the halo response in our simulations, we rerun a simulation of model C2, but with a fixed (frozen) halo, i.e. we represented the halo by an external force, unchanged through the simulation. We find that the morphological evolution of the disc in face-on projection is very similar to the case with a live halo, e.g., the number of rings formed after the impact, their shape and their expansion velocity are qualitatively reproduced. The main difference between the two models is found in the vertical structure of the disc following the impact. In the edge-on projection we find that in the frozen halo model both the gaseous and the stellar disc become vertically thicker after the impact and settle down in a more irregular shape, i.e. not disc-like, in contrast to the live halo model. In the latter we find that the halo gets centrally less concentrated and dynamically hotter after the impact. We therefore conclude that the live halo stabilizes the disc by absorbing energy from the impact.
5 Summary
We have performed fully self-consistent N-body/SPH simulations to study the interaction between an initially barred galaxy and a less massive spherical companion. The companion passes almost vertically through the disc of the host galaxy and leaves the host system following the impact. The mass of the companion has been chosen so as to be a significant perturbation to the disc. Two different impact times have been chosen, representing different characteristic phases of the isolated bar evolution. In the first set of simulations the impact is at an early phase of evolution when the bar is strongest, while in the second set an advanced phase has been chosen, i.e. when the bar is weak and has settled down in a quasi-stable state. Beside the impact time, we also varied the position of the impact with respect to the bar in the disc. In the simplest case the companion hits the bar at its centre, while in other cases it hits the disc outside the bar at its major or minor axis. Interactions at times before a stellar bar has formed or during its non-linear growth phase have not been performed here.
The interactions produce characteristic features, which remain in the disc for only a few dynamical times. In general the gaseous features tend to persist longer than their stellar counterparts, though after about 1 Gyr both of them are dissolved. The most prominent features produced by the interaction are the collisionally induced rings, which are well known from non-barred galaxies. The central impacts produce expanding stellar and gaseous rings, whose symmetry is disturbed in the case of the strong bar model. The stellar ring is a density wave produced by forced radial oscillations of the stellar orbits. The basic properties of the stellar rings, such as density or expansion velocity, are well described, at least qualitativly, by the impulse approximation. The gaseous rings also show the characteristics of a density wave, which is supported by the potential of the stellar ring. We find that more than two rings can be formed in the gaseous disc by the impact, some of them not supported by stellar density enhancements. These rings are less pronounced than the first two rings and dissolve much faster. In contrast to central impacts the off-centered passages produce outward-expanding ring-like density waves not in the form of closed rings, but as long tidal spiral arms whose extent exceeds the inital disc cut-off radius. These tidal arms are present for some few dynamical times in our simulations, before they dissolve and the material in the arms is redistributed in the disc.
In the simulations with off-centered impacts the stellar bar gets temporarily displaced from the center of the galaxy for some 0.6 Gyr before it recenters again. The gas inside the bar is driven towards the centre, forming a nuclear disc, whose mass is determined by the amount of gas located in the bar region. Almost no additional gas is driven towards the centre of the galaxy due to the interaction, compared to the isolated model. In most of our simulations the stellar bar is destroyed after the impact of the companion, leaving behind a dense stellar core at the centre of the galaxy. In the central impact models the destruction of the bar is accompanied with a considerable thickening of the disc. In models with minor axis impacts, however, it seems to be possible to destroy the bar while keeping the disc. We also find cases (i.e., the major axis impact) in which the bar survives the interaction, resembling the weak bar of the isolated model. We argue that the interaction with a companion can drive the transition from a strongly barred galaxy to a weakly barred galaxy on shorter time-scales than those found in isolated models. The impact time, or the dynamical phase of the disc, does not play a significant role in determining the final morphology of the disc. The dense nuclear disc and the surrounding gap in the gas distribution are the only morphological imprints which survive the interaction, even after the bar has dissolved. Such features in a non-barred galaxy may indicate the former existence of a bar. Apart from that, looking at the final face-on morphology of the gaseous disc – in which the differences are more clear than in the stellar – the interacting and non-interacting models can hardly be separated. This might be possible from models including star formation, e.g., from the resulting color/metallicity gradients.
6 ACKNOWLEDGMENTS
We would like to thank Albert Bosma for interesting discussions, J.C. Lambert and C. Theis for their computer assistance and an anonymous referee for comments which helped to improve the presentation. I.B. acknowledges DFG grant Fr 325/48-1, /48-2 which supported this work and the GRAPE facilities at the Sternwarte Göttingen. C.H. acknowledges support from DFG grant Fr 325/39-1, /39-2. E.A. would like to thank the region PACA, the IGRAP, the INSU/CNRS and the University of Aix-Marseille I for funds to develop the GRAPE facilities used for part of the calculations in this paper.
References
- [Athanassoula et al. 1983] Athanassoula E., Bienayme O., Martinet L., Pfenniger D., 1983, A&A, 127, 349
- [Athanassoula 1992a] Athanassoula E., 1992a, MNRAS, 259, 328
- [Athanassoula 1992b] Athanassoula E., 1992b, MNRAS, 259, 345
- [Athanassoula 1996a] Athanassoula E., 1996a, in: Barred Galaxies, eds. R. Buta, D.A. Crocker & B.G. Elmegreen, Astron. Soc. of the Pacific Conference Series, p. 309
- [Athanassoula 1996b] Athanassoula E., 1996b, in: Barred Galaxies and Circumnuclear Activity, eds. Aa. Sandquist & P.O. Lindblad, Lecture Notes in Physics, Vol. 474, Springer Verlag, p. 59
- [Athanassoula et al. 1997] Athanassoula E., Puerari I., Bosma A., 1997, MNRAS, 286, 284
- [Athanassoula 1999] Athanassoula E., 1999, in: Astrophysical Discs, eds. J.A. Sellwood & J. Goodman, A.S.P. Conf. Series, Vol. 160, p. 351
- [Athanassoula 2002] Athanassoula E., 2002, ApJL, 569, 83
- [Barnes & Hernquist 1992] Barnes J.E., Hernquist L., 1992, ARA&A, 30, 705
- [Barnes & Hernquist 1996] Barnes J.E., Hernquist L., 1996, ApJ, 471, 115
- [Berentzen et al. 1998] Berentzen I., Heller C.H., Shlosman I., Fricke K.J., 1998, MNRAS 300, 49
- [Binney & Tremaine 1987] Binney J., Tremaine S., 1987, Galactic Dynamics, Prinction, Princton University Press
- [Contopoulos & Mertzanides 1977] Contopoulos G., Mertzanides C., 1977, A&A, 61, 477
- [Contopoulos & Papayannopoulos 1980] Contopoulos G., Papayannopoulos, 1980, A&A, 92, 33
- [Debattista & Sellwood 1998] Debattista V.P., Sellwood J.A., 1998, ApJ, 493, 5
- [Debattista & Sellwood 2000] Debattista V.P., Sellwood J.A., 2000, ApJ, 543, 70
- [de Vaucouleurs & Freeman 1972] de Vaucouleurs G., Freeman K.C., 1972, Vistas in Astronomy, 14, 163
- [Eskridge et al. 2000] Eskridge P.B. et al., 2000, AJ, 119, 536
- [Feitzinger 1980] Feitzinger J.V., 1980, Space Sci. Review, 27, 35
- [Friedli & Benz 1993] Friedli D., Benz W., 1993, A&A, 268, 65
- [Gerber & Lamb1994] Gerber R.A., Lamb S.A., 1994, ApJ ,431, 604
- [Gerber & Lamb1996] Gerber R.A., Lamb S.A., 1996, MNRAS, 278, 345
- [Gerin et al. 1990] Gerin M., Combes F., Athanassoula E., 1990, A&A, 230, 37
- [Heller 1991] Heller C.H., 1991, Ph.D. thesis, Yale University
- [Heller & Shlosman 1994] Heller C.H., Shlosman, I., 1994, ApJ, 424, 84
- [Hernquist & Weinberg 1992] Hernquist L., Weinberg M.D., 1992, ApJ, 400, 80
- [Hernquist & Weil 1993] Hernquist L., Weil M.L., 1993, MNRAS, 261, 804
- [Higdon 1995] Higdon J.L., 1995, ApJ, 455, 524
- [Korchagin et al. 1999] Korchagin V., Vorobyov E.I., Mayya Y.D., 1999, ApJ, 522, 767
- [Kuzmin 1956] Kuzmin G., 1956, Astron. Zh, 33, 27
- [Little & Carlberg 1991] Little B., Carlberg R.G., 1991, MNRAS, 250, 161
- [Lynds & Toomre 1976] Lynds R., Toomre A., 1976, ApJ, 209, 328
- [Marcum, Appleton & Hidgon 1992] Marcum P.M., Appleton P.N., Higdon J.L., 1992, ApJ, 399, 57
- [Mihos & Hernquist 1994] Mihos J.C., Hernquist L., 1994, ApJ, 437, 611
- [Monaghan 1992] Monaghan J.J., 1992, ARA&A, 30, 543
- [Noguchi 1987] Noguchi M., 1987, MNRAS, 228, 635
- [Noguchi 1988] Noguchi M., 1988, A&A, 203, 259
- [Odewahn 1996] Odewahn S.C., 1996, in: Barred Galaxies, eds. R. Buta, D.A. Crocker & B.G. Elmegreen, Astron. Soc. of the Pacific Conference Series, p. 30
- [Ostriker & Peebles 1973] Ostriker J.P., Peebles P.J.E., 1973, ApJ, 186, 467
- [Pèrez-Ramírez et al. 2000] Pèrez-Ramírez D., Knapen J.H., Peletier R.F., Laine S., Doyon R., Nadeau D., 2000, MNRAS, 317, 234
- [Plummer 1911] Plummer H.C., 1911, MNRAS, 71, 460
- [Pompea & Rieke 1990] Pompea S.M., Rieke G.H., 1990, ApJ, 356, 416
- [Rix 1993] Rix H.-W., 1993, PASP, 105, 999
- [Rix & Rieke 1993] Rix H.-W., Rieke M.J., 1993, ApJ, 418, 123
- [Seigar & James 1998] Seigar M.S., James P.A., 1998, MNRAS, 299, 672
- [Sellwood & Sparke 1988] Sellwood J.A., Sparke L.S., 1988, MNRAS, 231, 25
- [Sellwood & Wilkinson 1993] Sellwood J.A., Wilkinson A., 1993, Rep. Prog. Phys., 56, 173
- [Shlosman & Noguchi 1993] Shlosman I., Noguchi M., 1993, ApJ, 414, 474
- [Shlosman, Begelman & Frank 1990] Shlosman I., Begelman M.C., Frank J., 1990, Nature, 345, 679
- [Spitzer 1942] Spitzer L., 1942, ApJ, 95, 329
- [Steinmetz 1996] Steinmetz M., 1996, MNRAS, 278, 1005
- [Sugimoto et al. 1990] Sugimoto D., Chikada Y., Makino J., Ito T., Ebisuzaki T., Umemura M., 1990, Nat, 345, 33
- [Sundin & Sundelius 1991] Sundin M., Sundelius B., 1991, A&A, 245, L5
- [Sundin et al. 1993] Sundin M., Donner K.J., Sundelius B., 1993, A&A, 280, 105
- [Tremaine & Weinberg 1984] Tremaine S., Weinberg M.D., 1984, MNRAS, 209, 729
- [Toomre 1963] Toomre A., 1963, ApJ, 138, 385
- [Toomre 1964] Toomre A., 1964, ApJ, 139, 1217
- [Toomre 1978] Toomre A., 1978, in: The large scale structure of the universe, eds., M.S. Longair & J. Einasto, Dordrecht, D. Reidel Publishing Co., p. 109
- [Toomre & Toomre 1972] Toomre A., Toomre J., 1972, ApJ, 139, 179, 623
- [Weinberg 1985] Weinberg M., 1985, MNRAS, 213, 451
- [Weinberg 1991] Weinberg M., 1991, ApJ, 373, 391
- [Zaritsky et al. 1993] Zaritsky D., Smith R., Frenk C., White S.D.M., 1993, ApJ, 405, 464
- [Zaritsky et al. 1997] Zaritsky D., Smith R., Frenk C., White S.D.M., 1997, ApJ, 478, 39