The X-ray-faint Emission of the Supermassive Nuclear Black Hole of IC 1459
Abstract
Chandra observations of the supermassive black hole in the nucleus of IC 1459 show a weak (=81040erg s-1, 0.3-8 keV), unabsorbed nuclear X-ray source, with a slope = 1.880.09, and no strong Fe-K line at 6.4 keV (EW382 eV). This describes a normal AGN X-ray spectrum, but lies at 310-7 below the Eddington limit. The SED of the IC 1459 nucleus is extremely radio loud compared to normal radio-loud quasars. The nucleus is surrounded by hot ISM (kT0.5-0.6 keV) with an average density of 0.3 cm-3, within the central 180 pc radius, which is comparable to the gravitational capture radius, 140 pc. We estimate that for a standard AGN efficiency of 10%, the Bondi accretion would correspond to a luminosity of 61044erg s-1, nearly four orders of magnitude higher than . ADAF solutions can explain the X-ray spectrum, but not the high radio/X-ray ratio. A jet model fits the radio-100m and X-ray spectra well. The total power in this jet is 10% of LBondi, implying that accretion close to the Bondi rate is needed.
1 Introduction
Studies of the stellar dynamics of the inner cores of galaxies have established the presence of hidden supermassive objects of , which are believed to be black holes (Richstone et al 1998, Magorrian et al 1998, van der Marel 1999). The masses of these black holes are loosely correlated with the bulge luminosity (Magorrian et al 1998) and tightly correlated with the central velocity dispersion (Ferrarese & Merrit 2000, Gebhardt et al. 2000) and the central light concentration (Graham et al 2001), and appear to be ubiquitous in giant E and S0 galaxies. Since accreting black holes are believed to be responsible for luminous active galactic nuclei (AGN) and quasars, the question arises of why nuclear activity is not more widespread, instead of being confined to only a small percentage of all galaxies. Suggested explanations for this lack of nuclear activity have included the presence of Compton-thick obscuring material in the line of sight to the nucleus (e.g. the Circinus galaxy, Matt et al. 1999), feedback modulated accretion with a low duty cycle (Binney & Tabor 1995, Ciotti & Ostriker 2001), and inefficient accretion onto the black hole (e.g., Sgr A*, see review by Melia & Falcke 2001, Di Matteo et al. 2000). The latter include instability-driven periodic accretion in a thin accretion disk (Siemiginowska & Elvis 1997; Siemiginowska, Czerny & Kostyunin 1996), and the more popular radiatively-inefficient advection dominated accretion flow (ADAF, CDAF, ADIOS) models (see review by Narayan 2002).
X-ray observations offer a way of constraining these models, and discriminating among different emission scenarios, because different characteristic X-ray spectra are expected in each case. However, until recently, it was impossible to get a ‘clean’ look at the faint AGN that may be hidden in the nuclei of large bulge galaxies, because of the relatively large beams of X-ray telescopes ( FWHM). Chandra (Weisskopf et al. 2000), with its FWHM PSF (Van Speybroeck et al. 1997), gives us the unique opportunity to take a direct, uncontaminated, look at the faint nuclear emission that may be associated with supermassive nuclear black holes. Moreover, with Chandra we can investigate directly the circum-nuclear region down to pc radii, or even deeper in, depending on the distance of the galaxy. This gives us a direct way to constrain the accretion rate on the black hole, if a hot interstellar medium (ISM) is detected (Bondi 1952).
In this paper we report the results of the Chandra ACIS-S observation of the nucleus of IC 1459 (Table 1). IC 1459 is a much studied Elliptical (E3) galaxy. This galaxy has a counter-rotating core (Franx & Illingworth 1988), suggesting a merger event in its past, and a massive nuclear black hole (, see Table 1), which is however associated only with moderate AGN activity. The nucleus of IC 1459 has a strong (1 Jy) largely compact radio source with diameter 0.03arcsec (3 pc for a distance D = 22 Mpc, Slee et al., 1994, Ekers et al. 1989) and an inverted spectrum (, , Drinkwater et al 1997); a hard AGN-like X-ray component (ASCA; Matsumoto et al 1997); a strong LINER optical spectrum (Phillips et al., 1986); and the large 25m/60m IRAS ratio typical of AGN (de Grijp et al., 1985). However, a normal radio-loud AGN with this core 5 GHz flux (Elvis et al., 1994) would have an X-ray luminosity some 10 times brighter than the 1041erg s-1 observed in IC 1459 (Fabbiano, Kim & Trinchieri 1992), and a non-thermal optical continuum at least 2 magnitudes brighter than observed. Instead this E3 galaxy has photometrically normal colors down to a few arcsec and a normal elliptical surface brightness profile into the central 1 arcsec (107 pc for the distance in Table 1, Franx et al., 1988).
To investigate the X-ray properties of this nucleus, we observed IC 1459 with Chandra ACIS-S. This observation allows us to separate the nuclear point source from the surrounding galaxian emission, and thus obtain an uncontaminated characterization of its X-ray spectrum. We can also explore the properties of the circum-nuclear region, that may provide the fuel for the AGN. Here we report the results of this observation as it pertains to the nuclear source. The X-ray properties of the general galaxian emission will be the subject of a future paper. In §2. we describe the data reduction and the spectral analysis; in §3. we compare these results with model prediction.
2 Observations and Data Analysis
Chandra was pointed to IC 1459 on 12 August 2001, for 58.8 ks with the back-illuminated ACIS-S3 CCD chip at the focus (Observation ID: 2196). Table 1 summarizes some of the properties of IC 1459 and gives the log of the Chandra observations. The observations were done in a 1/2 sub-array mode, to minimize possible ‘pile-up’ (Chandra Proposers’ Observatory Guide 2001) of a bright nuclear source. This resulted in halving the effective chip area, but given the galaxy size (5.23.8 arcmin, NED), the entire optical extent of IC 1459 is still imaged. ACIS was at a temperature of -120 C during these observations. The satellite telemetry was processed at the Chandra X-ray Center (CXC) with the version 6.2.2 of the Standard Data Processing (SDP) system and CALDB version 2.6, to correct for the motion of the satellite and to apply instrument calibration. Verification of the data products showed no anomalies. The data products were then analyzed with the CXC CIAO software (Version 2.2.1). CIAO Data Model tools were used for data manipulation, such as screening out high background data, and producing images in given energy bands. DS9 and ‘funtools’ were used for interactive image analysis.
The data were screened to exclude high background regions, following the thread in the CIAO web page 111http://cxc.harvard.edu/ciao/threads/filter_ltcrv/ which results in the removal of data with global background values outside of the mean. Because this procedure resulted in 3 Good Time Interval (GTI) files, these files were merged with dmmerge and then applied together with the original GTI from processing. The resulting screened exposure is 55.1 ks. Since a new ACIS-S3 calibration was released after our initial analysis, we have applied it to the event file, by running ‘acis_process_events’. Using this recalibrated data, we found that any differences in our spectral results are negligible (at the second decimal place) and well within the errors.
Fig. 1 (left) shows the (0.3-10 keV) ACIS-S3 image of the central area of IC 1459. A point-like source is prominent in the nucleus. A number of fainter point-like sources, in all likelihood belonging to the XRB population of IC 1459, are also visible, at significantly lower count rates; these will be the subject of future work. Fig. 1 (right) shows an adaptively smoothed image of the same region (using csmooth). This image shows clearly the diffuse emission in the field, including a luminous flattened E-W elongated region surrounding the nucleus. We will discuss the extended emission in detail in the future. Here we concentrate on the properties of the point-like nuclear source.
2.1 The Nuclear Spectrum
We used the ‘acisspec’ script, in the 2.2.1 CIAO release, to extract the nuclear data for spectral analysis. This task produces spectral response matrices files (RMF), by a weighted average (based on the counts for each ACIS pixel) of all the relevant calibration files. The background was taken from a large source-free region in the portion of the ACIS S3 chip unoccupied by IC 1459 (a circle of 78” radius, centered 205” SW of the nucleus). This background is representative of the field background, and does not include the contribution of the local galaxian diffuse emission (see fig. 1) in the nuclear beam. The effect of vignetting at these radial distances is less than 10%. We chose this approach, rather than subtracting a local background, because the surface brightness of the diffuse galaxian emission is likely to be larger at the inner radii than in the surrounding regions. So, considering this emission component explicitly in the spectral fit of the nuclear data is in principle less conducive to error. The nuclear data were extracted from a 1.7” radius circle centered on the centroid of the nuclear count distribution [RA = 22 57 10.62, Dec = -36 27 43.9, (J2000)], shown in fig. 1 (left panel). This radius contains of the nuclear PSF (Chandra Proposers’ Observatory Guide, 2001). The data were binned in energy bins with a minimum of 15 net counts per bin. We restricted our spectral analysis to data in the 0.3-8 keV range, because the spectral calibrations are more uncertain at the lowest energies, and the instrumental background tends to dominate at the highest energies. Even so, the background contributes less than a count in our high energy spectral bins. We obtained a total of 6544.7 net counts distributed into 198 spectral bins. We used Sherpa to fit the spectral data to models. The results are summarized in Table 2.
We first fitted the data with an absorbed power-law model. Although this fit was good (see Table 2), we noticed a possible trend of excess residuals at the energies keV. This can be seen from fig. 2a, which shows the 0.3-2.0 keV portion of the spectrum, with the best fit and residuals. Restricting the fit to the 0.3-1.3 keV range, we find that the simple absorbed power law model is not a good representation of the data in this energy range ( for 59 degrees of freedom). To account for these deviations, we used a composite model consisting of an absorbed power-law plus optically thin plasma emission (MEKAL, the Mewe-Kaastra-Liedhal plasma model; e.g. Liedhal et al 1995) with solar abundance, and applied (fixed) Galactic to both components. This choice is justified by the presence of diffuse emission in the circum-nuclear region (fig. 1), which would contribute to the spectral counts, given that the background was derived from a region outside the galaxy. This model was first fitted to the entire 0.3-8 keV spectrum; the resulting (Table 2) is 155 for 192 degrees of freedom, suggesting that the model may ‘over-represent’ the data. However, when the best fit model is applied to the 0.3-1.3 keV data, to estimate the goodness of fit in this spectral range, an F test shows that this is now improved at the 99.5% confidence level (almost ). In this composite model, a thermal component with kT keV and X-ray luminosity of (D = 22 Mpc) accounts for the soft excess. The power-law slope () and unabsorbed luminosity () do not change appreciably (Table 2). Fig. 2b shows the data, best-fit 2-component model and residuals in the 03.-2.0 keV range. Fig. 3 shows the data, fit and residuals for the 2-component model for the 2.0-8.0 keV portion of the spectrum. Fig. 4 shows the power-law component and confidence contours. Fig. 5 shows kT-normalization confidence contours for the thermal component.
Visual inspection of the spectrum (fig. 3) does not reveal any excess emission at 6.4 keV, to suggest the presence of an Fe K- line. We derived a 3 upper limit of 382 eV on the equivalent width of such a line over the best-fit power-law, by forcing the fit of a narrow line at 6.4 keV, calculating the 3 upper bound, and then using the Sherpa eqwidth command to calculate a 3 equivalent width over the best-fit power-law continuum.
2.2 The Circum-Nuclear Hot ISM
As shown by fig. 1, the circum-nuclear environment in IC1459 is pervaded by extended emission, most intense in the annulus surrounding the nuclear spectrum extraction region. The nuclear spectral fit above suggests the presence of hot ISM with kT0.6 keV. Such a hot ISM may fuel the central black hole. Following Bondi accretion theory (1952), we can estimate the accretion rate at the gravitational capture radius, which depends on the mass of the black hole and the temperature and density of the ISM (see e.g. Di Matteo et al 2002). The ISM parameters can be estimated from the X-ray data.
To constrain the temperature and density, we investigated the spectral properties of the hot ISM, by analyzing the spectrum of data extracted from a point-source-free circum-nuclear polygon (fig. 1, right panel), in the 0.3-8. keV range. The results are summarized in Table 3. A two-component model (optically thin thermal emission and a power-law) was required to obtain an acceptable fit (see also discussion in Kim & Fabbiano, 2002, for a similar situation in NGC 1316). The power-law normalization is of that of the nuclear power-law (equivalent to ), consistent with spill-over of nuclear counts. However, unresolved galaxian X-ray binaries could also contribute (see Kim & Fabbiano 2002); these issues will be examined fully in a future paper. Of immediate relevance, the best-fit temperature of the thermal component is consistent with the results of the two-component nuclear fit, confirming the presence of a hot ISM with kT keV in the vicinities of the nuclear black hole.
Because of the overpowering presence of the nuclear point-source, we cannot directly measure the luminosity of the hot ISM in the centermost region, from which to obtain an estimate of the electron density . We have an estimate of this luminosity from our spectral analysis (Table 2, §2.1), but it includes a foreground and background contribution from the surrounding hot ISM. Since Chandra resolves this emission, we can estimate its contribution and subtract it. To this end, we used an extraction region comparable in size and adjacent to the nuclear one to estimate the amount of emission from the surrounding volume. We subtracted this value from the nuclear thermal emission estimate, to obtain the emission from the circum-nuclear volume. This procedure results in a corrected luminosity of from a sphere corresponding to the 182 pc radius nuclear spectrum extraction region, which is comparable to the 140 pc gravitational capture radius (§4.1). This luminosity is 20% lower than the hot ISM in Table 2. A minimum lower estimate on this value could be obtained by a simple extrapolation of the background-subtracted value from the circum-nuclear region. This would amount to . We used these estimates to correct the emission measure from the spectral fit (Table 2) to derive (, if the minimum lower estimate of is used). We estimate the accretion rate based on the above parameters and discuss its consequences below.
3 Spectral Energy Distribution of IC 1459
We have compiled literature data to complement our results and derive the spectral energy distribution (SED) of IC 1459 (Table 4, fig. 6). The radio source (Slee et al. 1994) has a size 0.03 arcsec, and the X-ray nuclear source is compact at the arcsec level, so their total fluxes represent the nucleus well. In the millimeter band the size of the source is unknown (17-28 arcsec, Knapp & Patten 1991), but the total fluxes appear to form an extrapolation of the radio spectrum, so that the source is likely to be compact. In the far-infrared the large beam (arcminute) 12m-100m IRAS fluxes lie above the radio-mm spectrum. A small beam (5 arcsec dia.) 10m point (Sparks et al. 1986) has only 10% of the IRAS 12m flux. So although IC 1459 is unusual in having detections in all four IRAS bands, it appears that most of this emission originates outside the nuclear region, at least at the shorter wavelengths.
There could be cooler dust to which IRAS was not sensitive. The most possible dust would be given by fitting the tail of a dust spectrum (in space) through the highest frequency millimeter photometry point at 0.8 mm. In this case this fails to fit the lower frequency millimeter points at 1.1, 1.3 and 2.0 mm. So up to 2.0 mm non-thermal processes must be dominant, but the higher frequency infrared points can be ascribed to dust in the galaxy body. The small aperture (5 arcsec dia.) JHK measurements lie well above the equal aperture 10m point.
A blue (V-I1, Carollo et al. 1997) point-like nucleus with V=18.4 is seen in HST imaging (Tomita et al. 2000, Cappellari et al. 2002). This color is the same as that of 3C 273 (McAlary et al. 1983). The blue nucleus is close to a narrow band of ‘strong’ dust absorption. An F814W band HST image of the IC 1459 nucleus is giving a nuclear flux of 0.26 mJy (Verdoes-Kleijn et al. 2002).
For comparison we plot in fig.6 the median SED of the radio loud low redshift quasars from the sample of Elvis et al. (1994). This SED has been renormalized arbitrarily to match the nuclear optical data for IC 1459, comes close to the X-ray flux, but falls well below the radio data. The IC 1459 nucleus is thus extremely radio-loud compared even with radio-loud quasars.
IC 1459 has both nuclear X-rays and nuclear H emission (Verdoes-Kleijn et al. 2002) at a level 37.9 erg s-1 (Macchetto et al. 1996, corrected from their distance of 29 Mpc to our value of 22 Mpc). These values fit on the normal vs. correlation (Elvis et al. 1978, Ho et al. 2001). Using to predict the ionizing continuum (Osterbrock 1989, equation 11.3, figure 11.6), and assuming a power-law continuum slope of 1.5, gives (912Å)=0.021 mJy, where is the covering factor of continuum source for the H emitting gas. The derived (912Å) would be a factor 2 larger for a continuum slope of 2.0.
4 Discussion
4.1 Luminosity and Bondi Accretion
The X-ray luminosity of the nuclear point-source in IC1459 (7.9) is of the Eddington luminosity of the 2 nuclear black hole (Cappellari et al. 2002, for D = 22 Mpc). Why is this nucleus not a luminous AGN? In principle, since the AGN is surrounded by a hot ISM, there should be enough fuel to power the black hole and generate higher X-ray luminosity. However, this requires (1) the gas to accrete onto the black hole and (2) relatively high efficiency of the accretion process.
Following Fabian & Canizares (1988) and Di Matteo et al. (2002), we can estimate the Bondi accretion rate using the parameters of the hot ISM derived in §2. Bondi theory is used to obtain an estimate of the gravitational capture radius (see also Frank, King & Raine 1992): , where is the temperature of the ISM in units of 0.8 keV, and is the mass of the black hole in units of .
For the parameters of the nucleus of IC 1459, the gravitational capture radius is at 140 pc. While at the distance of IC 1459 the combined Chandra mirror and ACIS resolution (0”.5) corresponds to 53 pc, and so in principle a direct measurement of the gas parameters at the capture radius could be attempted, this is impeded by the presence of the bright nuclear point-like source, which dominates the emission within a 1′′.7 radius (§2). The density at the capture radius is likely to be higher than our average estimate from §2.2, given that the radial density distribution tends to increase at smaller radii (see e.g. M87, di Matteo et al 2002). Therefore our estimate of the Bondi accretion rate () can be considered as a lower limit.
We estimate from the expression given in Di
Matteo et al (2002):
,
where is the density of the ISM in units of
0.17 cm-3. We adopt kT=0.5 keV, as suggested by our
spectral analysis, for the temperature of the ISM, and , as derived in §2.2, and obtain year-1. Using our extreme
lower estimate of (see §2.2), would
result in reducing this accretion rate by a factor of 2.5 to
about 0.06 M⊙year-1. Plausible variations in kT
would only have a minor effect; Chandra observations do not find
dramatic cooling in galaxy cores (e.g. Kim & Fabbiano 2002,
David et al. 2001, Kaastra et al. 2001).
The above accretion rate is similar to the accretion rates required to power high luminosity quasars. The Eddington luminosity for the black hole mass in IC1459 is of order 2.5 ergs s-1, while the observed luminosity is 3 times lower. If the efficiency of the accretion flow was , as generally assumed in the standard accretion disk theory, then the luminosity of IC1459 would be in the range ergs s-1, a normal AGN luminosity. So why is the observed luminosity so low?
Assuming steady accretion, the radiative efficiency, where is the observed luminosity of the nucleus. For Laccr=7.9 ergs s-1 and =0.16 M⊙ year-1 we obtain . This efficiency is much lower than in the standard accretion onto black hole scenario. In the following sections we discuss possible ways of explaining the observed luminosity: (1) hiding the emission, with gas and dust, (2) impeding the accretion into the black hole, (3) using inherently low radiative efficiency processes, (4) removing energy from the power available for radiation losses, e.g. in a jet.
4.2 Hiding the Emission: Obscuration
Does the ‘missing’ luminosity come out at different wavelengths? We can search for obscuration effects both from the X-ray spectrum, and by considering the complete SED of IC 1459.
There is no strong photoelectric absorption signature at low energies in the X-ray spectrum. To suppress the X-ray spectrum by a factor 100 requires a column density, N1023cm-2, and such values are seen in AGN known to be heavily obscured (e.g. NGC 1068, Ueno et al. 1994; Circinus, Matt et al. 1999). The absence of strong low energy absorption however is not sufficient to conclude that obscuration is not at work. In some cases the direct spectrum is completely obscured, and only a small scattered fraction can be seen (NGC 1068, Circinus). In all these cases though, the scattered spectrum contains strong fluorescent emission lines, notably of Fe-K at 6.4 keV, with EW1 keV. This is excluded by the 382 eV 3 upper limit on Fe-K in the Chandra spectrum.
Obscuration would be in agreement with our X-ray results, if the nucleus were embedded in a thick spherical dust distribution, that would let escape only a very small amount of the emitted power. An irregular dust distribution is present in the nuclear region of IC 1459 (Goudfrooij et al., 1990). Although on average this provides too little reddening [E(B-V)=0.07, or 41020cm-2 for standard dust to gas ratio and composition] to hide an AGN, the obscuration could well be much greater near the nucleus (Tomita et al. 2000). In this case, however, we would expect to see the ‘missing’ luminosity in the infrared. Within a 5 arcsecond aperture the SED distribution in the 1-10m IR (figure 6) follows a Rayleigh-Jeans tail quite closely and is likely to be stellar. If the large beam IRAS 10-100m FIR emission were nuclear dust emission, as argued by Walsh et al. (1990) on the basis of a lack of 21 cm HI line emission, this would not account for the sub-Bondi X-ray luminosity, since the total FIR luminosity is 60 times the observed X-ray luminosity, not the factor 7500 required.
4.3 Impeding Accretion
Bondi theory applies to spherical accretion. However, the accreting gas can have a significant amount of angular momentum. The gravitational capture radius for IC1459 is at 140 pc = 7.4. A standard disk is gravitationally unstable at large radii ( a few 1000). So there is a factor 100 difference in radius between where we have measured Ṁ to where any disk could be. Formation of an accretion disk from a spherical flow is not well understood as yet, but depends on the angular momentum and the temperature of the gas at the gravitational capture radius. Igumenshchev, Illarionov & Abramowicz (1999) simulated an accretion flow with low angular momentum accreting matter and show that the matter condenses into a cool thin disk. So a two component (hot and cold) plasma can exist in the vicinity of the black hole. The size of the cold thin disk is smaller at higher accretion rates. The hot plasma surrounds the disk and extends up to the outer gravitational capture radius. The accretion rates in the cold and hot phase are likely to be different, although no calculations exist. Hawley and Balbus (2002) provide a dynamical picture of the 3D non-radiative accretion flow, where the flow has three well defined components: a hot, thick Keplerian disk, surrounding a magnetized corona with circulation and outflow, and a magnetically confined jet. The accretion disk is very hot and forms a toroidal structure in the innermost (r) regions. They estimated the energy output for this model and found consistency in the case of SgrA* data. However, their simulations do not include any radiation processes and are only run within the central few hundred , well inside the Bondi radius.
The accretion flow geometry depends on the physical conditions of the matter in the region where the gas starts to be influenced by the black hole. Abramowicz & Zurek (1981) discussed the geometry of the adiabatic accretion flow and show that for sufficiently high angular momentum the flow forms a disk-like pattern, while quasi-spherical transonic accretion flow is possible for the matter with small angular momentum. Similar results of bimodal geometry were recently discussed by Yuan (1999), who shows that the outer boundary conditions (e.g. gas temperature, velocity, angular momentum) are critical to the type of the accretion pattern in the viscous, optically thin flow. The accretion rate could be then significantly less than the Bondi rate if the accreting gas has a significant amount of angular momentum. This could result in inefficient accretion at the Bondi gravitational capture radius . Even if Bondi accretion is effective, angular momentum could stop the flow closer in, if a disk forms and angular momentum cannot be transferred effectively outwards. Removing angular momentum from gas at 10 pc is a longstanding problem in fueling AGN (Blandford 1990), so stalling accretion at or near the Bondi radius is not hard.
Assuming that the gas can reach accretion disk-like radii (10, 1 pc, where is the Schwarzschild radius, for ), there are several ways to inhibit accretion. Two types of accretion disk could form near the black hole: standard optically-thick geometrically-thin disks, or optically-thin thick disks (advection dominated accretion flows, so-called ADAF). Standard thin accretion disks can be thermally and viscously unstable and undergo irregular outbursts (Lin & Shields 1986, Mineshige & Shields 1990, Siemiginowska, Czerny & Kostyunin 1996) leading to quiescent periods with low accretion efficiency. In the ADAF family (discussed in §4.4), convection dominated accretion flows (CDAFs, Quataert, E., & Gruzinov, 2000, and reference therein) also stall accretion at small radii by convecting the material back out to larger radii. Again this is a temporary effect, although how long a CDAF can prevent accretion has not yet been studied. Advection dominated inflow/outflows solutions (ADIOS, Blandford & Begelman 1999) also prevent accretion in the inner regions, but do so by removing matter from the inflow completely via a polar outflow. Thus an ADIOS may be one mechanism of pairing a radiatively inefficient accretion flow to the origin of AGN jets (see Yuan, Markoff & Falcke 2002 for a discussion relevant to Sgr A*).
4.4 Low Radiative Efficiency Models
Radiatively inefficient scenarios include ‘advection dominated accretion flows’ (ADAFs), ‘convection dominated accretion flows’ (CDAFs), or ‘advection dominated inflow outflow solutions’ (ADIOS) (see review by Narayan 2002), in all of which the matter in the center becomes so hot and tenuous that it is unable to radiate strongly. In pure inflow ADAFs much of the energy is carried by the less radiative protons and advected inside the event horizon. In ADIOS (Blandford & Begelman, 1999) the matter flows outward before cooling (possibly radiating, via magnetic fields, as a jet). In CDAFs (Begelman & Meier 1982) the matter convects back out to larger radii. Variations of these models have had success accounting for the spectra of low-luminosity AGN, such as the quiescent state of the nucleus of our spiral galaxy, Sgr A* (see review of models in Melia & Falcke 2001).
ADAFs have also been invoked to explain the SED of the nuclei of similar elliptical galaxies, which have hard X-ray sources (L1040erg s-1) strong inverted spectrum radio sources, but no non-stellar optical continuum (e.g. NGC 1399, M 87, Allen, Di Matteo & Fabian, 2000; Di Matteo et al. 2000). However these consistently overpredict the observed radio emission in normal, weak radio, ellipticals (Lowenstein et al. 2001, Di Matteo, Carilli & Fabian 2001).
In IC 1459 we can exclude that the X-ray emission is dominated by a pure bremsstrahlung in a pure inflow, low accretion rate, ADAF (Narayan & Yi 1994, 1995), since that would have a flat X-ray power-law () and no Fe-K line. While no Fe-K line is seen in the Chandra spectrum, the slope is steeper than expected (=1.880.09, Table 2). The steep power-law is consistent with the prediction of the ADAF model for higher accretion rates, comparable to those we estimate for IC 1459. In this case, an X-ray component from Comptonized radio synchrotron emission is generated (Esin et al. 1998), as for example has been suggested in the case of M87 (Di Matteo et al 2001). Also, convection dominated accretion flows (CDAFs) give 1.6-2.0 for the LX/L10-7 value we see in IC 1459 (Ball, Narayan & Quataert 2001).
However, following the argument by Pellegrini et al (2003) for IC 4296, a pure inflow ADAF model cannot explain the entire radio-to-X-ray nuclear emission of IC 1459. M 87 and IC 1459 have comparable M∙ and Ṁ, the two primary ADAF variables, so a comparison of their SEDs is instructive. The ratio of X-ray to radio emission is well constrained in these models ((1 keV)(22 GHz)60 in M87 (Di Matteo et al 2002). In IC 1459 the ratio is significantly smaller, (1 keV)(22 GHz)3 (fig. 6), so the ADAF predicted radio emission would be much less than observed. Even larger X-ray/radio ratios would be expected for CDAF and ADIOS models (Quataert and Narayan 1999). This does not exclude the possibility of an ADAF or CDAF as the origin of the X-ray emission, but in all these cases a different source, for example jets, would be required to explain the radio. This would be consistent with the surveys of low-luminosity AGN, which suggest that the jet is dominating at least the radio emission in these systems (Nagar, Wilson & Falcke 2001).
4.5 A Jet-Disk Model for the non-thermal X-ray/radio Continuum
We have fitted the jet model of Markoff et al. (2001, 2003) to the SED for IC 1459. The details of the model can be found in these papers, and references therein, so we give only a brief summary below.
The basic idea of this model is that a fraction of neutral electron-proton plasma from the accretion flow is advected into a jet, which is freely expanding and accelerated via its longitudinal pressure gradient. Eventually, the plasma encounters an acceleration region (assumed for simplicity to be a shock) and some of the thermal plasma is redistributed into a power-law distribution. The main fitted parameters are the power in the jet, characterized as a fraction of the Eddington power, the location where the acceleration zone begins, the energy index of the accelerated electrons and the inclination angle. A multi-color blackbody thin accretion disk (Shakura & Sunyaev 1973; Mitsuda et al. 1984) is assumed to contribute both to the spectrum directly, as well provide a photon field for inverse Compton upscattering by the jet plasma. This disk is parameterized by its inner temperature and its thermal luminosity in Eddington units. The thermal disk spectrum as well as synchrotron, synchrotron self-Compton (SSC) and external (disk) Compton (EC) emission from the jet are all calculated.
The resulting fit is shown in fig. 7, and the fitted model parameters are given in Table 5. The post-shock synchrotron spectrum fit to the radio continuum is good to factors of 2. The extrapolation of the optically thin part of this post-shock synchrotron spectrum fits both the X-ray slope and normalization notably well. The pre-shock synchrotron emission fits the 2 mm to 60 m peak, with the shorter wavelength IR emission being assumed to come from dust in the body of the galaxy, as evidenced by the large fraction of the 10 m emission coming from outside a 5 arcsec aperture. The HST optical photometry of the nucleus is fitted by a cool accretion disk.
The two bumps in the Compton component (see fig. 7) come from SSC within the nozzle plus EC from the weak disk blackbody. The synchrotron power law comes from much further out, 700 , and so is not as strongly upscattered. The joint SSC/EC component cuts out at low frequencies because, for computational efficiency, this component is only calculated out to where it becomes too low to matter, a few 100 times the nozzle length.
Interestingly, the location of the shock region falls exactly in the range that Markoff, Falcke & Fender (2001) and Markoff et al. (2003) have been finding for X-ray binaries (), and is also consistent with values found for BL Lacs (e.g. Beckmann et al. 2002). This suggests that there may be commonality in the location of the acceleration region even for jets of vastly different scales.
There may well be other sources of EC emission, e.g. another source of external photons to be Compton scattered, such as the broad emission lines, or a hotter disk (see below). The X-rays may well be then a varying mix of synchrotron and EC at different energies, with synchrotron being more important at low energies.
While the blackbody disk component produces only about 10 in luminosity, the jet carries 10 in kinetic and internal particle and magnetic field energy in this model. I.e. the jet is by far the dominant sink of power, although only a small fraction (3%, 7.610) is radiated away. A small caveat is that, since the X-ray slope is rising in , the X-ray power radiated depends on the maximum cutoff for the synchrotron emission. But this is unlikely to increase the radiated fraction substantially. Also, the total jet power is somewhat dependent on the inclination angle assumed, because of beaming. If the inclination angle were closer to 60 degrees, then the total jet power required to fit the spectrum would be a larger fraction, but never more than 20-30%. For this fit the total jet power is then 10% of the Bondi rate (2.2510-3 LEdd), i.e. =0.1. This is a much larger fraction of LEdd than had been thought from estimates based only on radiative power, but is in line with the values of 0.1 - 0.001 found for models of Galactic binaries (Markoff et al. 2001, 2003). This suggests that the Bondi rate is a more realistic estimate of the accretion rate than had been claimed.
This brings up two interesting points. First, these results seem to support the recent findings of, e.g., Nagar, Wilson & Falcke (2001), whose surveys are discovering that jets seem capable of dominating the disk emission in low-luminosity systems. This is also seen in the high ratio of jet to radiated power required in the Yuan, Markoff & Falcke (2002) model for Sgr A*, where they built a self-consistent jet-ADAF solution. In this model, the spectrum is mostly jet dominated, with comparable disk and jet contributions in the X-ray and only a small optical/UV disk component. The same team’s model for NGC4258 (Yuan et al. 2002) is also jet-dominated, but requires a quite different approach because of the need for a stronger shock to explain the more powerful emission. The low X-ray luminosity of IC 1459 compared to the bright radio seems to be consistent with the idea that this source is a low-luminosity AGN.
Second, this model suggests that some of the ṀBondi could in fact be re-ejected in the form of a jet. This would be one explanation for the preponderance of strong jets in low-luminosity systems, and is supported by theoretical models and simulations. For example, Livio, Ogilvie & Pringle (1999) have argued that the Blandford-Znajek mechanism may be enhanced by additional poloidal field advection in ADAFs. This is similar to the conclusions of Meier (2001), who finds jet production preferentially occurs in geometrically thick accretion flows (i.e., ADAF/CDAF-like). Thus, a weak disk may actually argue for a stronger jet, as supported by the recent studies of both stellar and galactic low-luminosity systems.
If there is accretion at the Bondi rate, and ṀBondi is processed through a standard accretion disk, then the maximum disk temperature would be 25,600 K. However, the disk fit of §4.5 is cool (7000 K). This implies a smaller Ṁ=1.610 yr-1 and hence an unphysical =10. This rules out accretion through the 7000 K disk as the sole energy source for the jet, leaving quasi-spherical accretion, or black hole spin energy (Blandford & Znajek 1977) as the remaining possibilities. The low Ṁ derived for the disk may be misleading, since the AGN-like blue HST V-R color is consistent with a 25000 K disk. Better UV data are needed to determine the maximum disk temperature, and so tie the disk and jet physics together more closely.
The presence of H implies the presence of Lyman continuum photons, though the amount depends on the covering factor of the H producing gas to the continuum source, . This UV continuum could be provided either by an absorbed disk, or by the jet itself. The combined inverse Compton component and post-shock synchrotron component (which connects the X-ray to the high frequency radio emission) imply a Lyman continuum flux of 10-12 erg cm-2 s-1. The agreement of the H/X-ray ratio in IC 1459 with those in normal AGN is then surprising, since in those objects the Lyman continuum is thought to come from a hot disk, while the X-rays probably arise in a disk corona (Haardt & Maraschi 1991, Nayakshin 2000). It may be that a jet component should be reconsidered in the more normal AGN also.
5 Conclusions
We have presented Chandra observations of the nucleus of IC 1459, a nearby (D=22 Mpc) elliptical galaxy with a measured nuclear black hole mass of 2109M⊙. These observations clearly separate out a weak (=81040erg s-1, 0.3-8 keV), unabsorbed nuclear X-ray source, with a slope = 1.880.09, and no strong Fe-K line at 6.4 keV (EW382 eV). This describes a normal AGN X-ray spectrum, but lies at 310-7 below the Eddington limit. The SED of the IC 1459 nucleus is extremely radio loud compared to normal radio-loud quasars.
The nucleus is surrounded by hot ISM (kT0.5-0.6 keV). We measure an average density of this ISM of 0.31 cm-3 within the central 1.7 arcsec radius (182 pc). The Bondi gravitational capture radius is 140 pc. (Although this could be resolved with Chandra, the nuclear source prevents this measurement, so we do not have a direct measure of the ISM density at the Bondi radius.) Using these gas parameters we find the accretion rate at the gravitational capture radius, and derive the luminosity if the accretion efficiency is at 10 Lacc61044 erg s-1. Even allowing for factors of a few uncertainties, Lacc is orders of magnitude higher than .
We consider various possible explanations for this discrepancy:
(1) Obscuration. Scattering from a standard torus would produce a strong Fe-K fluorescence line that is not seen. An alternative 4 covering obscurer with small holes is ruled out by the weakness of the nuclear infrared emission.
(2) Angular momentum impeded accretion. Sufficiently high resolution hydrodynamic modelling of low angular momentum accretion flows does not yet exist, however the indications are that this would form a disk. Since there are no predictions for the resulting SED we cannot take this possibility further as yet.
(3) ADAF solutions. These can explain the X-ray spectrum, but have trouble with the high radio/X-ray ratio in IC 1459, which is much larger than in normal ellipticals, or even M 87. Quite possibly an ADAF like solution leads to jet creation (ADIOS), which we considered next.
(4) Jet models. We find that the jet model fits the radio-100m and X-ray spectra extremely well. The total power in this jet is much larger than the radiated luminosity, and amounts to 10% of Lacc. Accretion close to the Bondi rate is then needed. The model fitting uses a cool (7000 K) accretion disk, which does not give a high enrough accretion rate to power the jet. The the disk may be hotter, and better UV data could determine this. If this is not the case the jet must be powered by quasi-spherical accretion, or potentially by the black hole spin energy.
References
- AZ (81) Abramowicz M. & Zurek J., 1981, ApJ 246, 314
- A (95) Abramowicz M.A., Chen X., Kato S., Lasota J.-P., Regev O., 1995, ApJ 438, L37
- A (00) Allen S.W., Di Matteo R. & Fabian A.C., 2000, MNRAS, 311, 493
- Amram et al. (1992) Amram, P., Marcelin, M., Boulesteix, J., & le Coarer, E. 1992, A&A, 266, 106
- BH (91) Balbus S.A. & Hawley J.F., 1991, ApJ, 376, 214
- BNQ (01) Ball G.H., Narayan R. & Quataert E., 2001, ApJ, 552, 221
- B (02) Beckmann V., Wolter A., Celotti A., Costamante L., Ghisellini G., Maccacaro T., Tagliaferri G., 2002, A& A, 383, 410
- BM (82) Begelman, M.C., Meier, D.L., 1982, ApJ 253, 873
- BBF (92) Bender R., Burstein D. & Faber S.M., 1992, ApJ 399, 462
- BT (85) Binney J.J., & Tabor G. 1995, MNRAS 276, 663,
- B (90) Blandford R. D., 1990, in “Active Galactic Nuclei”, Saas-Fee Advanced Course 20 [Springer-Verlag], 161
- BB (99) Blandford R.D. & Begelman M.C., 1999, MNRAS, 303, L1
- BZ (77) Blandford R.D. & Znajek R.L., 1977, MNRAS, 179, 433
- B (52) Bondi H., 1952, MNRAS, 112, 195
- BKS (98) Burderi L., King A.R. & Szuszkiewicz E., 1998, ApJ, 509, 85
- CAPP (02) Cappellari M., Verolme E.K., van der Marel R.P., Verdoes Kleijn G.A., Illingworth G.D., Franx M., Carollo C.M. & de Zeeuw P.T., 2002, ApJ, 578, 787
- C (97) Carollo C.M., Franx M., Illingworth G.D. & Forbes D.A., 1997, ApJ, 481, 710
- CO (97) Ciotti L., & Ostriker J.P. 2001, ApJ 551, 131
- POG (01) Chandra Proposers’ Observatory Guide, 2001, Chandra X-ray Center, TD 403.00.004
- dG (85) de Grijp M.H.K., Miley G.K., Lub J. & de Jong T., 1985, Nature, 314, 240
- DM (00) Di Matteo T., Quataert E., Allen S.W., Narayan R., Fabian, A. C., 2000, MNRAS, 311, 507
- DM (01) Di Matteo T., Carilli C. & Fabian A.C., 2001, ApJ 547, 731
- DM (02) Di Matteo T., Allen S.W., Fabian A.C., Wilson A.S. & Young A.J., 2002, ApJ, in press. astro-ph/0202238
- D (97) David L.P., Nulsen P.E.J., McNamara B.R., Forman W., Jones C., Ponman T., Robertson, B., Wise, M., 2001, ApJ, 557, 546
- D (97) Drinkwater M.J. et al. 1997, MNRAS 284, 85.
- E (89) Ekers R., et al., 1989, MNRAS, 236, 737
- E (78) Elvis M., Maccacaro T., Wilson A.S., Ward M.J., Penston M.V., Fosbury R.A.E. & Perola G.C., 1978, MNRAS 183, 129
- E (94) Elvis M. et al., 1994, ApJS, 95, 1
- E (97) Esin, A.A., McClintock J.E., Narayan R., 1997, ApJ 489, 865
- E (98) Esin, A.A., Narayan, R., Ciu W., et al 1998, ApJ 505, 854
- FKT (92) Fabbiano G., Kim D.-W. & Trinchieri G., 1992, ApJ, ApJS, 80, 531
- (32) Fabian A.C. & Canizares C.R., 1988, Nature, 333, 829
- FM (00) Ferrarese L. & Merrit D., 2000, ApJ 539, L9
- FKR (92) Frank J., King A. & Raine D., 1992, Accretion Power in Astrophysics [Cambridge: CUP]
- FIH (98) Franx M., Illingworth G. & Heckman T., 1998 AJ 98, 538.
- FI (88) Franx M. & Illingworth G.D., 1988, ApJL 327, L55
- F (98) Franx M., Illingworth G. & Heckman T., 1998 AJ 98, 538
- GM (98) Gammie C.F. & Menou K., 1998, ApJ 492, 75
- FM (00) Gebhardt K. et al., 2000, ApJL, 539, L13
- J (87) Goudfouij P. et al. 1990, A&A 228, L9
- G (01) Graham et al., 2001, ApJ, 563, L11
- Hawley & Balbus (2002) Hawley, J. F. & Balbus, S. A. 2002, ApJ, 573, 738
- HM (91) Haardt F., Maraschi L., 1991, ApJ, 380, 51
- H (01) Ho L., et al. 2001, ApJL 549, L51
- I (96) Igumenshchev, I.V., Chen, X., Abramowicz, M.A, 1996, MNRAS, 278, 236
- I (99) Igumenshchev, I.V. and Abramowicz, M.A., 1999, MNRAS, 303, 309
- (47) Igumenshchev, I.V., Illarionov, A.F. & Abramowicz, M.A. 1999, ApJ, 517, L55
- ES (97) Hatziminiaglou E., Siemiginowska A. & Elvis M., 2001, ApJ, 547, 90
- HB (02) Hawley J.F. & Balbus S.A., 2002, ApJ, 573, 738
- J (87) Jura M., Kim D.-W., Knapp G.R. & Guhathakurta P., 1987, ApJL, 312, L11
- J (87) Kaastra J.S., Ferrigno C., Tamura T., Paerels F.B.S., Peterson J.R., Mittaz J.P.D., 2001, A& A, 3665, L99
- KF (02) Kim D., & Fabbiano G., 2002, ApJ in press. astro-ph/0206369
- KP (91) Knapp G.R. & Patten B.M., 1991 AJ 101,1609
- (54) Liedahl, D.A., Osterheld, A.L., and Goldstein, W.H. 1995, ApJL, 438, 115
- (55) Livio M., Ogilvie G. I., & Pringle J. E. 1999, ApJ, 512, 100
- L (01) Lowenstein M., Mushotzky R.F., Angelini L., Arnaud K.A., Quataert E., 2001, ApJLett, 555, L21.
- LS (86) Lin & Shields G., 1986, ApJ, 305, 28,
- M (968) Macchetto F., Pastoriza M., Caon N., Sparks W.B., Giavalisco M., Bender R. & Capaccioli M., 1996m, A&ASupp, 120, 463
- M (98) Magorrian et al 1998, AJ, 115, 2285,
- M (99) Matt G., et al. 1999, A& A, 341, L39
- M (01) Markoff, S., Falcke, H., Yuan, F. and Biermann, P.L. 2001, A& A, 379, L13
- M (01) Markoff S., Falcke H., Fender R. 2001, A&A, 372, L25
- M (02) Markoff, S., Nowak, M., Corbel, S., Fender R., & Falcke H., 2003, A & A, 397, 645
- M (97) Matsumoto H., Koyama K., Awaki H., Tsuru T., Loewenstein M., Matsushita K., 1997, ApJ, 482, 133
- Mc (83) McAlary C.W., McLaren R.A., McGonegal R.J. & Maza J., 1983, ApJS, 52, 341.
- (66) Meier, D. L. 2001, ApJ, 548, L9
- (67) Melia, F. & Falcke, H. 2001, ARA& A, 39, 309
- (68) Menou K. & Quataert E., 2001, ApJ, 552, 204
- MMH (94) Meyer F. & Meyer-Hofmeister E., 1994, A&A, 288, 175
- MMH (02) Meyer F. & Meyer-Hofmeister E., 2002, A&A 392, 5
- MS (90) Mineshige S. & Shields G., 1990, ApJ. 351, 47,
- MI (84) Mitsuda K., Inoue H., Koyama K., et al. 1984, PASJ, 36, 741
- NWF (01) Nagar N. M., Wilson A. S., & Falcke H. 2001, ApJ, 559, L87
- N (02) Narayan R., 2002, in ”Lighthouses of the Universe” eds. M. Gilfanov, R. Sunyaev et al. [Springer-Verlag] astro-ph/0201260
- NY (94) Narayan R., & Yi, I., 1994, ApJ 428, L13
- NY (95) Narayan R., & Yi, I., 1995, ApJ, 444, 231
- O (89) Osterbrock D.E., 1989, Astrophysics of Gaseous Nebulae and Active Galactic Nuclei, [Univ. Sci. Books, Mill Valley]
- NIA (00) Narayan, R., Igumenshchev, I.V., Abramowicz, M.A., 2000, ApJ 539, 798
- N (00) Nayakshin S., 2000, ApJ, 540, 37
- P (02) Pellegrini S., Venturi T., Comastri A., Fabbiano G., Fiore F., Vignali C., Morganti R., Trinchieri G., 2003, ApJ in press.
- P (86) Phillips M.M., Jenkins C.R., Dopita M.A., Sadler E.M., Binette L., 1986, AJ, 91,1062
- P (88) Poulain P. 1988 A&AS, 72, 215.
- QN (99) Quataert E. & Narayan R., 1999, ApJ 520, 298
- QG (00) Quataert E. & Gruzinov, 2000, ApJ, 539, 809
- R (98) Richstone D., et al. 1998, Nature, 395, 14
- RC (00) Rożańska A. & Czerny B. 2000, A & A 360, 1170
- SS (73) Shakura N.I. & Sunyaev R.A, 1973, A&A 24, 337
- S (02) Siemiginowska A., 2002, in preparation.
- S (96) Siemiginowska A., Czerny B. 2002, in preparation
- S (96) Siemiginowska A., Czerny B. & Kostyunin 1996, ApJ, 458, 491
- ES (97) Siemiginowska A. & Elvis M., 1997, ApJ Letters, 482, L9
- S (94) Slee O.B. Sadler E.M., Reynolds J.E. & Ekers R.D., 1994, MNRAS 269, 928
- S (86) Sparks W.B., Hough J.H., Axon D.J. & Bailey J. 1986 MNRAS, 218,429
- S (92) Stark A.A., Gammie C.F., Wilson R.W., Bally J., Linke R.A., Heiles C. & Hurwitz M., 1992, ApJS, 79, 77
- S (99) Stone, J.M., Pringle, J.E., Begelman, M.C., 1999, MNRAS, 310, 1002
- TOM (00) Tomita A., Aoki K., Watanabe M., Takata T. & Ichikawa S.-I., 2000, ApJ, 120, 123
- U (94) Ueno S, Mushotzky R.F., Koyama K, Iwasawa K, Awaki H., Hayashi I., 1994, PASJ, 46, L71
- vdm (99) van der Marel R.P., 1999, AJ, 117, 744
- R (98) Van Speybroeck, L. P., Jerius, D., Edgar, R. J., Gaetz T. J., & Zhao, P. 1997, Proc. SPIE, 3113, 89
- VK (00) Verdoes Kleijn G.A., van der Marel R.P., Carollo C.M. & de Zeeuw P.T., 2000, ApJ, 120, 1221
- VK (02) Verdoes-Kleijn G., Baum S.A., de Zeeuw P.T. & O’Dea C.P., 2002, ApJS, 123, 1334
- W (90) Walsh D.E.P., van Gorkom J.H., Bies W.E., Katz N., Knapp G.R. & Wallington S., 1990, ApJ, 352, 532
- W (00) Weisskopf, M., Tananbaum, H., Van Speybroeck, L., & O’Dell, S. 2000, Proc. SPIE, 4012, 2
- WC (95) Wilson A.S. & Colbert E., 1995, ApJ, 438, 62
- Y (99) Yuan F., 1999, ApJ, 521, L55
- (106) Yuan F., Markoff S. & Falcke H., 2002, ApJ 383, 854
- (107) Yuan F., Markoff S., Falcke H. and Biermann P., 2002, A& A, 391, 139
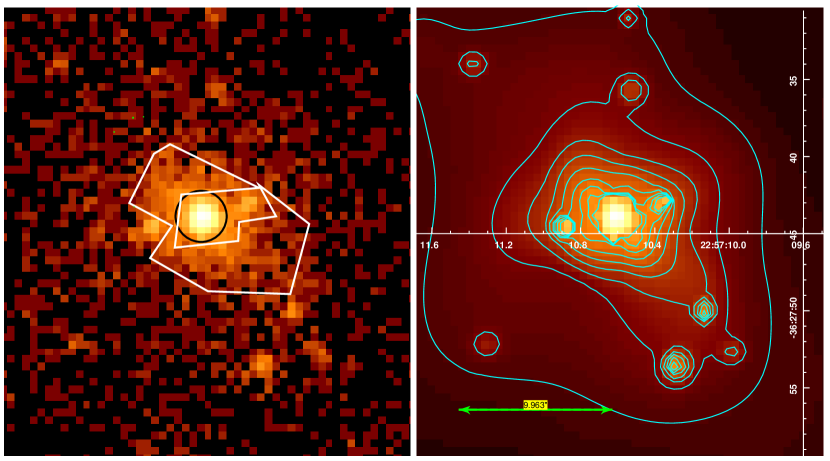
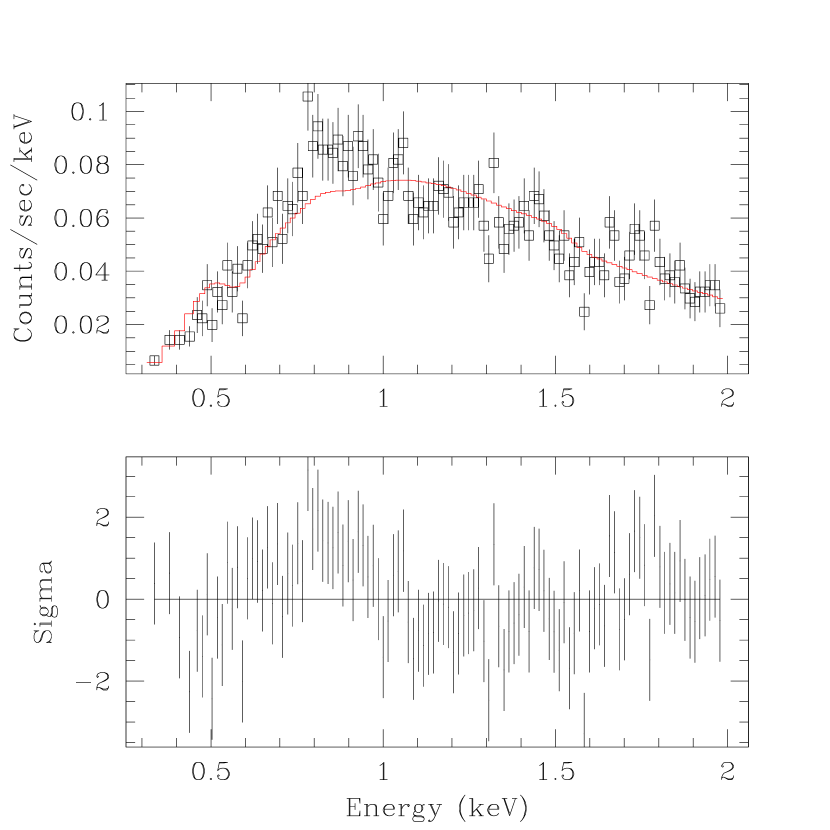
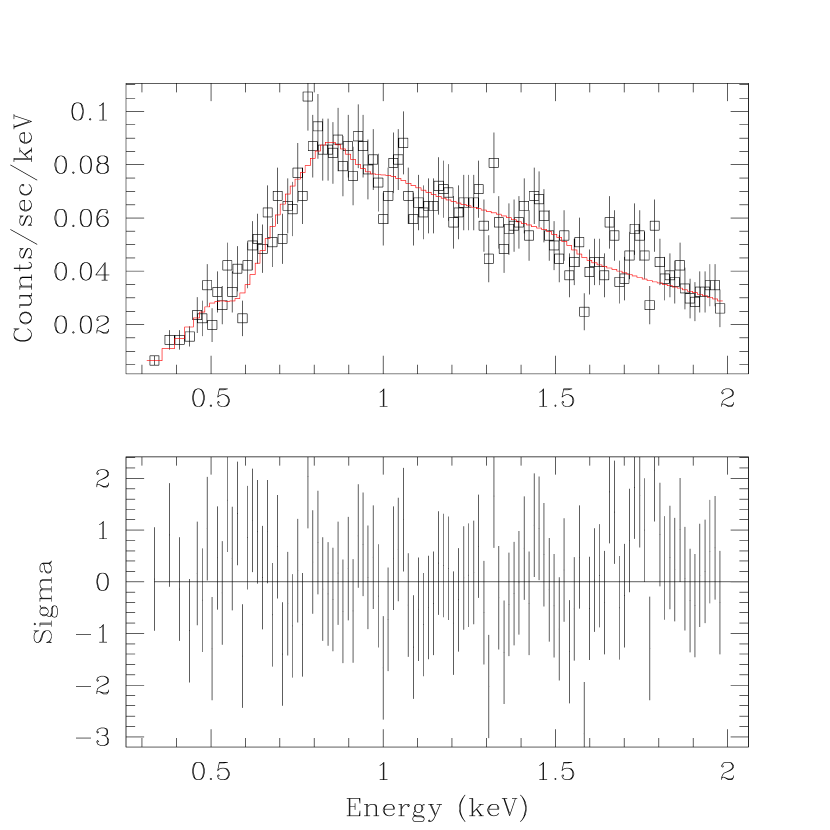
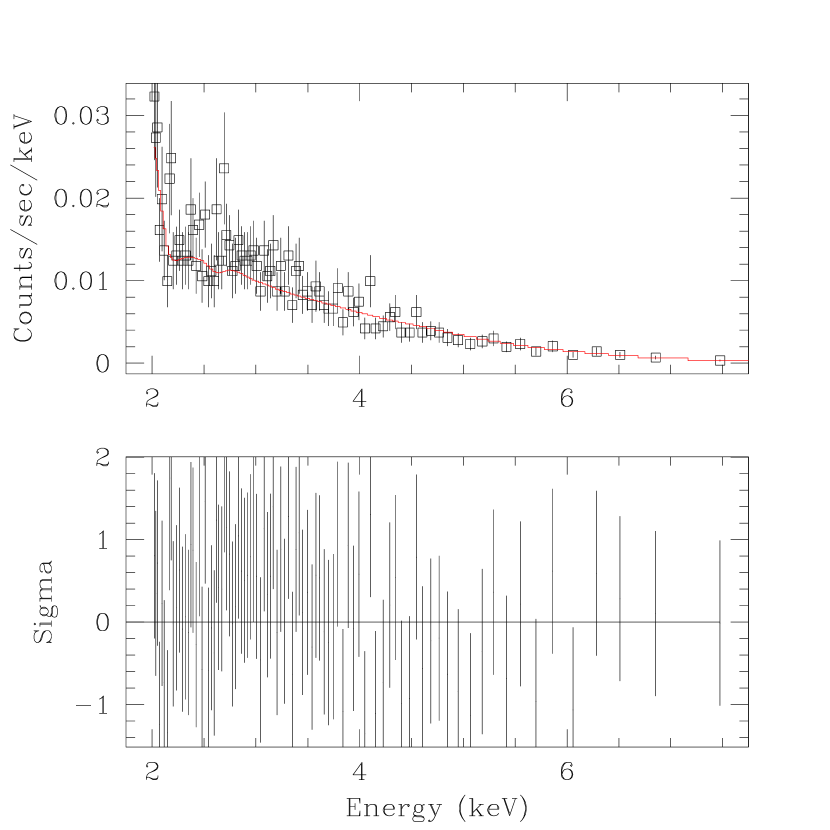


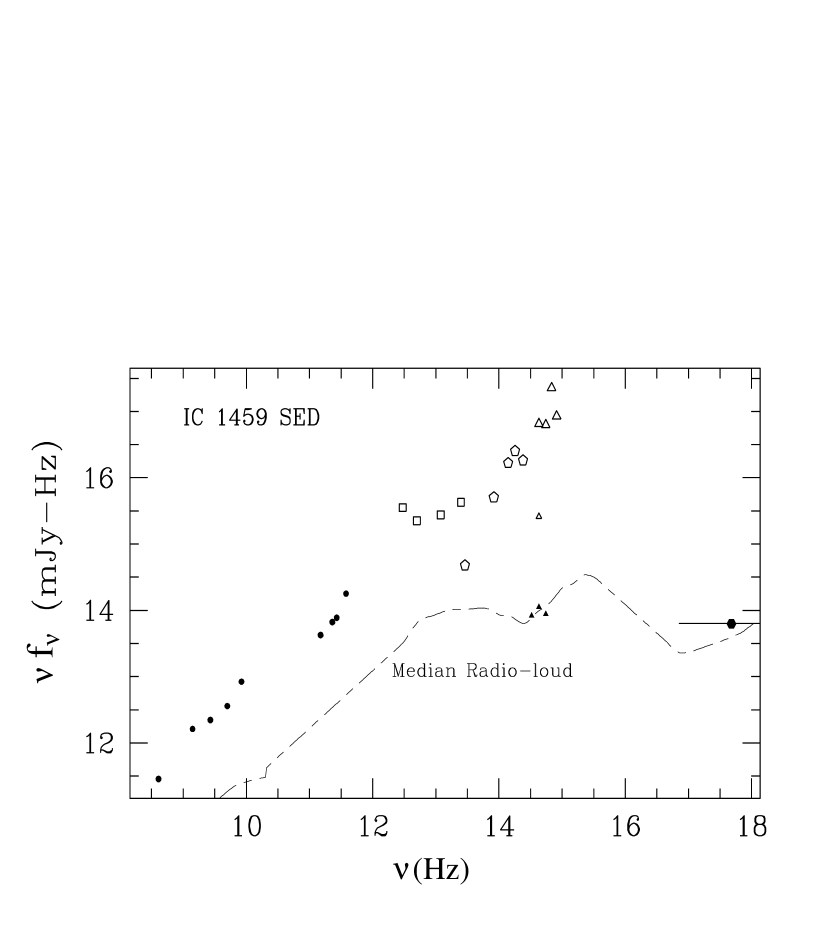

Table 1
IC 1459: Properties and Observation Log
| Time | ObsID | D | Diam. | NH | log | log |
| (ks) | (Mpc) | (’) | (cm2) | () | () | |
| 58.8 | 2196 | 5 | 1.2E20 | 10.9 | 9.3 |
a) log of nuclear massive black hole mass based on stellar kinematics (Cappellari et al 2002, rescaled for D= 22 Mpc; this is a factor of larger than the previous estimate based on gas kinematics by Verdoes Kleijn et al 2000)
b) Distance () from Bender et al (1992). At this distance 1 arcsec correspnds to 107 pc.
Table 2
IC 1459: Nuclear Spectral Parameters and Luminosity
| Model | Parametera | Best-Fit | |||
|---|---|---|---|---|---|
| ( errors) | dof | (ergs cm-2 s-1) | (ergs s | ||
| abs*pl | abs.nh (cm-2) | 194.6 | 13.5 | 7.9 | |
| ( | 195 | ||||
| .pl | 1.94 | ||||
| () | |||||
| norm.pld | 2.3 | ||||
| () | |||||
| abs1*(mekal+abs*pl)e | abs.nh (cm-2) | 155.3 | |||
| (-0.3, +0.6) | 192 | ||||
| .pl | 1.88 | 13.4 | 7.8 | ||
| () | |||||
| norm.pld | |||||
| () | |||||
| kT.mekal (keV) | 0.6 | 0.34 | 0.2 | ||
| (-0.13, +0.10) | |||||
| norm.mekalf | |||||
| () |
a) These are the fit parameters that were allowed to vary
b) In the restricted (0.3-1.3) keV range, = 78/59 for abs*pl and 38/57 for abs1*(mekal+abs*pl), where ‘dof’ is the number of degrees of freedom in the fit.
c) In the (0.3-8) keV range. Flux is at the source unabsorbed. Luminosity is calculated for D=22 Mpc.
d) Units are photons keV-1 cm-2 s at 1 keV
e) abs1.nh was set to , the Galactic line of sight NH. The mekal parameter nh was frozen to the default value of 1; the mekal abundance was assumed solar (frozen to 1).
f) norm.mekal = * (emission measure)
Table 3
IC 1459: Spectral Parameters of the Diffuse Emission
| Model | Parametera | Best-Fit | |
| () | dof | ||
| abs*(mekal+pl)b | .pl | 1.6 | 50.7 |
| () | 42 | ||
| norm.pl | |||
| () | |||
| kT.mekal (keV) | 0.56 | ||
| (-0.07, +0.06) | |||
| norm.mekalc | |||
| () |
a) These are the fit parameters that were allowed to vary
b) abs1.nh was set to , the Galactic line of sight NH (Stark et al. 1992). See Table 2 for default frozen mekal parameters.
c) norm.mekal = * (emission measure)
Table 4
SED for IC 1459
| frequency(Hz) | band | f(mJy) | aperture (”) | ref | |
|---|---|---|---|---|---|
| 4.8e17 | 2 keV | 1.3e-4 | 0 | 2 | this paper |
| 8.2e14 | U | 103 | 0 | 31 | 6 |
| 6.8e14 | B | 333 | 0 | 31 | 6 |
| 5.5e14 | V | 114 | 0 | 31 | 6 |
| 5.5e14 | V | 0.16 | 0 | 0.1 | 7 |
| 4.3e14 | R | 0.26 | 0 | 0.1 | 8 |
| 4.3e14 | R | 153 | 0 | 31 | 6 |
| 4.3e14 | R | 6 | 0 | 1 | 5 |
| 3.3e14 | I | 0.25 | 0 | 0.1 | 7 |
| 2.4e14 | J | 76 | 0 | 5 | 1 |
| 1.8e14 | H | 141 | 0 | 5 | 1 |
| 1.4e14 | K | 119 | 0 | 5 | 1 |
| 8.3e13 | L’ | 61 | 0 | 5 | 1 |
| 2.9e13 | N | 16.4 | 12.2 | 5 | 1 |
| 2.5e13 | 12 m | 170 | 29 | 60 | 3 |
| 1.2e13 | 25 m | 230 | 44 | 60 | 3 |
| 5.0e12 | 60 m | 450 | 31 | 60 | 3 |
| 3.0e12 | 100 m | 1180 | 103 | 60 | 3 |
| 3.8e11 | 0.8 mm | 470 | 61 | 17 | 2 |
| 2.7e11 | 1.1 mm | 286 | 30 | 18.5 | 2 |
| 2.3e11 | 1.3 mm | 289 | 19 | 19.5 | 2 |
| 1.5e11 | 2.0 mm | 283 | 80 | 27.5 | 2 |
| 8.4e9 | 8.4 GHz | 1000 | 0 | - | 4 |
| 5.0e9 | 5.0 GHz | 720 | 0 | 0.03 | 9 |
| 2.7e9 | 2.7 GHz | 820 | 0 | - | 4 |
| 1.41e9 | 1.4 GHz | 1151 | 0 | - | 4 |
| 4.08e8 | 408 MHz | 700 | 0 | - | 4 |
references: 1. Sparks W.B. et al., 1986; 2. Knapp G.R. & Patten B.M., 1991 [JCMT]; 3. Jura M. et al. 1987 [IRAS]; 4. PKSCAT90 [via NED], Wright A.E. & Otrupek 1990 (http://www.asc.rssi.ru/mdb/stars/8/8015.htm); 5. Franx M., Illingworth G. & Heckman T., 1998 [HST]; 6. Poulain P. 1988; 7. Carollo et al. 1997. [HST]; 8. Verdoes-Klein et al. 2002. [HST]; 9. Slee et al. 1994. [PKS-Tidbinbilla].
Table 5
Model Fit Parameters
| Parameter | Value |
|---|---|
| Power in jets | 2.810 |
| Accelerated electron energy index | 2.76 |
| Shock location along axis | 700 |
| Inclination angle | 30 degrees |
| Luminosity in blackbody disk | 2.010 |
| Tin for disk blackbody | 7.0103K |