Near-Infrared Photometric Survey of Proto-Planetary Nebula Candidates
Abstract
We present photometric measurements of 78 objects mostly consisting of proto-planetary nebula candidates. Photometric magnitudes are determined by means of imaging and aperture photometry. Unlike the observations with a photometer with a fixed-sized beam, the method of imaging photometry permits accurate derivation of photometric values because the target sources can be correctly identified and confusion with neighboring sources can be easily avoided. Of the 78 sources observed, we report 10 cases in which the source seems to have been misidentified or confused by nearby bright sources. We also present nearly two dozen cases in which the source seems to have indicated a variability which prompts a follow-up monitoring. There are also a few sources that show previously unreported extendedness. In addition, we present band finding charts of the target sources.
1 Introduction
Proto-planetary nebulae (PPNs) are evolved stars of low-to-intermediate initial mass () that are in transition from the asymptotic giant branch (AGB) phase to the planetary nebula (PN) phase of evolution (e.g., Kwok 1993; Iben 1995). These evolved stars have an extended shell of dust and gas surrounding the star, which is formed by mass loss during the AGB phase. Since the AGB mass loss has already ceased (or significantly been weakened) by the beginning of the PPN phase, the circumstellar shell is physically detached from the central star in PPNs. This detached shell of dust acts as a reservoir of thermal infrared (IR) emission, and therefore, PPNs are typically bright in the mid-IR wavelengths and observed as cool IRAS sources.
Meanwhile, the PPN central stars are slightly more evolved than AGB stars, and their spectral types are usually of G to late B. In addition, the detached circumstellar shells of PPN are not as optically thick as the AGB envelopes due to expansion. Therefore, unlike AGB stars, PPNs are often also bright in the optical. This results in the “double-peaked” spectral energy distribution (SED) that is typical of PPNs (van der Veen, Habing, & Geballe, 1989). This characteristic signature of PPNs has been the primary means to identify these highly evolved stars in which optical counterparts are searched at the positions of unidentified cool IRAS sources (Kwok, 1993). Multi-color photometry has also been used to identify PPNs (e.g., Hrivnak, Kwok, & Volk 1989; Fujii, Nakada, & Parthasarathy 2002).
Although PPNs may be bright at the mid-IR and optical, they are not necessarily bright at the near-IR. The detached PPN shells generally have warm ( K) dust grains, and the IR excess tends to peak at the redward of 20 . The near-IR region of the PPN spectrum corresponds to the “trough” of the double-peaked SED structure. It is, however, significantly important to determine the exact SED shapes of PPNs from optical to far-IR by filling the gap at the near-IR.
Recent studies of the PPN shell morphology have shown that there are two types of PPNs (SOLE-toroidal and DUPLEX-core/elliptical types), which are manifestations of distinct physical conditions in the PPN shells (Ueta, Meixner, & Bobrowsky, 2000; Meixner et al., 2002). The optical depth of the shell is the origin of the morphological dichotomy among PPNs, and this dichotomy can also be seen in the SEDs. The SEDs are either fully double-peaked or dominated by the IR excess: the central star suffers from more extinction when surrounded by an optically thicker dust shell. Near-IR photometry helps to classify these PPNs as either DUPLEX or SOLE type (see Figures 6, 7, and 8 in Ueta, Meixner, & Bobrowsky 2000).
Moreover, knowledge of the SED shape is often important in modeling the PPN shells through radiative transfer calculations. The near-IR photometric data define the spectral region corresponding to the redward slope of the optical peak to the trough of the double-peaked SED of PPNs. This part of the SED is critically affected by the basic parameters of the central star (, , and distance) which, of course, would determine the energy budget for dust heating in the shell (Ueta et al., 2001a, b; Meixner et al., 2002). Near-IR emission can also arise from some other means. For example, part of the near-IR excess emission from a PPN, IRAS 22272+5435, has been attributed to a transiently heated hot dust component (Szczerba et al., 1997), which may have been ejected by a sudden post-AGB mass ejection (Hrivnak, Kwok, & Geballe, 1994; Ueta et al., 2001b).
Motivated by the importance of near-IR photometric data for PPNs, we have undertaken a series of observations aiming to obtain accurate near-IR photometry of PPN candidates by means of near-IR imaging. Previous large scale photometric surveys of PPNs used photometers with large beam sizes (8 to 16 by van der Veen, Habing, & Geballe 1989 and 15 by Manchado et al. 1989, García-Lario et al. 1990, and García-Lario et al. 1997) and sources in the crowded field may have been misidentified and/or their photometry inaccurately determined by confusion. This problem has already been addressed in recent near-IR imaging photometric observations for southern post-AGB stars (Van de Steene, van Hoof, & Wood, 2000). We have also looked for a possible near-IR variability for our target sources by observing the same sources at different epochs and also by comparing our results with past measurements.
In this paper, we present near-IR magnitudes in standard , , and bands for mostly northern PPN candidates. Most of the target sources are selected from the list given by Meixner et al. (1999) for which we have obtained mid-IR photometric data and images.
2 Observations and Data Reduction
Near-IR photometric data were taken with the 40 inch telescope at the Mt. Laguna Observatory111Mt. Laguna Observatory is jointly operated by University of Illinois at Urbana-Champaign and San Diego State University. in Southern California using the Near-IR Imager (NIRIM, Meixner, Young Owl, & Leach 1999). NIRIM has a Rockwell NICMOS3 Hg:Cd:Te 256 256 array detector. The pixel scales were set to pixel-1, pixel-1, and pixel-1. While the pixel-1 scale was used by default, we adjusted the plate scale depending on the brightness of the sources not to saturate the pixels or to detect the source with a reasonable amount of exposure time.
The observations were performed during three different runs in 1997 July, 1998 June, and 1999 November. The log of observations is given in Table 1, showing the pixel scale used, weather conditions, and seeing of the night. Weather conditions were excellent during the 1997 and 1998 runs, but somewhat chaotic during the 1999 run. For the “Mostly Clear” and “Clear” nights during the 1999 run, scattered cirrus clouds were seen at low elevation and humidity was slightly higher () than usual () at the observatory. Seeing values listed are the average of the FWHMs of the standard stars at the band when we checked the focus of the telescope several times during the night.
In a typical run, we would observe a half dozen to a dozen target sources when they are at low airmasses (). We would also observe two to three standard stars at least twice during the night at low () and high () airmasses to perform an airmass correction (see below). Table Near-Infrared Photometric Survey of Proto-Planetary Nebula Candidates shows a list of standard stars we used during our observing runs. Data were taken by shifting the telescope with a 9-point grid dithering pattern. Each exposure was flat-fielded to eliminate large pixel-to-pixel sensitivity variations in the detector array. Then, the flat-fielded dithered frames were sky-subtracted before co-added into a single image. Flats were created for each waveband by exposing the twilight sky. We constructed sky emission maps by taking a median of all dithered frames after unusually low and high pixels were masked out. Our reduction method generally follows the method described in McLean & Teplitz (1996).
The correct identification of the target sources is of prime importance in our observations. The near-IR sky does not necessarily look the same as the optical and mid-IR sky, and this may lead to a misidentification of the target sources. Therefore, we identified the near-IR counterparts of the target sources in the following way. First, using the Digital Sky Survey222The Digitized Sky Survey was produced at the Space Telescope Science Institute under U.S. Government grant NAG W-2166. (DSS), we generated optical finding charts of the sources centered at their most precise coordinates available in the literature. Most reliable coordinates ( accuracy) include the values determined by the Hubble Space Telescope observations and observations of bright stars (such as DSS). For those without any confirmed optical counterparts, we used coordinates determined by past mid-IR observations such as our own (Meixner et al. 1999; typically accuracy) and IRAS observations (typically accuracy). Then, we took an band image of a source and compared it to the optical finding chart of the source in order to pinpoint the location of the near-IR counterpart more precisely. Our improved identification for many of the sources comes from translating the source’s optical or mid-IR coordinates into the near-IR coordinates via using the band image. The accuracy of identification is, however, limited by the correctness of the coordinates used, and this we indicate the basis of the coordinates presented in Table Near-Infrared Photometric Survey of Proto-Planetary Nebula Candidates.
The photometry was done using the aperture photometry package, apphot, in IRAF. Once the target is identified, a polygon aperture is defined around the star to measure the analog-to-digital unit (ADU) count within the aperture. Even though the images are already sky-subtracted, residual sky counts can still be measured from a sky annulus defined surrounding the aperture or sky boxes in the blank regions of the image. If the residual sky counts are higher than 5 , we subtracted the total residual sky counts in the aperture polygon from the ADU counts of the source. However, we rarely subtracted the residual sky at this stage.
In order to convert the ADU counts to magnitudes, we have attempted to determine the zero magnitude and the airmass correction factor for each band for each night. Raw ADU counts of the standard stars are converted to raw magnitudes. These raw magnitudes are plotted against airmasses. Ideally, there should be a linear relationship between the raw magnitudes and airmasses, and the airmass correction factor is obtained as a slope of the line fit to the data. Then, the correction factor can be used to obtain the airmass-corrected magnitudes of the standard stars. Given the magnitudes of the standard stars, we derive the zero magnitudes of the instrument for each band for a given night.
However, the raw magnitude versus airmass plot generated from the 1997 and 1998 data sets have failed to yield a linear relationship between the two: the data points are scattered all over the plot. The data points were scattered mainly because there was only a small difference between low and high airmass values, especially for the 1997 data set. We were unable to derive the airmass correction factors for these data sets, and thus, did not apply any airmass correction except for the 1999 data set. This introduced relatively large uncertainties in our determination of the zero magnitudes and propagated into the resulting photometric values. Furthermore, the precision of stellar photometry may be affected by undersampling the point-spread-function (PSF). As clearly demonstrated by Lauer (1999), intrapixel sensitivity variations of NICMOS3 arrays can be as high as 0.39 mag depending on where the peak of the target source lands on the array. Although dithering would reduce the effect, the undersampling of the PSF may contribute to the uncertainties in the 1997 and some of the 1998 data because the PSF was typically relatively smaller with respect to the pixel scale. Since the seeing was generally worse in the 1999 run than the previous runs, the 1999 data seem to have suffered less from the intrapixel sensitivity variations. Overall, the uncertainties of the measurements for the 1999 run are less than those for the 1997 and 1998 runs.
Thus, our results have relatively large uncertainties ( mag) due to these limitations of measurements. The precision of our observations is adequate for fixing the SED, but may not be so for monitoring small photometric variabilities in the near-IR. Our results, nevertheless, improve upon previously published values because our identifications based on imaging are better-suited to identify sources than observations with a large aperture photometer, which are confusion-limited especially in a crowded field. The influence of airmass in our photometric results is considered to be relatively small, since the target sources were observed generally at low airmass (). A typical atmospheric extinction in the band at Mauna Kea is 0.12 mag airmass-1 (Krisciunas et al., 1987). At Mt. Laguna, this value is expected to be larger. Thus, neglecting the airmass correction for low airmass targets can lead to uncertainties of about 0.05 mag. This is still small relative to the uncertainties associated with determining the zero magnitudes.
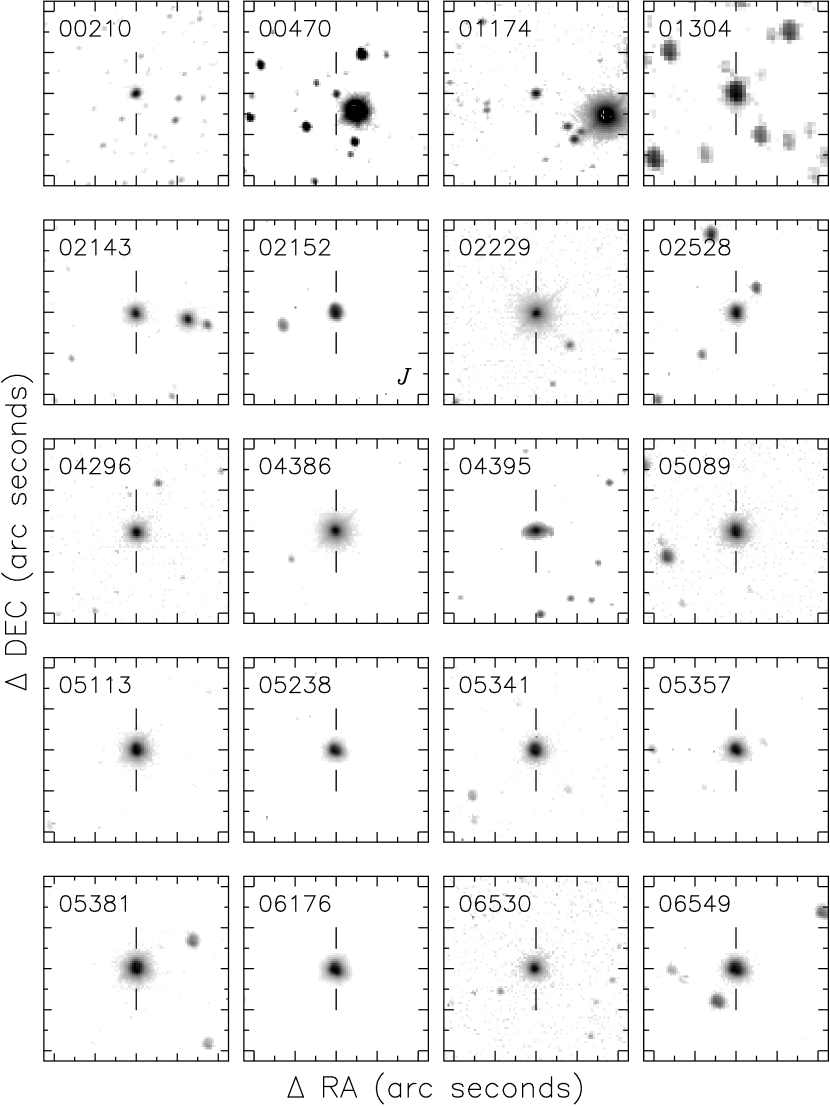
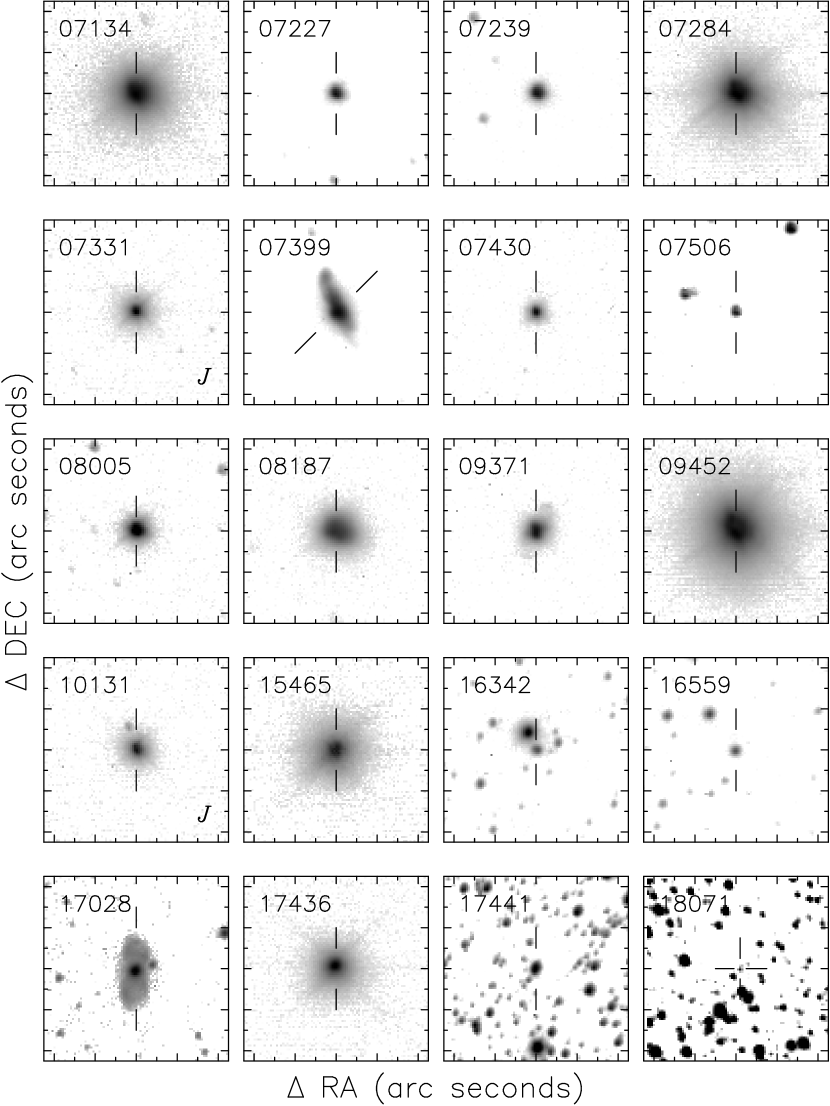
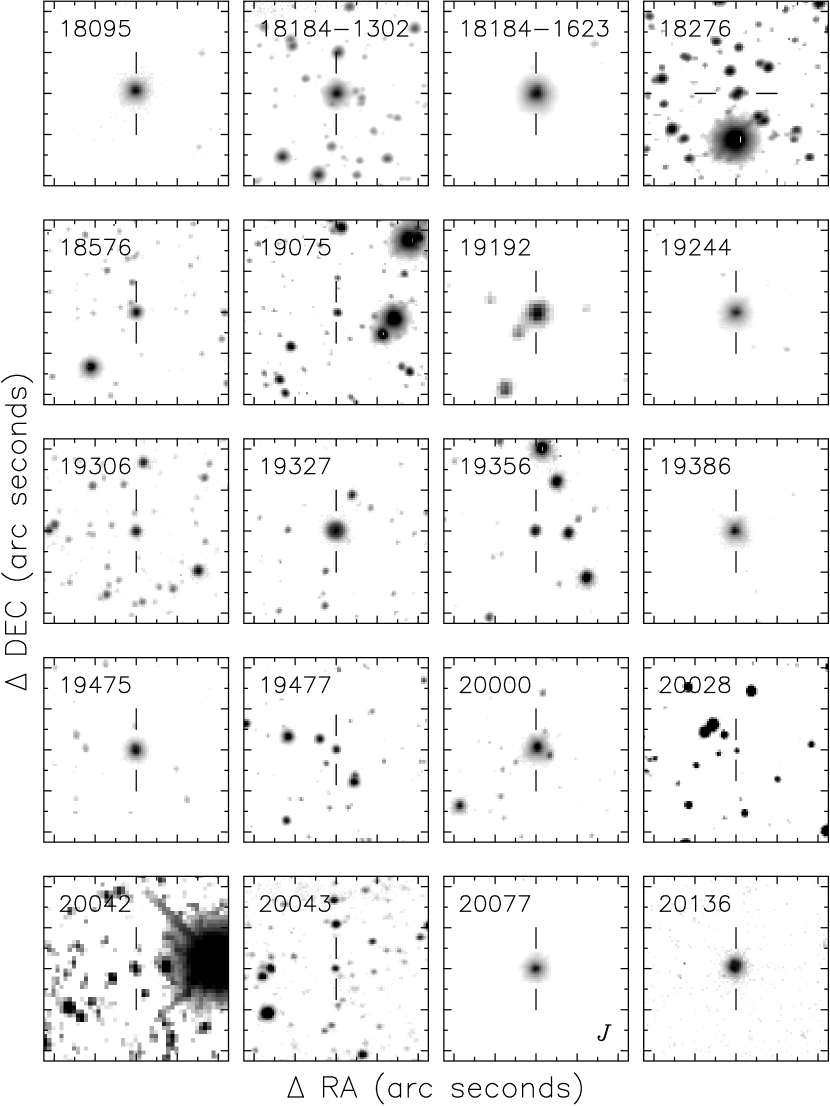
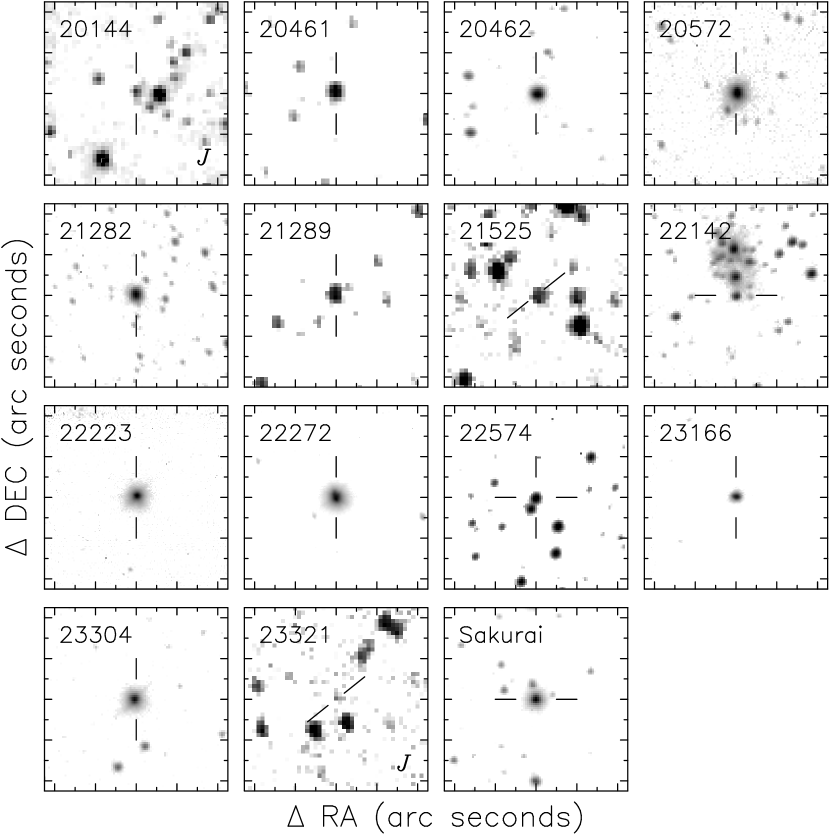
The resulting magnitudes of our target sources are listed in Table Near-Infrared Photometric Survey of Proto-Planetary Nebula Candidates, along with references to the previous near-IR photometries with which we compared our results. Also presented in Figure 1 are band finding charts. Each frame shows a field centered at the target source. When the band image is not available, the chart shows the band image (indicated by “J” in the frame). Some stars are too bright to image even at the 05 pixel-1 scale. In such cases we have intentionally defocused the optics not to saturate the detector arrays. We did not include finder charts for those bright, defocused objects, but they are bright enough to be easily identified when observed.
3 Discussion
3.1 Misidentification, Variability, and Extendedness
As one immediately sees from the finding charts, many of our target sources turned out to be located in a fairly crowded field. Thus, caution must be exercised when quoting previous photometric measurements done using a photometer with a large beam. As have been pointed out and strongly demonstrated by Van de Steene, van Hoof, & Wood (2000) for southern post-AGB objects, we have discovered 10 cases in which the source is likely to have been misidentified or previous measurements have been confused with neighboring objects (see the next section for details).
We have compared our results with past measurements to look for a possible variability, even though our limited precision may not be sufficient to decisively determine variabilities at a few tenth of a magnitude. In doing so, one needs to exercise caution because the photometric system used may not be the same in different observations. Transformation among photometric systems generally yielded at most 0.05 mag difference, which is still small relative to our uncertainty. Nevertheless, we have converted the data in the literature to the CIT/ELIAS photometric system when comparing the past data with our measurements. The comparison has yielded nearly two dozen cases where present and past observations indicate an appreciable amount of variation in the near-IR magnitudes, including quite a few objects with a previously unreported variability. Follow-up near-IR photometric monitoring observations are necessary to determine and characterize their variability.
Not all sources are point sources, and some are so extended that even a 40 inch telescope can resolve the structure. Thus, we have also tried to determine if any of the targets are extended. We did not find any obviously extended sources except for the ones that are known previously (043953601, 073991435, 093711212, 094521330, and 170281004). There are, however, marginally extended sources (071341005, 072840940, and 081871905) and it is worth following up on their morphologies using larger aperture telescopes.
3.2 Notes on Individual Sources
IRAS 01174+6110 – Our magnitudes are about 2 mag lower than the previously reported values (Manchado et al., 1989). There is a brighter star located about 35 west of the target. It is conceivable that this bright star may have been misidentified, since 60 wide raster scans with a limiting magnitude of 10.5 (at band) might have missed this source (). Otherwise, this source has experienced a significant brightness variation.
IRAS 013046211 – Our magnitudes are 1 to 2 mag lower than the previously values (Jones et al, 1990; Sun, Fang, & Wei, 1991; Xiong, Chen, & Gao, 1994). Although this source is known as an irregular variable (Jones et al, 1990), confusion-limited past observations (with a 20 beam for Jones et al 1990 observations, for example) may have been partially contaminated by the neighboring sources.
IRAS 021435852 – and magnitudes seem to show slight variation compared with the past observations (García-Lario et al., 1990; Fujii, Nakada, & Parthasarathy, 2002).
IRAS 021522822 – This source is a known near-IR variable (Whitelock et al., 1994). Their sporadic measurements are about 2 mag dimmer than our value.
IRAS 022296208 – Compared with the previous observations by Hrivnak & Kwok (1999), magnitude has become slightly dimmer while and magnitudes have become roughly a magnitude brighter. This may be due to recently formed warm dust grains in the system.
IRAS 025284350 – This source has recently been identified as a galaxy (see Fujii, Nakada, & Parthasarathy (2002) and reference therein).
IRAS 042963429 – There seems to be variation on the level of 0.2 to 0.4 mag among observations.
IRAS 043865722 – and brightnesses have increased since previously observed by Blommaert, van der Veen, & Habing (1993).
IRAS 043953601 – There seems to be variation up to 2 mag. However, higher and magnitudes reported by Ueta, Fong, & Meixner (2001) are at least partly due to the new emission structures discovered in their deep imaging.
IRAS 050890459 – Our magnitudes are in agreement with those recently measured by Fujii, Nakada, & Parthasarathy (2002), while García-Lario et al. (1990) reported values about 2 mag brighter.
IRAS 051131347 – Our measurements are in agreement with those reported by García-Lario et al. (1997) and Fujii, Nakada, & Parthasarathy (2002), while García-Lario et al. (1990) reported about 1 to 2 mag brighter values.
IRAS 053411347 – There seems to be variation on the level of 0.2 mag at and and perhaps larger at among observations.
IRAS 065492330 – García-Lario et al. (1997) reported slightly brighter magnitudes than ours. Their measurements may have been contaminated by the nearby near-IR bright star located about 15 SE.
IRAS 073991435 – This source is extended and its brightness variation compared with the past observations is well within the level previously reported (Kastner et al., 1992).
IRAS 074301115 – There seems to be variation on the level of 0.2 mag among observations.
IRAS 080052356 – There seems to be variation on the level of 0.2 mag among observations.
IRAS 081871905 – This known variable has varied its near-IR magnitude considerably (0.6 mag at , 1 mag at , and 1.5 mag at ) since observed last time nearly a decade ago (García-Lario et al., 1990). The object seems to be extended (FWHM = 35).
IRAS 163423814 – Our results are consistent with the values reported by van der Veen, Habing, & Geballe (1989). Observations by Fouqué et al. (1992) and García-Lario et al. (1997) reported 2 - 3 mag brighter values. The latter two studies seem to have misidentified the source with the nearby brighter star about 10 NE, since our measurements of this nearby source are consistent with their reported photometric values.
IRAS 165592957 – There seems to be variation on the level of 0.2 - 0.4 mag among observations.
IRAS 170281004 – The brighter magnitudes previously obtained by Fouqué et al. (1992) and Phillips & Cuesta (1994) seem to have been affected by their use of a large-beam photometer and the presence of a nearby star roughly 5 W.
IRAS 174365003 – This known variable varied its and magnitudes in the past while keeping its magnitude stable.
IRAS 174412411 – There seems to be variation on the level of 0.2 - 0.4 mag among observations.
IRAS 175342603 – Our near-IR magnitudes are 1.5 - 2 mag brighter compared with the results obtained 25 years ago (Humphreys & Ney, 1974a).
IRAS 180711727 – The previous observations by van der Veen, Habing, & Geballe (1989) may have been affected by the use of a large aperture photometer in this crowded field.
IRAS 180952704 – There seems to be variation on the level of 0.3 mag among observations.
IRAS 185760341 – This object is a near-IR variable (Ueta et al., 2001a; Pasquali & Coméron, 2002) and is now recognized as a luminous blue variable candidate.
IRAS 193061407 – Compared with the previous observations by García-Lario et al. (1997), magnitude has become slightly dimmer while and magnitudes have become slightly brighter. This may be due to recently formed warm dust grains in the system.
IRAS 193560754 – Only magnitude shows inconsistency between the present and previous observations: García-Lario et al. (1997) reported nearly 2 mag brighter value. This is likely caused by confusion with the neighboring star 15 off to the East, which significantly brightens in the band.
IRAS 194772401 – García-Lario et al. (1997) reported almost 1 to 2 mag brighter values. The field is rather crowded and their photometric values are likely to have been suffered from confusion.
IRAS 200003239 – There seems to be variation on the level of 0.2 - 0.4 mag among past observations at and .
IRAS 200283910 – Manchado et al. (1989) did not detect the source in their survey with about 10.5 mag detection limit. Our observations indicate that this source has varied its brightnesses about 0.5 mag.
IRAS 200770625 – Compared with the previous observations by Fouqué et al. (1992), our values are roughly 1 mag brighter.
IRAS 201444656 – The nearby bright source roughly 12 W seems to have contaminated the previous observations (García-Lario et al., 1997) that have yielded brighter magnitudes.
IRAS 204623416 – This source is a known variable (Arkhipova et al., 2001) and has brighter and magnitudes compared with the previous observations (García-Lario et al., 1997).
IRAS 205724919 – There seems to be variation on the level of 0.3 - 0.6 mag among observations. Arkhipova et al. (2000) suggests its optical variability is due to a variable stellar wind. The observed near-IR variability may be related to the dust formation in the variable wind.
IRAS 212895815 – There seems to be variation on the level of 0.5 mag among observations.
IRAS 221425206 – The previous observations by Manchado et al. (1989) may have been affected by the use of a large aperture photometer in this crowded field.
IRAS 222234327 – There seems to be variation on the level of 0.3 mag among observations. Especially, both present and past (García-Lario et al., 1997) two-epoch observations show similar variation, implying that the near-IR variation is real.
IRAS 222725435 – There seems to be variation on the level of 0.3 to 0.4 at and while it is less than 0.1 mag at .
IRAS 224806002 – There are discrepancies of about 1 mag between our values and previous measurements (Humphreys & Ney, 1974b).
IRAS 225746609 – This source seems to be a variable; its magnitudes are consistent with past measurements, but its magnitude may be dimmer about 0.5 mag.
IRAS 233046147 – There seems to be variation on the level of 0.6 - 0.8 mag among observations.
4 Conclusions
We have observed 78 objects including PPN candidates and others and measured their photometric magnitudes by means of imaging. magnitudes are presented in a tabular format together with band finding charts when available. Compared with the technique of aperture photometry using a photometer with a large beam size, imaging photometry yields more accurate results. However, the precision of our measurements are somewhat limited due to relatively large uncertainties originated from the zero magnitude determination and the intrapixel sensitivity variation of the detector arrays. We have discovered 10 cases (more than 10%) in which previous observations have either misidentified the source or been contaminated by neighboring objects in a crowded field. Therefore, caution must be exercised when one quotes photometric measurements done using a photometer with a large beam. We also have found quite a few sources indicating a variability, including ones previously unreported, which needs to be confirmed by follow-up monitoring observations. Extended structures have been recognized in some sources and marginal extension is seen in some objects from which no high-resolution imaging has been performed previously. Follow-up high-resolution imaging of those objects are also recommended.
References
- Alksnis & Khozov (1975) Alksnis, A. K., & Khozov, G. V. Soviet Astron. Lett., 1, 144
- Allen et al. (1977) Allen, D. A., Hyland, A. R., Longmore, A. J., Caswell, J. L., Goss, W. M., & Haynes, R. F. 1977, ApJ, 217, 108
- Arkhipova et al. (2001) Arkhipova, V. P., Ikonnikova, N. P., Noskova, R. I., Sokol, G. V., & Shugarov, S. Y. 2001, Astron. Lett., 27, 719
- Arkhipova et al. (2000) Arkhipova, V. P., Ikonnikova, N. P., Noskova, R. I., & Sokol, G. V. 2000, Astron. Lett., 26, 609
- Blommaert, van der Veen, & Habing (1993) Blommaert, J.A.D.L., van der Veen, W.E.C.J., & Habing, H.J. 1993, A&A, 267, 39
- Casali & Hawarden (1992) Casali, M. M. & Hawarden, T. G. 1992, UKIRT Newsletter, 4, 33
- Elias et al. (1982) Elias, J. H., Frogel, J. A., Matthews, K., & Neugebauer, G. 1982, AJ, 87, 1029
- Feast et al. (1997) Feast, M. W., Carter, B. S., Roberts, B. G., Marang, F., & Catchpole, R. M. 1997, MNRAS, 285, 317
- Fouqué et al. (1992) Fouqué, P., Le Bertre, T., Epchtein, N., Guglielmo, F., & Kerschbaum, F. 1992, A&AS, 93, 151
- Fujii, Nakada, & Parthasarathy (2002) Fujii, T., Nakada, Y., & Parthasarathy, M. 2002, A&A, 385, 884
- García-Lario et al. (1990) García-Lario, P., Manchado, A., Pottasch, S. R., Suso, J., & Olling, R. 1990, A&AS, 82, 497
- García-Lario et al. (1997) García-Lario, P., Manchado, A., Pych, W., & Pottasch, S. R. 1997, A&AS, 126, 479
- Geballe & van der Veen (1990) Geballe, T. R., & van der Veen, W. E. C. J. 1990, A&A, 235, L9
- Hodapp, Sellgren, & Nagata (1988) Hodapp, K.-W., Sellgren, K., & Nagata, T. 1988, ApJ, 326, 61L
- Hrivnak (1995) Hrivnak, B. J. 1995, ApJ, 438, 341
- Hrivnak & Kwok (1991a) Hrivnak, B. J., & Kwok, S. 1991, ApJ, 368, 564
- Hrivnak & Kwok (1991b) Hrivnak, B. J., & Kwok, S. 1991, ApJ, 371, 631
- Hrivnak & Kwok (1999) Hrivnak, B. J., & Kwok, S. 1999, ApJ, 513, 869
- Hrivnak, Kwok, & Geballe (1994) Hrivnak, B. J., Kwok, S., & Geballe, T. R. 1994, ApJ, 420, 783
- Hrivnak, Kwok, & Volk (1988) Hrivnak, B. J., Kwok, S., & Volk, K. 1988, ApJ, 331, 832
- Hrivnak, Kwok, & Volk (1989) Hrivnak, B. J., Kwok, S., & Volk, K. 1989, ApJ, 346, 265
- Hu et al. (1993) Hu, J. Y., Slijkhuis, S., de Jong, T., & Jiang B. W. 1993, A&AS, 100, 413
- Humphreys & Ney (1974a) Humphreys, R. M., & Ney, E. P. 1974a, ApJ, 187, 75L
- Humphreys & Ney (1974b) Humphreys, R. M., & Ney, E. P. 1974b, PASP, 86, 444
- Iben (1995) Iben, I., Jr. 1995, Physics Reports, 250, 1
- Jones et al (1990) Jones, T. J., Bryja, C. O., Gehrz, R. D., Harrison, T. E., Johnson, J. J., Klebe, D. I., & Lawrence, G. F. 1990, ApJS, 74, 785
- Jones et al. (1993) Jones, T. J., et al. 1993, ApJ, 411, 323
- Kamath & Ashok (2002) Kamath, U. S., & Ashok, N. M. 2002, Ap&SS, 279, 65
- Kastner & Weintraub (1995) Kastner, J. H., & Weintraub, D. A., 1995, ApJ, 452, 833
- Kastner et al. (1992) Kastner, J. H., Weintraub, D. A., Zuckerman, B., Becklin, E. E., McLean, I., & Gatley, I. 1992, ApJ, 398, 552
- Krisciunas et al. (1987) Krisciunas, K., Sinton, W., Tholen, K., Tokunaga, A., Golisch, W., Griep, D., Kaminski, C., Impey, C., & Christian, C. 1987, PASP, 99, 887
- Kwok (1993) Kwok, S. 1993, ARA&A, 31, 63
- Kwok, Hrivnak, & Geballe (1995) Kwok, S., Hrivnak, B. J., & Geballe, T. R. 1995, ApJ, 454, 394
- Kwok, Hrivnak, & Langill (1993) Kwok, S., Hrivnak, B. J., & Langill, P. P. 1993, ApJ, 408, 586
- Latter et al. (1995) Latter, W. B., Kelly, D. M., Hora, J. L., & Deutsch, L. K. 1995, ApJS, 100, 159
- Latter et al. (1992) Latter, W. B., Maloney, P. R., Kelly, D. M., Black, J. H., Rieke, G. H., & Rieke, M. J. 1992, ApJ, 389, 347
- Lauer (1999) Lauer, T. R. 1999, PASP, 111, 1434
- Lawrence, Jones, & Gehrz (1990) Lawrence, G., Jones, T. J., & Gehrz, R. D. 1990, AJ, 99, 1232
- Le Bertre (1987) Le Bertre, T. 1987, A&A, 180, 160
- Le Bertre (1988) Le Bertre, T. 1988, A&A, 203, 85
- Lepine, Ortiz, & Epchtein (1995) Lepine, J. R. D., Ortiz, R., & Epchtein, N. 1995, A&A, 299, 453
- Manchado et al. (1989) Manchado, A., Pottasch, S. R., García-Lario, P., Esteban, C., & Mampaso, A. 1989, A&A, 214, 139
- McLean & Teplitz (1996) McLean, I. S. & Teplitz, H. 1996, AJ, 112, 2500
- Meixner et al. (2002) Meixner, M., Ueta, Bobrowsky, M., & Speck, A. K. 2002, ApJ, 571, 936
- Meixner et al. (1999) Meixner, M., Ueta, T., Dayal, A., Hora, J. L., Fazio, G., Hrivnak, B. J., Skinner, C. J., Hoffmann, W. F., & Deutsch, L. K. 1999, ApJS, 122, 221.
- Meixner, Young Owl, & Leach (1999) Meixner, M., Young Owl, L., & Leach, R. 1999, PASP, 111, 997
- Pasquali & Coméron (2002) Pasquali, A., & Coméron, F. 2002, A&A, 382, 1005
- Phillips & Cuesta (1994) Phillips, J. P., & Cuesta, L. 1994, A&AS, 104, 169
- Rouan et al. (1988) Rouan, D., Omont, A., Lacombe, F., & Forveille, T. 1988, A&A, 189, L3
- Slijkhuis, Hu, & de Jong (1991) Slijkhuis, S., Hu, J. Y., & de Jong, T. 1991, A&A, 248, 547
- Strecker & Ney (1974) Strecker, D. W., & Ney, E. P. 1974, AJ, 79, 1410
- Sun, Fang, & Wei (1991) Sun, J., Fang, G., & Wei, H. 1991, Ch. A&A, 15, 306
- Szczerba et al. (1997) Szczerba, R., Omont, A., Volk, K., Cox, P., & Kwok, S. 1997, A&A, 317, 859
- Ueta, Fong, & Meixner (2001) Ueta, T., Fong, D., & Meixner, M. 2001, ApJ, 557, L117
- Ueta, Meixner, & Bobrowsky (2000) Ueta, T., Meixner, M., & Bobrowsky, M. 2000, ApJ, 528, 861
- Ueta et al. (2001a) Ueta, T., Meixner, M., Dayal, A., Deutsch, L. K., Fazio, G. G., Hora J. L., & Hoffmann, W. F. 2001a, ApJ, 548, 1020
- Ueta et al. (2001b) Ueta, T., Meixner, M., Hinz, P. M., Hoffmann, W. F., Brandner, W., Dayal, A., Deutsch, L. K., Fazio, G. G., & Hora, J.L. 2001b, ApJ, 557, 831
- Van de Steene, van Hoof, & Wood (2000) Van de Steene, G. C., van Hoof, P. A. M., Wood, P. R. 2000, A&A, 362, 984
- van der Veen, Habing, & Geballe (1989) van der Veen, W. E. C. J., Habing, H. J., & Geballe, T. R. 1989, A&A, 226, 108
- Xiong, Chen, & Gao (1994) Xiong, G.-Z., Chen, P.-S., & Gao, H. 1994, A&AS, 108, 661
- Whitelock et al. (1994) Whitelock, P., Menzies, J., Feast, M., Marang, F., Carter, B., Roberts, G., Catchpole, R., Chapman, J. 1994, MNRAS, 267, 711
| Run | Date | Pixel Scale | Conditions | Seeing |
|---|---|---|---|---|
| 1 | 1997 Jul 23 | 10 | Photometric | 16 |
| Jul 24 | 10 | Photometric | 19 | |
| Jul 25 | 10 | Photometric | 20 | |
| Jul 26 | 05 | Clear | 15 | |
| 2 | 1998 Jun 19 | Fog | ||
| Jun 20 | 10 | Photometric | 22 | |
| Jun 21 | 05 | Clear | 27 | |
| Jun 22 | 10 | Photometric | 20 | |
| Jun 23 | 20 | Photometric | 19 | |
| Jun 24 | 10 | Photometric | 20 | |
| Jun 25 | 10 | Photometric | 22 | |
| Jun 26 | 10 | Clear | 30 | |
| Jun 27 | 20 | Clear | 35 | |
| 3 | 1999 Nov 12 | 10 | Photometric | 21 |
| Nov 13 | 10 | Mostly Clear | 20 | |
| Nov 14 | 10 | Mostly Clear | 22 | |
| Nov 15 | 10 | Clear | 23 | |
| Nov 16 | 05 | Photometric | 21 | |
| Nov 17 | Cloudy | |||
| Nov 18 | 20 | Photometric | 22 |
| Coordinates (J2000.0) | Observed Dates | ||||||
|---|---|---|---|---|---|---|---|
| Name | RA | DEC | 1997 Jul | 1998 Jun | 1999 Nov | Ref. | |
| HD 225023 | 00 02 46.0 | 35 48 56 | 13, 17 | 1 | |||
| HD 1160 | 00 15 57.3 | 04 15 04 | 15 | 1 | |||
| HD 3029 | 00 33 39.5 | 20 26 02 | 13 | 1 | |||
| HD 18881 | 03 03 31.9 | 38 24 36 | 13, 14, 16, 18 | 1 | |||
| HD 22686 | 03 38 55.1 | 02 45 49 | 12, 16 | 1 | |||
| FS 11 | 04 52 58.9 | 00 14 42 | 14 | 2 | |||
| HD 40335 | 05 58 13.5 | 01 51 23 | 15 | 1 | |||
| FS 23 | 13 41 43.6 | 28 29 50 | 23 | 2 | |||
| HD 129655 | 14 43 46.4 | 02 30 20 | 22, 24 | 1 | |||
| HD 136754 | 15 21 34.5 | 24 20 36 | 21 | 1 | |||
| S-R 3 | 16 23 07.7 | 24 27 26 | 23 | 1 | |||
| HD 162208 | 17 47 58.6 | 39 58 51 | 26 | 25 | 1 | ||
| HD 161903 | 17 48 19.2 | 01 48 30 | 23 | 20, 21, 24 | 1 | ||
| FS 35 | 18 27 13.5 | 04 03 09 | 23, 24 | 27 | 2 | ||
| GL 748 | 19 12 14.6 | 02 53 11 | 20, 21, 22, 24, 26 | 1 | |||
| GL 811.1 | 20 56 46.6 | 10 26 55 | 26 | 23, 27 | 1 | ||
| HD 203856 | 21 23 35.5 | 40 01 07 | 23, 24, 25 | 26 | 12, 14, 16, 18 | 1 | |
| FS 31 | 23 12 21.6 | 10 47 04 | 25 | 2 | |||
| Source | Coordinates (J2000.0) | Magnitudes | Comparison | |||||
|---|---|---|---|---|---|---|---|---|
| (Other Name) | RA | DEC | Ref.aaBasis for the coordinates: HST - HST observations ( accuracy), OPT - optical observations ( accuracy), MIR - mid-IR observations (Meixner et al. 1999; typically accuracy), IRAS - IRAS observations (typically accuracy) | Date | Ref. | |||
| 002106221 | 00 23 51.1 | 62 38 16 | MIR | 1999 Nov 12 | 12.900.06 | 11.930.05 | 11.760.07 | |
| 004706429 | 00 50 07.2 | 64 45 46 | MIR | 1999 Nov 13 | 14.770.07 | 14.370.10 | 14.830.22 | |
| 011746110 | 01 20 44.3 | 61 26 21 | MIR | 1999 Nov 12 | 14.770.07 | 13.030.05 | 11.570.07 | 12 |
| 013046211 | 01 33 51.2 | 62 26 53 | MIR | 1999 Nov 18 | 10.840.07 | 6.850.34 | 19, 21, 31 | |
| 021435852 | 02 17 57.9 | 59 05 51 | MIR | 1999 Nov 13 | 10.590.06 | 9.500.04 | 8.460.07 | 37, 40 |
| 021522822 | 02 18 06.6 | 28 36 48 | MIR | 1999 Nov 15 | 10.510.17 | 30 | ||
| 022296208 | 02 26 41.9 | 62 21 22 | HST | 1999 Nov 12 | 6.830.06 | 4.650.08 | 4.200.12 | 38 |
| 025284350 | 02 56 11.3 | 44 02 51 | IRAS | 1999 Nov 13 | 10.120.06 | 9.820.04 | 9.420.07 | 12, 37, 40 |
| 042963429 | 04 32 57.0 | 34 36 13 | HST | 1999 Nov 12 | 9.640.06 | 8.750.04 | 8.290.07 | 12, 17, 37, 40 |
| 043865722 | 04 42 49.0 | 57 27 47 | HST | 1999 Nov 12 | 6.750.06 | 4.340.06 | 3.950.09 | 25 |
| 1999 Nov 13 | 6.760.06 | 4.360.07 | 3.920.13 | |||||
| 043953601 | 04 42 53.6 | 36 06 54 | OPT | 1999 Nov 12 | 13.040.08 | 11.290.04 | 8.810.07 | 24, 34, 39 |
| (GL 618) | ||||||||
| 050890459 | 05 11 36.0 | 05 03 26 | MIR | 1999 Nov 14 | 10.270.06 | 9.260.04 | 8.900.07 | 14, 40 |
| 1999 Nov 15 | 10.270.15 | 9.270.07 | 8.810.31 | |||||
| 051131347 | 05 14 07.8 | 13 50 28 | HST | 1999 Nov 12 | 8.940.06 | 8.360.04 | 8.110.07 | 14, 33, 37, 40 |
| 1999 Nov 14 | 9.040.06 | 8.390.04 | 8.170.07 | |||||
| 052380626 | 05 26 19.8 | 06 23 57 | OPT | 1999 Nov 15 | 9.660.15 | 9.350.07 | 9.140.31 | 14, 37, 40 |
| 053410852 | 05 36 55.0 | 08 54 08 | HST | 1999 Nov 14 | 10.090.06 | 9.450.04 | 9.170.07 | 12, 15, 37, 38, 40 |
| 053570217 | 05 38 14.1 | 02 15 60 | OPT | 1999 Nov 15 | 9.470.15 | 9.140.07 | 8.940.31 | 14 |
| 053811012 | 05 40 56.7 | 10 14 25 | IRAS | 1999 Nov 14 | 8.860.06 | 8.360.04 | 8.230.07 | 12 |
| 1999 Nov 15 | 8.830.15 | 8.400.07 | 8.170.31 | |||||
| 061761036 | 06 19 58.2 | 10 38 15 | OPT | 1999 Nov 15 | 6.590.15 | 5.010.10 | 22 | |
| (Red Rectangle) | 1999 Nov 16 | 6.500.15 | 4.970.08 | 3.980.44 | ||||
| 065300213 | 06 55 31.8 | 02 17 29 | HST | 1999 Nov 12 | 9.560.06 | 8.860.04 | 8.480.07 | 26, 37 |
| 065492330 | 06 57 05.3 | 23 34 18 | IRAS | 1999 Nov 15 | 9.310.15 | 9.070.07 | 8.910.31 | 37 |
| 071341005 | 07 16 10.3 | 09 59 48 | HST | 1999 Nov 16 | 6.790.15 | 6.610.07 | 7.030.31 | 11, 12 |
| (HD 56216) | ||||||||
| 072271320 | 07 25 03.1 | 13 26 17 | IRAS | 1999 Nov 15 | 8.830.15 | 7.890.07 | 7.530.31 | 37 |
| 072393325 | 07 25 52.2 | 33 31 22 | IRAS | 1999 Nov 15 | 9.080.15 | 8.050.08 | 7.690.33 | |
| 072840940 | 07 30 47.5 | 09 46 37 | OPT | 1999 Nov 16 | 4.330.16 | 3.900.11 | 4.160.45 | |
| (U Mon) | ||||||||
| 073310021 | 07 35 41.2 | 00 14 58 | OPT | 1999 Nov 16 | 5.920.15 | 5.460.07 | 5.630.32 | 14 |
| 073991435 | 07 42 16.8 | 14 42 52 | IRAS | 1999 Nov 15 | 8.290.15 | 6.920.07 | 5.780.32 | 23, 35, 37 |
| (OH 231.8) | ||||||||
| 074301115 | 07 45 51.4 | 11 08 20 | HST | 1999 Nov 12 | 9.030.06 | 8.310.04 | 7.940.07 | 37, 38, 40 |
| 075060345 | 07 53 06.9 | 03 53 29 | IRAS | 1999 Nov 14 | 13.440.11 | 14 | ||
| 080052356 | 08 02 40.8 | 24 04 44 | HST | 1999 Nov 15 | 8.020.15 | 6.900.08 | 5.640.42 | 20, 35, 37 |
| 081871905 | 08 20 57.1 | 19 15 04 | OPT | 1999 Nov 16 | 7.930.15 | 8.370.07 | 8.790.31 | 14 |
| 093711212 | 09 39 53.6 | 11 58 54 | IRAS | 1999 Nov 12 | 7.960.06 | 7.410.04 | 7.390.07 | 7, 10 |
| (Frosty Leo) | ||||||||
| 094521330 | 09 47 57.4 | 13 16 43 | HST | 1999 Nov 16 | 6.850.15 | 3.640.07 | 0.200.40 | 9 |
| (IRC +10216) | ||||||||
| 101313049 | 10 16 02 | 30 34 19 | MIR | 1999 Nov 16 | 7.060.15 | 4.340.07 | 1.430.31 | 3, 4 |
| (CIT 6) | ||||||||
| 154652818 | 15 48 34.4 | 28 09 25 | HST | 1998 Jun 21 | 5.970.21 | 5.420.17 | 4.810.23 | 1, 36 |
| (R CrB) | ||||||||
| 163423814 | 16 37 39.9 | 38 20 17 | HST | 1998 Jun 20 | 11.700.23 | 10.540.19 | 9.640.27 | 13, 22, 37 |
| 165592957 | 16 59 08.1 | 30 01 41 | MIR | 1998 Jun 20 | 11.800.24 | 10.830.20 | 9.510.25 | 14, 22, 26 |
| 170281004 | 17 05 37.7 | 10 08 33 | OPT | 1998 Jun 20 | 10.620.24 | 12.750.27 | 10.900.99 | 22, 29 |
| (M 2-9) | ||||||||
| 174365003 | 17 44 55.4 | 50 02 40 | HST | 1997 Jul 26 | 6.220.12 | 5.980.13 | 6.040.17 | 1, 14 |
| (HD 161796) | ||||||||
| 174412411 | 17 47 13.5 | 24 12 50 | HST | 1997 Jul 23 | 11.120.13 | 10.140.14 | 9.510.19 | 13, 26, 37 |
| Sakurai’s Object | 17 52 32.6 | 17 41 08 | OPT | 1998 Jun 25 | 7.410.22 | 6.250.28 | 5.120.44 | 41 |
| (V4334 Sgr) | 1998 Jun 26 | 7.410.21 | 6.240.18 | 5.230.29 | ||||
| 175342603 | 17 55 25.2 | 26 02 60 | OPT | 1998 Jun 21 | 4.870.21 | 4.430.17 | 3.610.23 | 1 |
| (89 Her) | ||||||||
| 180711727 | 18 10 05.9 | 17 26 35 | MIR | 1997 Jul 24 | 15.570.22 | 14.780.44 | 12.990.31 | 13 |
| 180952704 | 18 11 30.8 | 27 05 15 | HST | 1998 Jun 22 | 7.270.21 | 6.730.17 | 6.380.23 | 8, 13, 16, 32, 37 |
| 181841302 | 18 21 15.9 | 13 01 27 | MIR | 1998 Jun 21 | 9.170.21 | 7.550.17 | 6.870.11 | 5 |
| (MWC 922) | ||||||||
| 181841623 | 18 21 19.5 | 16 22 26 | MIR | 1997 Jul 26 | 5.090.44 | 4.580.51 | 4.400.58 | 12 |
| (HD 168625) | 1998 Jun 21 | 5.190.24 | 4.650.25 | 4.360.40 | ||||
| 182761431 | 18 30 30.5 | 14 28 53 | MIR | 1998 Jun 24 | 11.540.22 | 10.620.19 | 9.330.24 | 6, 26 |
| 185760341 | 19 00 11.2 | 03 45 46 | IRAS | 1999 Nov 14 | 12.440.07 | 9.320.05 | 7.600.08 | 37, 42 |
| 190750921 | 19 09 57.1 | 09 26 52 | MIR | 1998 Jun 20 | 14.931.31 | 12.390.35 | 11.030.29 | |
| 191920922 | 19 21 36.5 | 09 27 56 | MIR | 1998 Jun 27 | 8.910.21 | 6.560.18 | ||
| 192441115 | 19 26 48.0 | 11 21 17 | OPT | 1997 Jul 26 | 5.520.13 | 4.520.17 | 3.690.22 | 27 |
| (IRC +10420) | 1998 Jun 21 | 5.590.21 | 4.620.17 | 3.740.24 | ||||
| 193061407 | 19 32 55.1 | 14 13 36 | IRAS | 1999 Nov 15 | 11.420.15 | 10.800.08 | 10.350.31 | 37 |
| 193273024 | 19 34 45.2 | 30 30 59 | OPT | 1999 Nov 15 | 8.980.15 | 8.800.07 | 7.780.31 | 29 |
| (BD+30∘3639) | ||||||||
| 193560754 | 19 38 01.9 | 08 01 32 | IRAS | 1999 Nov 15 | 11.570.15 | 10.890.07 | 10.590.31 | 37 |
| 193860155 | 19 41 08.2 | 02 02 31 | MIR | 1997 Jul 23 | 7.940.12 | 6.960.13 | 6.070.19 | 13, 22 |
| 194753119 | 19 49 29.6 | 31 27 16 | OPT | 1999 Nov 15 | 7.870.15 | 7.570.07 | 7.370.34 | 37 |
| 194772401 | 19 49 54.4 | 24 08 51 | MIR | 1998 Jun 20 | 12.770.24 | 11.500.18 | 11.200.25 | 37 |
| 200003239 | 20 01 59.4 | 32 47 32 | MIR | 1997 Jul 23 | 7.990.13 | 6.980.12 | 6.570.17 | 12, 33 |
| 1999 Nov 18 | 7.960.15 | 6.970.07 | 6.510.40 | |||||
| 200042955 | 20 02 27.3 | 30 04 25 | MIR | 1997 Jul 26 | 4.990.16 | 4.230.16 | 3.970.21 | 11 |
| 1998 Jun 21 | 5.230.21 | 4.250.17 | 3.910.23 | |||||
| 200283910 | 20 04 35.9 | 39 18 45 | HST | 1997 Jul 25 | 14.910.25 | 14.770.42 | 14.300.75 | 12 |
| 1999 Nov 13 | 15.720.11 | 16.360.11 | 14.520.27 | |||||
| 200423259 | 20 06 10.6 | 33 07 51 | IRAS | 1999 Nov 18 | 13.950.16 | 13.430.12 | 13.140.32 | 37 |
| 200432653 | 20 06 22.7 | 27 02 32 | HST | 1997 Jul 25 | 13.780.15 | 10.320.18 | 12 | |
| 200770625 | 20 10 27.4 | 06 16 16 | MIR | 1998 Jun 24 | 5.430.25 | 3.140.20 | 22 | |
| 201361309 | 20 16 00.1 | 13 18 55 | IRAS | 1999 Nov 15 | 10.400.15 | 9.340.07 | 8.450.31 | 12 |
| 201444656 | 20 15 58.3 | 47 05 39 | IRAS | 1999 Nov 18 | 13.980.22 | 37 | ||
| 204613853 | 20 48 04.6 | 39 05 00 | IRAS | 1999 Nov 18 | 11.450.15 | 10.330.07 | 9.610.31 | 37 |
| 204623416 | 20 48 16.6 | 34 27 25 | HST | 1999 Nov 12 | 10.430.06 | 9.820.04 | 9.560.07 | 37 |
| (V1853 Cyg) | ||||||||
| 205724919 | 20 58 55.7 | 49 31 12 | OPT | 1999 Nov 14 | 9.090.06 | 8.170.04 | 7.390.07 | 11, 37 |
| 1999 Nov 18 | 8.980.15 | 8.010.07 | 7.130.36 | |||||
| 212825050 | 21 29 58.5 | 51 04 00 | IRAS | 1999 Nov 13 | 11.630.06 | 10.770.04 | 9.590.07 | 28 |
| 212895815 | 21 30 23.0 | 58 28 51 | IRAS | 1999 Nov 18 | 12.530.16 | 11.630.10 | 10.400.31 | 37 |
| 215255643 | 21 54 15.2 | 56 57 25 | IRAS | 1999 Nov 18 | 14.870.17 | 13.960.22 | 12.900.33 | 12 |
| 221425206 | 22 16 10.1 | 52 21 13 | HST | 1997 Jul 24 | 15.190.15 | 12.320.12 | 10.920.18 | 12 |
| 222234327 | 22 24 31 | 43 43 09 | MIR | 1997 Jul 23 | 7.690.12 | 7.260.12 | 7.130.17 | 33, 37 |
| 1998 Jun 26 | 7.960.21 | 7.520.17 | 7.310.23 | |||||
| 222725435 | 22 29 10.4 | 54 51 07 | HST | 1999 Nov 16 | 5.430.15 | 4.890.07 | 5.100.32 | 12, 13, 18, 37 |
| (HD 235858) | ||||||||
| 224806002 | 22 49 59.1 | 60 17 55 | MIR | 1997 Jul 26 | 4.990.16 | 4.230.16 | 3.970.21 | 2 |
| 225746609 | 22 59 18.3 | 66 25 47 | HST | 1997 Jul 25 | 14.000.14 | 13.620.17 | 13.180.20 | 17 |
| 1999 Nov 14 | 13.830.08 | 13.150.11 | 12.910.13 | |||||
| 231661655 | 23 19 12.3 | 17 11 35 | MIR | 1998 Jun 26 | 10.720.21 | 10.430.17 | 10.900.24 | 14 |
| 233046147 | 23 32 45.0 | 62 03 49 | IRAS | 1997 Jul 25 | 8.430.12 | 7.700.12 | 7.400.18 | 12, 14, 17, 37, 40 |
| 1998 Jun 27 | 9.060.21 | 8.480.18 | 8.010.25 | |||||
| 233216545 | 23 34 23.1 | 66 01 51 | HST | 1998 Jun 27 | 13.920.21 | 12.470.59 | ||
References. — 1. Humphreys & Ney (1974a), 2. Humphreys & Ney (1974b), 3. Strecker & Ney (1974), 4. Alksnis & Khozov (1975), 5. Allen et al. (1977), 6. Le Bertre (1987), 7. Hodapp, Sellgren, & Nagata (1988), 8. Hrivnak, Kwok, & Volk (1988), 9. Le Bertre (1988), 10. Rouan et al. (1988), 11. Hrivnak, Kwok, & Volk (1989), 12. Manchado et al. (1989), 13. van der Veen, Habing, & Geballe (1989), 14. García-Lario et al. (1990), 15. Geballe & van der Veen (1990), 16. Lawrence, Jones, & Gehrz (1990), 17. Hrivnak & Kwok (1991a), 18. Hrivnak & Kwok (1991b), 19. Jones et al (1990), 20. Slijkhuis, Hu, & de Jong (1991), 21. Sun, Fang, & Wei (1991), 22. Fouqué et al. (1992), 23. Kastner et al. (1992), 24. Latter et al. (1992), 25. Blommaert, van der Veen, & Habing (1993), 26. Hu et al. (1993), 27. Jones et al. (1993), 28. Kwok, Hrivnak, & Langill (1993), 29. Phillips & Cuesta (1994), 30. Whitelock et al. (1994), 31. Xiong, Chen, & Gao (1994), 32. Kastner & Weintraub (1995), 33. Kwok, Hrivnak, & Geballe (1995), 34. Latter et al. (1995), 35. Lepine, Ortiz, & Epchtein (1995), 36. Feast et al. (1997), 37. García-Lario et al. (1997), 38. Hrivnak & Kwok (1999), 39. Ueta, Fong, & Meixner (2001), 40. Fujii, Nakada, & Parthasarathy (2002), 41. Kamath & Ashok (2002), 42. Pasquali & Coméron (2002)