Formation and Cosmic Evolution of Elliptical Galaxies
Abstract
A review of the present observational and theoretical status of elliptical galaxies is presented with the aim to clarify whether the monolithic or the hierarchical, is a more viable scenario for the origin of these structures. We describe the dynamical structure of elliptical galaxies using photometric and spectroscopic data, in particular 3D observations from integral field spectrographs, with emphasis on properties such as brightness distribution, velocity profiles, central structures like ”cuspy” profiles and ”cores”, as well as central super massive black holes. We review also the main relations between these quantities like the fundamental plane and colour-luminosity diagram. We present observational evidences for the presence of dark matter in the elliptical galaxies and discuss the theories of galaxy formation within the framework of a cold dark matter cosmological model. We discuss the formation of large-scale structure, Press-Schechter theory and universal density profile of dark matter halos. Subsequently, gas dynamics, star formation, feedback, angular momentum, morphology and the epoch of galaxy formation are studied and comparison between disks and spheroids are made. Valuable insights into the formation epoch of elliptical galaxies are provided by deriving the mean metallicities and ages at different redshifts through the study of different population synthesis models (single-burst and evolutionary models) in particular the magnesium to iron ratio.
To appear in ”Recent Research Developments in Astronomy & Astrophysics”
1 Introduction
For many years after their introduction as one of the Hubble types, elliptical galaxies (E’s) were generally thought of as ”boring dynamical systems”, that is oblate spheroids supported by rotation. Unduly slow rotations however, were measured in a number of objects (Bertola & Capaccioli 1975; Illingworth 1977). The anisotropy of the velocity field was then invoked to explain the flattening of ellipticals. On the other hand a paper entitled ”A numerical model for a triaxial stellar system in dynamical equilibrium” was published by Schwarzschild (1979): it aimed at explaining the correlated radial variations in isophotes axis-ratios and orientations. Although these properties had already been well-documented in the sixties, the interest was renewed from both the theoretical and observational points of view (Williams & Schwarzschild 1979a, 1979b; Leach 1981). Triaxiality became fashionable, and it was realized that ellipticals were quite exciting dynamical systems after all!
A few years later, the presence of disks in E’s was advocated (Michard 1984, 1985), on the basis of the ellipticity radial profiles of E’s as compared to S0 and the pointed forms of isophotes. A key result was published by Bender (1988), who found a correlation between isophotal geometry and kinematics: objects with pointed, or ”disky”, isophotes are fast rotators and largely supported by rotation. Objects with ”boxy” isophotes rotate quite slowly, and can only be supported by ”thermal” motions, i.e. a stochastic system of stellar orbits. On average the fainter objects are disky (E), while giant E’s are often boxy (E). A face-on disk cannot be readily detected, but is still present (Rix & White 1990), hence the sub-class E.
Although most E-galaxies have a disk, this component is only a minor ornament, compared to the powerful rotating disks of spirals: in these galaxies the disks eventually dominates the morphology, photometry and kinematics. Spirals (S) have plenty of interstellar matter (ISM), including ”cold gas” (atomic and molecular), dust and are accordingly still able to form new stars. Spirals are supported by rotation, including their central spheroidal bulge, often considered as a small E-galaxy ”grafted” upon the disk. In contrast, ellipticals have little ISM and their stars are normally quite old. They have however the rather unique property to contain significant amounts of ”hot gas” at some K and therefore to emit X-rays. Rotation plays only a minor role in their dynamical support. Finally, radio-galaxies with extended lobes seem to be giant E’s: is it a way to recognize these at large ?
Of special interest are the lenticulars or S0 galaxies, intermediate between spirals and ellipticals: they have disks of various importance, between those of E and S objects, and are largely supported by rotation. No spiral structure appears but bar instability is current. On the other hand their stellar populations resemble those of ellipticals, while their amount of ISM varies very much from one object to the other: eventually as low as for E’s, it may become quite noticeable, without allowing star formation.
It is a challenge for astrophysicists to understand the origin and evolution of all these three major types of bright galaxies (not counting the various classes of dwarfs which will not be discussed in this review). Among the usual constraints are the relative populations of E/S0/S as a function of and in various environments, i.e. the field, small groups and clusters of diverse richness. We are nevertheless justified in considering separately the problem of ellipticals, because of a number of systematic properties, in their photometry and kinematics, or in their stellar population content. These supply adequate guidance in deriving theoretical models, and precious tests of their success.
The origin of cosmic structures, including galaxies of all types, is currently described through the gravitational dissipationless collapse in a Universe dominated by Cold Dark Matter (CDM), with a suitable mix of primeval gas and photons. The existence of large amounts of dissipationless DM in the universe, clustered hierarchically as numerical simulations indicate, may induce the infall of gas into the potential wells of pre-existing halos and form the ”luminous” galaxies. Note that the presently popular version of the CDM scenario, i.e. the CDM (Bahcall et al. 1999) agrees with observations, such as the residual fluctuations in the cosmic microwave background (CMB) or the distribution of galaxy clusters and superclusters. It is of course unfortunate that the physical nature of CDM remains unknown, while the presence of DM halos around galaxies is still questioned from time to time, even for spirals which seemed to present the most robust dynamical proofs.
Starting from preexisting DM halos (or protogalaxies) it is possible to model the formation of galaxies, using simulations which take into account the dynamics of DM and gas, star formation, radiative cooling and gas loss from galactic winds. Two main families of models may be recognized:
-
1.
The monolithic scenario, developed since the early work by Larson (1975), is characterized by an important star formation activity and a consequent chemical enrichment /em at very early phases of the galaxy history, followed by a long period of quiescent evolution. Episodes of star formation may occur later in the lifetime of the galaxy, stimulated by gas accreted from the surrounding ambient or by interactions with neighbors (Bertola et al. 1992).
-
2.
In the so called hierarchical scenario, ellipticals are formed from different merging episodes through the Hubble time, which trigger the star formation activity and the chemical enrichment of the system (White & Rees 1978). In this scenario, massive ellipticals form at relatively low redshifts () through the merging of spiral galaxies (Toomre 1977; Baugh et al. 1996, 1998).
As emphasized by Peebles (2002), the distinction between the two scenarios is more of historical than physical significance. Large objects may be formed by interaction and merging of a hierarchy of primeval ”lumps” in a protogalaxy: this is practically equivalent to a monolithic scenario. On the other hand, there is no doubt that galaxies do interact, with sometimes spectacular effects, and have perhaps interacted still more at large z. The central problem is rather to find out when the bulk of the stars were formed and if this population evolved passively, or was modified, and to what extent, by interactions. Another important problem is the morphology: were E’s formed with their present form, symmetry and lack of fast rotation (at least in the bright baryon dominated region), or did successive mergers transfer outwards the angular momentum of merging disks? Other relevant questions may result from the consideration of central super massive black holes (SMBH), now believed to be present in all stellar spheroids, and this from the ”old days” of peak quasar activity.
The necessary constraints, or part of these, are given by the recognition of E’s at larger and larger and their statistics in comparison with other Hubble types (if traceable). If formed at relatively low redshifts (say ), following a succession of mergers, E’s should be rare or absent at distinctly larger values. In contrast, the ”monolithic’ scenario predicts that massive ellipticals, completed at after a brief and intense star formation period, are evolving passively, implying a constant comoving number density.
A large body of observations show that ellipticals were already formed at in about the same proportion as today, and have since then evolved passively. This results from studies of the Fundamental Plane, of the evolution of the color-luminosity relation or the Mg relation. Only minor events of ”recent” stellar formation are allowed for perhaps 20% of E’s, but less in rich clusters. On the other hand, the oldest known galaxy is at (Hu et al., 2002), and a few have been discovered at . Quasars are known at similar . This leaves a large gap of space to explore, for further progresses in the evolution of galaxies, including E’s.
In Section 2 we review recent photometric and spectroscopic data leading to an improved picture of the rather complex dynamical structure of ellipticals. We present briefly the 3D observations from Integral Field Spectrographs which are expected to bring major progresses when fully analyzed. We discuss the scaling relations such as the size-luminosity (or Kormendy’s) relation and the Fundamental Plane, the color-luminosity or the Mg relations, which all have important impacts upon the problems of the evolution of E’s. The empirical evidence for SMBH is also presented in this section.
Section 3 introduces the evidence for the presence of Dark Matter halos around ellipticals, and then summarizes the CDM theory of the formation of cosmic structures, including protogalactic halos, leading to the birth of galaxies through gas concentration, stellar formation and feed-back to the gas from massive stars evolution. Gas dynamics and galaxy formation are discussed in Section 4.
In Section 5, we discuss different population synthesis models (single-burst and evolutionary models) used to interpret the integrated properties of stellar populations, and to derive mean metallicities and ages at different redshifts, thus testing the formation and evolutionary scenarios of E’s, with the help of the precious clock, namely, the [Mg/Fe] ratio, provided by the theory of stellar evolution.
Finally, in Section 6 we will summarize the relevant observational and theoretical aspects concerning elliptical galaxies discussed in the present paper.
2 Observational constraints
2.1 Classical but basic photometry
The essential parameters describing a galaxy are its mass M, its total luminosity L and a suitably defined ”radius” . The ”natural” definition of is the so-called effective radius, or de Vaucouleurs’ radius, defined from the two axis and of the (nearly elliptical) isophote encircling half the total light as . A related quantity of interest is the average surface brightness within the effective radius. The total magnitudes , in one or the other of the usual pass-bands, are substitute to the luminosity.
Photometric measurements need to be corrected for extinction by the interstellar Milky Way material. The corrections have long been derived from the HI line optical depth. New dust extinction maps have recently been produced from far IR satellite data (Schlegel et al. 1998). So-called K-corrections are needed to take care of the changes of the filter pass-band in the rest spectrum of the red-shifted objects. Cosmological corrections have to be introduced in the study of distant galaxies, beginning with which decreases as . For the so-called giant and intermediate ellipticals treated here, orders of magnitude are -22.8 to -18.6 for in B light, 25 to 1.5 kpc for , L⊙ to L⊙ for L (in B light) and to M⊙ for M.
Distances are needed for the physical interpretation of photometric data. Clusters provide precious collections of galaxies at the same distance. In recent years tremendous progresses have been made in the evaluation of the distances of E’s, with the Fundamental Plane (see Section 2.6) and the technique of Surface Brightness Fluctuations (Tonry & Schneider, 1988; Tonry et al., 2001). The results of both method are compared by Blakeslee et al. (2001).
It has long been known that the essential global photometric parameters, i.e. and (or ) are intercorrelated (Kormendy 1977; Michard 1979), suggesting some standard design of these systems. The name of ”Kormendy relation” recently appeared in the literature. This question has been revisited by Capaccioli et al. (1992). These statistics clearly indicate that dwarf ellipticals (dE) are not structurally similar to normal E.
The study of the radial surface-brightness profiles of E-galaxies is of great interest for a discussion of their evolution, because it shows rather surprising regularities, which have been known for half a century (de Vaucouleurs 1948). The isophotal surface-brightness (in magnitude) follows closely the law , called de Vaucouleurs’ law, and this in a large range of , more than 10 magnitudes according to de Vaucouleurs & Capaccioli (1979). A substitute to the de Vaucouleurs’ law, but of straightforward theoretical significance, has been given by Hernquist (1990). Systematic deviations from the de Vaucouleurs law have been noted. Kormendy (1977) introduced the concept of ”tidal halos” around large ellipticals with close neighbors, a paradoxical feature of Brightest Cluster Members (or cD galaxies). It has been also known that giant ellipticals often have an enhanced envelope above the law valid for their inner regions. Small ellipticals, seemingly satellites to much larger neighbors, show profiles ”truncated” outwards below the law valid for their inner regions. Altogether the deviations from the de Vaucouleurs law correlate with luminosities.
These deviations have prompted a search for other representations of the profiles. A review is due to Cappaccioli (1988). Systematic deviations from the law may be lessened by replacing the exponent by (Sérsic 1968) with between 1 (exponential profile) and up to 10 or more. Applications of Sérsic’s formula can be found in Caon et al. (1993). As expected, the residuals are strongly reduced by adding one more free parameter in the fit! There is some correlation between the optimal values and the luminosity of the galaxies.
In summary, the law is a remarkable property of bona fide ellipticals, but one cannot expect these products of Nature to comply rigidly with the rule! Systematic deviations exist, function of the luminosity. Local perturbations may result from the presence of embedded disks in the dominant spheroid.
A variety of profiles are presented in Figure 3. They have been obtained by merging HST (high resolution) and ground based (low resolution) data. Since the chosen abscissae scale is , where is the measured de Vaucouleurs’ radius, the graphs for various galaxies following the law would be parallel straight lines. One can appreciate from Figure 3 the robustness of this law and the importance of the deviations from it. These are particularly noticeable towards the center (see below).
2.2 Core and ”power-law” nuclei
Nieto et al. (1991) already proposed to sort out E’s into two subclasses according to their central photometric profiles: one group has relatively flat and broad cores, easily resolved from high resolution ground based observations. The other displays sharp peaked profiles, remaining unresolved under the same conditions. In the first group one finds bright objects of the E class (or E) while the second contains the fainter E objects, plus a variety of not bright E. These findings have been amply confirmed by the HST observations, already in its post-launching state (Jaffe et al. 1994; Lauer et al. 1995; Faber et al. 1997), and later after installation of the correcting system (Carollo et al. 1997a, 1997b, Rest et al. 2001). The terminology of ”core-like” and ”power-law” profiles respectively are adopted here from Lauer et al. (1995). The HST profiles have been described by an ad hoc analytical law (”Nuker law”) with no less than 5 parameters (Byun et al. 1996). They have been de-projected to give the corresponding density profiles: the distinction between the two types is emphasized by the de-projection (Gebhardt et al. 1996).
In Figure 3, the two classes of central profiles are documented in the systems of abscissae. The differences are striking: the ”power-law” profiles are cusped above the law, while the ”core-like” profiles present a truncated law.
The correlations between the two classes of nuclei and other galaxies properties (i.e. luminosity, disky/boxyness and rotation velocity) and their origins are discussed by Faber et al. (1997). Most explanations of the two kind of profiles invoke central black-holes (see Sect. 2.5). Silva & Wise (1996) proposed however, that core-like nuclei could be ”flattened” by a central concentration of dust. This should produce a strong maximum of reddening, which is not present (Carollo et al. 1997a; Michard 1998c). It is rather the power-law nuclei which show a central red peak, of uncertain origin: dust concentration, or sharp metallicity increases or both.
Another interesting feature disclosed by HST images is the presence of an unresolved spike at the center of the ”flat” cores of several (but not all!) giant E’s (Forbes et al. 1995; Bower et al. 1997; Bower 1999).
2.3 Kinematics of E galaxies: global parameters
An important review paper on the ”kinematical properties of early-type galaxies” is available (Capaccioli & Longo 1994), giving precious details about the relations between the observable quantities and the actual kinematics of complex unresolved stellar systems, and also discussing the methods of data analysis. The emergent spectrum is the sum of the spectra of the stars along the line-of-sight: it may be approximated by the convolution of the spectrum of a star(s), so selected as to represent the dominant population (in terms of light output), by the line-of-sight velocity distribution (LOSVD). The problem is then to recover the LOSVD and to compare it with the one of suitable physical models of galaxy structure and dynamics.
Representing the LOSVD by a Gaussian, one obtains its width, interpreted as a ”velocity dispersion” , and its position in wavelength, which results from the line-of-sight velocity of the galaxy as a whole, plus local velocities, eventually consistent with a rotation of the object. Recently, the representation of the LOSVD by more than two parameters became feasible for observations of improved S/N ratio: two Gauss-Hermite functions and of order 3 and 4 are added to the Gaussian (van der Marel & Franx 1993; Bender et al. 1994). The term in describes an asymmetry of the LOSVD, expected for instance if two components with different velocities are superposed along the line-of-sight. The term in sharpens or flattens the LOSVD against the Gaussian. Their comparison with the calculated parameters from dynamical models reinforce significantly the observational constraints on the theory of galaxy structures.
Classical results may be summarized as follows:
a) The central velocity dispersions of E’s are rather well correlated with their luminosity: this is the Faber-Jackson relation which provided the first reliable estimator of the luminosities and distances of these objects (Faber & Jackson 1976). It is now superseded by the Fundamental Plane (see Sect, 2.6), of which it is a projection. The central values of are often used as substitute for the mass of E’s.
b) Again rotations are know for many E classified objects although much less than for the parameter. When extending in a large enough range of , the rotation velocities reach a plateau, and ”flat” circular velocities may be derived (Kronawitter et al. 2000). Recent work dealing, with a statistically significant number of ellipticals, and containing rotation as well as data have been published by Bender et al. (1994), Scodeggio et al. (1998) (aimed at the study of the FP), Mehlert et al. (2000) (Coma cluster). In a series of papers, Simien and Prugniel (1997 to 2002) extended kinematic data to faint E and dE (see also Halliday et al. 2001).
Following Binney (1978), the kinematics of a galaxy is roughly described by the anisotropy parameter . There is the mean velocity dispersion within and the mean ellipticity. This gives the ratio normalized to its value for an oblate spheroid of ellipticity supported by rotation. The striking correlations of with the morphological subclass, i.e. E, E, E, are described by Bender (1992) or in the review by de Zeeuw & Franx (1991).
The kinematics of the stellar population have been extended to large radial distances for a small number of objects and measurements outside the frontier have been made by Carollo & Danziger (1994), Gerhard et al. (1998), Kronawitter et al. (2000) and Saglia et al. (2000a).
2.4 Surprising kinematical properties
a) Minor axis rotation
After the discovery in the seventies of the surprisingly slow rotation of several ellipticals, the eighties brought two developments who made ever more ”exciting” the kinematics, hence the dynamics, of such objects. The first was the detection of a large rotational velocity along the minor axis of NGC4261 (Franx & Illingworth 1988; Davies & Birkinshaw 1988), instead of the usual major axis rotation of disks or oblate spheroids. Other cases of kinematical misalignments were soon found and interpreted as a sure evidence of triaxiality of the systems. A discussion of the then available data is due to Franx et al. (1991). The misalignment angle is defined as , where and are the apparent velocities along the two axis. It is generally near zero, as for an oblate spheroid, but cases with large values are not infrequent, exclusively among E or similar E objects (see SAURON data in Copin et al., 2001).
b) Kinematically decoupled cores
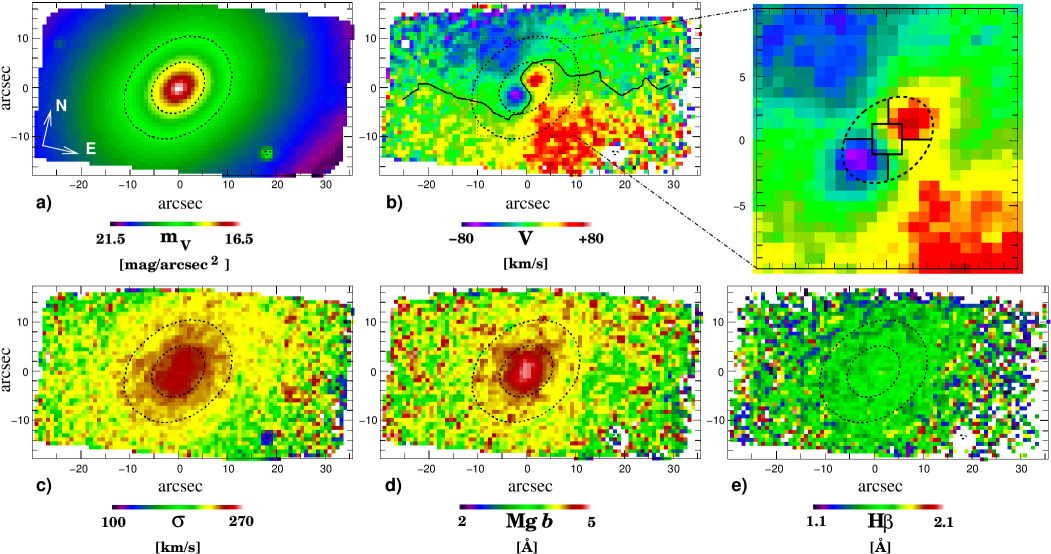
The second surprise was the finding of ”kinematically decoupled cores” (KDC) (Illingworth & Franx 1988). These are small components, near the galaxy center, which do not share the apparent rotation of its main body. They are considered as resulting from the accretion of a minor outside galaxy. A remarkable example is NGC4365, a favored target to several observers. Davies et al. (2001) give results from the SAURON Integral Field Spectrograph, with 3D maps of the velocity dispersion, the apparent radial velocity and line strengths indices for the Mgb and H lines (see Fig. 6). The central 300 x 700 pc (or 3 x 7 arcsec) rotates about the projected minor axis, and the main body of the galaxy rotates almost at right angles to this. In this case the KDC has a disk-like geometry, both from the appearance of the map and from the fact that the innermost isophotes are disky, while they become boxy at about arcsec (see Carollo et al. 1997b). Such features are not infrequent and seem to occur both in E and E objects (plus E eventually). It is curious that no local anomaly of the stellar population are associated with the KDCs. This is indicated by VI color measurements from high resolution HST frames (Carollo et al., 1997a). In the 3D maps of line strength indices and velocities from SAURON, the KDC and surroundings are found to have nearly identical stellar populations.
Integral-field spectrographs derived from the TIGER prototype of the CFHT (Bacon et al. 1995) are powerful new tools for the spectral analysis of extended sources, notably ellipticals. SAURON, for ”Spectroscopic Aerial Unit for Research on Optical Nebulae”, has been attached to the William Herschel 4.2m telescope on La Palma, and has efficiently produced detailed 3D observations of the kinematics (plus other spectral properties) of a set of 72 galaxies selected from the start (Bacon et al. 2001, de Zeeuw et al. 2002). On the other hand OASIS, for ”Optically Imaging System for Imaging Spectrography”, is associated with the adaptive optics system at the CFHT and may be therefore used for high resolution observations (Emsellem 1998; Bacon et al. 2000). A striking example of the potential of OASIS, plus the adaptive optics, is the discovery of a counter-rotating core of less than 2” diameter at the center of the E galaxy NGC4621 in the Virgo cluster (Wernli et al. 2001).
2.5 Super Massive Black Holes
Super-massive black holes (SMBH) have long been invoked to explain the energetics of quasars and Active Galactic Nuclei (AGN). The quest of relic SMBH in local present day galaxies has been plagued however, with uncertainties associated with an insufficient angular resolution in the analysis of dynamical tracers close to the massive central object (see the review bye Kormendy & Richstone (1995). In recent years, progress has been made on various crucial stages in the detection of SMBH in local E’s, or in the bulges of S0 and a few spirals.
-
•
High resolution imaging from the HST has been in systematic use, providing essential constraints on the geometry of the systems under study. The detection of minute gaseous rings around the center provided accurate Keplerian velocities about the central object, hence straightforward mass estimates (see review by Jaffe et al. 1998). For the famous active galaxy M87 (or NGC4486), the historical mass estimate of the central SMBH obtained from stellar kinematics by Sargent et al. (1978) has been rather nicely confirmed by the analysis of gaseous motions (Harms et al. 1994).
-
•
Stellar kinematics at high angular resolution were also obtained recently with the HST spectrographs, notably the Space Telescope Imaging Spectrograph (STIS). Precise line of sight velocities distributions (LOSVD) were obtained close to the central objects, and the central peak in velocity dispersion accurately mapped.
-
•
The LOSVD were analysed with elaborate dynamical models, such as the three-integrals axisymmetric models of van der Marel et al. (1998) or Gebhardt et al. (2000b), although it has been suggested that the derived SMBH masses are not terribly dependent on the choice of the dynamical model.
The specialists are now confident enough in SMBH mass estimates to correlate these with other galaxy properties. These correlation do not consider only ellipticals, but also bulges of spirals notably the Milky Way and M 31. Quoting Magorrian et al. (1998) ”a fraction of 97% of early-type galaxies have MDOs (i.e. massive dark objects) whose masses are well described by a Gaussian distribution in of mean -2.28 and standard deviation 0.51”. This is not a very tight correlation! More recently a better one has been found between SMBH masses and the galaxy velocity dispersion (averaged within the half-light radius). Gebhardt et al. (2000a) give , where is in the unit of solar masses. The scatter of is only 0.3 dex (see also Ferrarese and Merritt 2000).
Are the astrophysicists now entitled to discuss SMBHs, or should they continue to speak of MDOs, and remain prudent on the nature of the massive dark objects at the center of galaxies? When the central mass is encircled in a smaller and smaller radius, a larger and larger density is estimated, so that the only plausible physical nature of the MDO turns out to be the black hole. The study of E’s does not afford opportunities to estimate in a compelling way the densities of their MDOs. A much better case is the Milky Way, where stellar kinematics constrain the density of the MDO to more than M, ruling out other physically acceptable objects than the SBMH.
Strong constraints are also found in the analysis of H2O maser emitting rings near the nucleus of several Seyfert galaxies. Generally speaking however, the study of ”live” SMBH powering AGN (Active Galactic Nuclei) in Seyfert galaxies or quasars, relies on observable clues rather different from those in the study of the ”dead” SMBH, and is outside the scope of this review. A beautiful summary of the relations of these domains of research is in Richstone et al. (1998). The following essential conclusions are quoted from this paper: 1) SMBHs are a normal feature of the central regions of bright galaxies, particularly those with spheroids. 2) Their masses scale in rough proportion to host-galaxy spheroid mass. 3) The total mass density in SMBH is broadly consistent with the mass-equivalent energy density in the quasar light background. The association of SMBHs and spheroidal stellar systems suggests parent formation processes, probably in dense regions which collapsed early. On the other hand the ”broad consistency” in global energetics strongly suggests that present day SMBHs are indeed relics of the powerful AGNs of the ”quasar era” around to 3. There remain discrepancies with the numbers however, the number of relics being too large compared to the number of parent quasars, possibly because statistics of ancient quasars select the brightest, while the statistics of the actual SMBH select those close to our terrestrial observatories. According to the quoted authors, one way out of these difficulties is to assume a progressive ”fattening” of black holes during and after the quasar era, so that many minor ancient AGNs were too faint to enter our quasar catalogues.
The discovery of SMBH candidates in many spheroidal galaxies may further complicate the problem of the origin and evolution of these objects. On the other hand it offers a way to explain the nuclear profiles, ”core” against ”power-law”, described above. van der Marel (1999) shows that these various profiles may result from the adiabatic growth of black holes into pre-existing isothermal cores, following a scenario first analyzed by Young (1980). This simple scenario is criticized by Merritt (1998) on theoretical grounds: he notes that the isothermal core is not favored by the theories of galaxy formation, either through hierarchical clustering or collapse. The end products of these processes are adequate nests to grow a black hole and develop a steep power-law nucleus (Quinlan et al. 1995, Merritt & Quinlan 1998). For the much less abrupt core-like profiles of giant ellipticals, the coalescence of two SMBHs following a merger of their host galaxies (Ebisuzaki et al. 1991, Makino 1997), is a preferred mechanism, notably for tenants of a real ”dichotomy” between the two kinds of central spheroidal profiles (Faber et al. 1997).
2.6 The Fundamental Plane
Since the luminosity was known to be correlated with and with (Faber-Jackson relation), it is not surprising that a better correlation was found by using both observables simultaneously. The bivariate relation may be written as
| (1) |
or
| (2) |
expressing the radius or luminosity in terms of observables. Similar relations have been published simultaneously by Dressler et al. (1987) and Djorgovski & Davis (1987). Any one of these two relations define the so-called Fundamental Plane (FP) of elliptical galaxies.
The FP theoretical basis is obtained from the virial theorem which gives M, where , are suitable definitions of the radius and mean internal velocity, and G the constant of gravitation. Introducing observables and the M/L ratio, this becomes
| (3) |
where is an ad hoc factor. Assume now that M/L is a constant or a slowly varying function of the luminosity with . If E’s are built along similar models the in eq. 3 is indeed a constant. Then using the definition of one can obtain the relations (1) or (2). Note that the exponents in these equations can be expressed in terms of the slope . As the M/L ratio varies with the colour, these exponents also vary.
The value of the two-parameter relation, and the justification for the use of such a majestic vocable as Fundamental Plane, is the high quality of the fit: this might slightly be improved, by taking into account the role of rotation in the theoretical or empirical derivation of the FP (Prugniel & Simien, 1994; Bender et al., 1994). As it is, the FP has many applications and physical interpretations. Thus it offers the possibility to estimate the distances of E’s with an accuracy of about 15%. For this particular application, it is often replaced by the - relation (Dressler et al. 1987), conceptually equivalent.
The quality of the FP relation implies that the M/L ratio of E’s has only a smooth variation with L. On the other hand, the structure parameter in eq. 3 should be nearly constant. These questions have been studied first by consideration of the FP in the near IR (Pahre et al. 1995, 1998a) and later by comparisons of the FP from the U (0.35 m) to the K (2.2 m) spectral bands (Pahre et al. 1998b). It appears that metallicity variations are not sufficient to explain the changes of the FP slope with the colour. The problem has also been tackled by Prugniel and Simien (1996) who discuss the residuals from the FP against stellar populations indices (Mg2 and colours). The effects of stellar populations explain only half of the apparent variations of M/L, i. e. the exponent above. The rest of the tilt of the FP should be explained by some dependence of the rotational support and of the spatial structure on the luminosity. The authors ”conclude to a constancy of the dynamical-to-stellar mass ratio”.
Various attempts have been made to find eventual differences in the FP for galaxies in different environments: poor clusters such as Virgo and rich clusters such as Coma; central core and outskirts of Coma (Lucey et al. 1991); field and cluster ellipticals (de Carvalho & Djorgovsky 1992); cluster to cluster differences (Jrgensen et al. 1996); objects in compact groups against objects in the field or loose groups (de la Rosa et al. 2001). No salient variations in the parameters of the FP, or the dispersion about it, have been found. Prugniel et al. (1999) relate the residuals from the FP to a parameter describing the local density, and no convincing trend is present.
2.7 The baryonic content of E-galaxies
2.7.1 Star populations
Since stars cannot be resolved in any normal giant elliptical, one has to rely on integrated colors and spectra to get information about their stellar populations. The classical Johnson’s wide-band colors system has proved to be the most useful, eventually amended by the Cousins system. On the other hand, integrated spectra are described by line-indices as, for instance, that defined by the Lick Observatory. A recent compilation of Lick’s data is given by Trager et al. (1998). Colors and spectra of E’s are similar to those of late GIII or early KIII stars.
There is a remarkable correlation between colors and luminosities (or absolute magnitudes) of E’s, brighter galaxies being redder. This so-called CM relation is best defined for clusters, and its slope is maximal for the color (UV) (Bower et al. 1992a, 1992b). The CM diagram is considered to be a relation between the luminosity and the mean metallicity of the stellar population, the metallicity increasing with the luminosity. The existence of the CM relation and its small scatter represent important constraints on the formation and evolution of E’s.
The explanation in terms of metallicity variations are also adequate for relations between line-indices and luminosity (or equivalently the value). The ”best” relation occurs between Mg2 (or Mgb) and also followed by bulges of spirals (Idiart et al. 1996). There is also a fair correlation, but with an opposite slope, between the Balmer lines indices, such as Hβ and luminosity, while the Fe-lines indices are nearly uncorrelated (Worthey 1998).
Another important property of colors and line-indices in E’s is their radial variation. Colors get bluer at larger , metallicity indices become fainter, while Balmer lines become often stronger. About color gradients, one may quote the surveys of ”local” galaxies by Goudfrooij et al. (1994a), Michard (1999, 2000) and Idiart et al. (2002a).
2.7.2 Cold gas and dust
It is an essential property of E-galaxies to contain very little dust or cold gas, compared to spirals, and accordingly no present day star formation. This is perhaps a reason why astrophysicists have been always very keen on detecting ISM in ellipticals. Useful reviews are given by van Gorkom & Schiminovich (1996) about the HI, Rupen (1996) for the CO, Goudfrooij (1996) about the dust and ionized gas.
The survey by Goudfrooij et al. (1994a) deals with a complete sample (magnitude limited) of of 56 objects observed in BVI, and also in a filter isolating the H[NII] emission lines. A comparison is then possible of the occurrence, localization and amount of dust and ionized gas (Goudfrooij et al. 1994b). Quoting the authors ”The amounts of detectable dust and ionized gas is generally small, of order of dust and of ionized gas”. These small amounts are detected in roughly 50% of the ellipticals. Both gas and dust patterns tend to be centrally located, but without detailed correlation.
Another survey based upon the B-R colours of 44 nearby E’s has been published by Michard (1998a, 1998b, 1998c, 1999): it concentrates upon the differences of dust content and distribution between E and E, or between flat-core and power-law galaxies.
The HST observations have brought important new knowledge of dust occurrence and geometry in the central region of E-S0 galaxies: Lauer et al.(1995), from V light maps; van Dokkum & Franx (1995), from contrast enhanced images; Forbes et al. (1995) and Carollo et al. (1997), both from V-I maps. At improved resolution and S/N ratio, more and more minute dust features (lanes, filaments or dots) are detected, always near the center of the studied galaxies. Ellipticals with large organized dust systems, similar to those in later types, remain extremely rare, or atypical.
It has been known since the publication of data from IRAS (Infrared Astronomical Satellite) ( Knapp et al. 1989) that dust is detected in many ellipticals from their thermal radiation at 60 and 100 m. According to Goudfrooij & de Jong (1995), far-IR estimated dust masses are often larger by an order of magnitude than dust masses calculated from the study of dust lanes and patches. A diffuse dust component is postulated to bridge the gap. The problem of diffuse dust in E’s has been analyzed also by Witt et al. (1992) and Wise & Silva (1996). A discussion by Michard (2000) suggests that its effect on color gradients is not significant.
For normal early-type galaxies, the IR spectrum is in part due to the black-body radiation of cold stars (temperature near 3500 K); in part to hot dust (temperature around 300 K) presumably surrounding M giants, and to cold dust (temperature around 40 K) of doubtful localization. The Infrared Space Observatory or ISO, operational between November 1995 and April 1998, brought a wealth of new informations about all sources of IR radiation in the range 2.5-200 m. Elliptical galaxies have been relatively neglected however, in the early work from ISO data. Preliminary results are given by Fich et al. (1998), Madden & Vigroux (1999). The survey of the Virgo cluster by Boselli et al. (1998) contains only one giant elliptical. Ferrari et al. (2002) are more generous with data for 28 early-type galaxies: mid-IR spectra, hints about the distribution, estimates of ”hot dust” masses. To sum up, while the existence of ”diffuse” dust in E’s is certain, its spatial distribution remains unknown.
2.7.3 X-rays and hot gas
Strong X-rays emission was found with the Einstein X-rays Observatory from clusters of galaxies and from giant ellipticals (Forman et al. 1985; Canizares et al. 1987; Fabbiano et al. 1992). More powerful instruments, for both imagery and spectroscopy, were flown on ASCA (Awaki et al. 1994; Matsumoto et al. 1997), and on ROSAT (Davis & White 1996). Further improvements were feasible for the instruments on board of Chandra and XMM-Newton, both launched in 1999, with an angular FWHM of a few arcsec for the later and 1 arcsec for Chandra. ¿From the recent review papers by Sarazin (1997) and Loewenstein (1999) we may summarize as follows the fascinating properties of giant E’s in X-rays:
-
•
The X-rays luminosities of E’s (in the range erg/s) are correlated with their optical luminosities, but with considerable scatter (Canizares et al. 1987), and a logarithmic slope much larger than 1, i.e. .
-
•
The X-ray emission extends outwards in a large halo, with sizes of typically 5-10 .
-
•
X-rays from E’s are in part due to thermal emission from diffuse gas heated at some K or even more. Thermal equilibrium occurs between heating due to the large relative motions of the X-rays emitting stars, and radiative cooling. Incidentally, there is also a harder component due to bright stellar sources such as the X-rays binaries, which can now be individually detected with Chandra in Virgo cluster galaxies (Mushotzky et al. 2001).
-
•
The emission lines in the X-rays range allow estimates of abundances of Fe, Si and a few other elements. The results can be reconciled with optical data (Loewenstein 1999). Abundances variations with redshift can now be studied (Mushotzky & Loewenstein 1997)
The hot X-rays emitting gas which fills many bright ellipticals is fatal to dust within a short time scale! Empirical consequences have been discussed by Goudfrooij (2000), such as the anti-correlation between the masses of dust and of X-rays bright gas.
3 Cold Dark Matter Model
3.1 Evidences for the presence of Dark Matter
For more than 20 years, the contribution of massive Dark Matter halos has been used to explain the flat rotation curves of spiral galaxies, both within the optical radius and in the extended HI envelopes (Bosma 1978; Rubin et al. 1985; Sofue & Rubin 2001). The relative contribution of the stars and DM to the total mass remains uncertain, specially towards the central regions. Improved kinematics (Palunas & Williams 2000) may lead to ”no-halo” models within the optical radius, although the uncertainty in the M/L ratio of the stars leave room for some dark DM component. The situation is not the same for dwarf galaxies, where a substantial amount of dark matter is required (Hoekstra et al. 2001), with an average projected density one order of magnitude greater than that of the neutral gas. In spite of the uncertainties in the required amount of DM inside the optical radius, the rotation curves, either of spirals or dwarfs, indicate the presence of low density cores instead of the CDM cusps predicted by numerical simulations (de Blok & Bosma 2002; Gnedin & Zhao 2002; Marchesini et al. 2002).
The situation is somehow similar in the case of giant ellipticals: the variation of the M/L ratio is not sufficiently constrained, within the optical radius (typically 1 or 2 ), to ascertain eventual DM contributions. For instance, Ortega & de Freitas Pacheco (1989) constructed self-consistent hydrodynamical models for sixteen galaxies, and concluded that most of them have an increasing M/L ratio with galactocentric distance, supporting the presence of DM. Binney et al.(1990), van der Marel et al. (1990) reached an opposite conclusion. Bertin et al. (1992) interpreted the kinematical data of 10 bright ellipticals using collisionless self-consistent models and found some evidence for dark matter. More recently, Ortega et al. (1998) revisited the dynamics of a sample of ellipticals based on new kinematical data and on Jeans equations, allowing for oblate and prolate structures. Comparison of the resulting M/L ratios with values derived from evolutionary models does not seem to leave room for an important amount of DM inside the effective radius, not supporting their previous conclusions.
Such uncertainties have not been completely removed by the recent improvements in stellar kinematics (see Sect. 2.3). On the other hand, the number of E’s surrounded by HI rings is quite small, and they are generally peculiar in some respect (van Gorkom & Schiminovich, 1996). For these objects, the determination of the amount of mass in a dark halo is similar to the procedure adopted for spirals. Bertola et al. (1993) analysed five E’s combining the M/L ratio derived from dynamics of the inner ionized gas and the outer neutral ring. They found a constant M/L ratio within , becoming very large in the ring region.
Other kinematical tracers have been found useful:
a) Planetary nebulae (PN) can be recognized in the outer galaxy regions of low surface brightness, and accurate radial velocities derived from the [OIII] emission of their envelopes (Arnaboldi & Freeman 1996). Arnaboldi et al. (1996, 1998), Mendez at al. (2001) have measured PN velocities in halos of several giant galaxies, giving further dynamical support to the presence of a DM halo in those galaxies.
b) Globular clusters (GC) surrounds large galaxies in variable numbers and can be useful tracers of the halo potential (Cohen and Ryzhov 1997; Kissler-Patig et al. 1998, 1999; Minniti et al. 1998).
In several cases, the information from two or more of the above techniques could be brought together to constrain dynamical models. Several examples of increasing velocity dispersion at large galactocentric distances have been found, implying an increasing outwards M/L ratio due to a DM envelope (Kronawitter et al. 2000). A discussion of the data by Gerhard and al. (2001), indicates a variation of M/L with L in agreement with the ”tilt” of the Fundamental Plane.
An important method to study DM in ellipticals is based on the existence of X-ray halos (see Section 2.7.2). The confinement of these hot X-ray coronae around E galaxies requires a massive halo (Forman et al. 1985; Fabbiano 1989), indicating M/L ratios in the range 10-80. Buote & Canizares (1998) noticed a different isophotal geometry for X-rays and optical light in NGC 720. The X-ray isophotes are more elongated and their major axes are misaligned with respect to the optical. If matter were distributed as in the optical light, it could not produce the observed ellipticities of the X-ray isophotes and they interpreted this effect as a consequence of the presence of a massive DM halo. Also from optical and X-ray data, Bahcall et al. (1995) concluded that the M/L ratio increases with radius up to values of about 100-150 M for a sample of E’s, these values being comparable with those found for clusters. More recent studies of microlensing effects or Einstein arcs in clusters indicate mean ratios of about 350, supporting a substantial amount of diffuse DM in clusters.
3.2 Formation of large-scale structures and dark matter halos
In the current scenario of structure formation, galaxies are assumed to form, in a dissipative process, by cooling and condensation of gas, within dark matter halos (White & Rees 1978; Blumenthal et al. 1984; White & Frenk 1991). The halos themselves form and evolve by purely gravitational mechanism. Thus, on scales where the gas pressure is subdominant to gravity, the evolution of galaxies is governed by the evolution of the underlying halos.
It was initially believed that there exists two ”contradictory” mechanisms for the formation of structures in the Universe: top-down scenario consistent with a hot dark matter model and a hierarchical scenario in a cold dark matter (CDM) Universe. In the first scenario (Zel’dovich 1970) flattened pancake-like structures form first on large-scales (scales of order ) and then fragment into smaller clumps inside which galaxies are seeded. In the hierarchical scenario (Peebles 1965, 1972) small objects would form first, nonlinearly interact and merge to form larger halos which can then host galaxies. It is now understood that CDM model contains enough power on large scales to be consistent with the first scenario as well as with the second one. Large-scale redshift surveys indicate that galaxies are distributed on filamentary-type structures (Bharadwaj et al. 2000). Numerical simulations confirm that networks of giant walls (Zel’dovich pancakes) joined by filaments, joined themselves at massive nodes, form on large scales at high redshifts in a CDM Universe. However, at much smaller scales the dynamics are nonlinear and virialized halos continuously form by gravitational collapse and grow by accretion and merger.
On large scales, the evolution of dark matter fluctuations is studied commonly using the equations of hydrodynamics for collisionless fluid. To fix ideas, we consider an Einstein-de Sitter Universe with . This provides a convenient context within which we can discuss general concepts of structure formation. In the comoving frame of an Einstein-de Sitter Universe, the continuity, Euler and Poisson equations are respectively written as,
| (4) |
where the density contrast is between the local density and the background density , is the scale factor and is related to the peculiar velocity by and is related to the peculiar gravitational potential by . In the linear regime (i.e. when ) this system of equations is solved analytically, yielding for the growing mode,
| (5) |
where is the density contrast at the initial time . Thus, since the scale factor, , grows as , density contrast grows algebraically in the linear regime (on large scales).
On scales where the dynamics are still linear, the gravitational and velocity potential are equivalent; i.e. the right-hand-side of Euler equation in (4) vanishes. This means that the motion of dark matter particles in this time frame (note that we have used the scale factor as our time variable in eqs.(4) is basically inertial. Zel’dovich used this result to demonstrate the formation of caustics (regions of infinite density bounding structures such as pancakes) in self-gravitating systems; an element of dark matter fluid at an initial position moves with its initial velocity, , along straight line trajectories until it crosses another element at which point a caustic forms. The continuity equation in (4) can also be written as
| (6) |
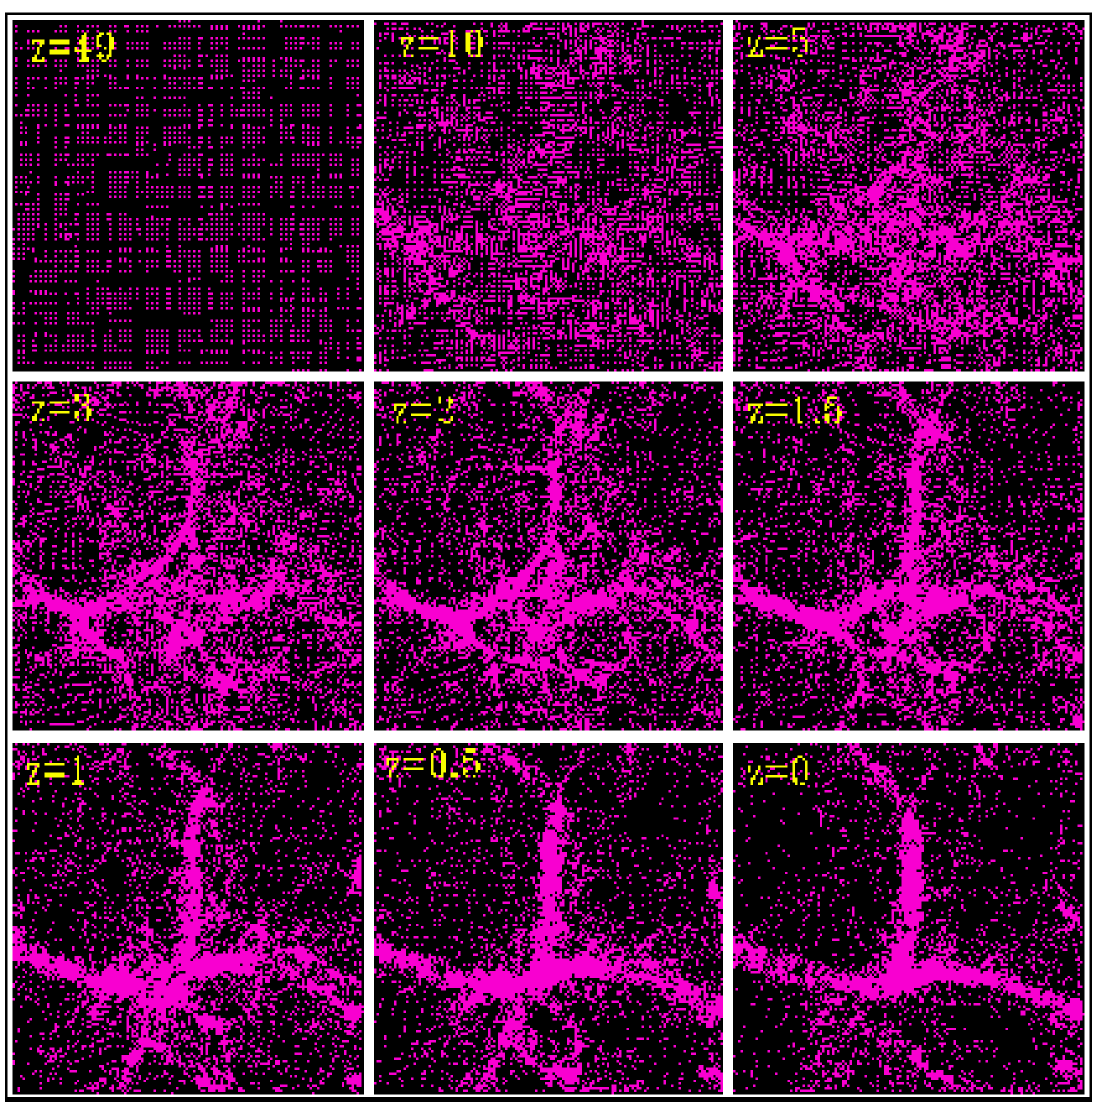
where is the initial density at the initial particle position and is the density at the present particle position . The density field becomes infinite (i.e. caustics form) when the determinant in the above expression vanishes. The determinant can vanish due to collapses along one, two or all three axes results in the formation of pancakes, filaments and nodes respectively. Numerical N-body simulations confirm the formation of such a network of structures (see Fig.8) on large scales. The formation of dark matter halos has been related to singularities in catastrophe theory (Arnold 1986) and also to the maxima of the smallest eigenvalue (Shandarin & Klypin 1984).
In a cosmological context, bound dark matter halos form within the aforementioned large-scale network where the density within a specific volume becomes higher than a critical density. Therefore, typically galaxies are expected to form in the high density nodes, even though early-type and faint dwarf galaxies can also form in overdense filaments.
The criteria for the formation of dark matter halos is best understood within a spherical model. Although far from spherical, typical dark matter halos can be well-described by this simple approach. Place a sphere of radius randomly on fig. 8 at say redshift 10 and assume a perturbation of uniform density, namely a top hat model. As the Universe expands, because of its higher density the matter inside the sphere is decelerated more than that outside, further increasing the density contrast. Eventually, it ceases expanding altogether and turns around to recollapse. This event marks the transition to the nonlinear regime and occurs at a time (when in expression (5)
| (7) |
If the collapse remains spherically symmetric, the central density becomes infinite at a time . Therefore, the linear density contrast at the time of collapse is
| (8) |
Since in Einstein-de Sitter Universe the density contrast grows as (using in eq. (5)) one infers from the above expression that, for example, a region of density contrast at the time of decoupling has just collapsed to from a bound halo.
The number of halos within a given mass range at a given redshift can be found by using Press-Schechter theory (Press & Schechter 1974). In the CDM models the density fluctuation at decoupling is a Gaussian-distributed field. Thus, within our randomly-placed spherical window, the probability that the density contrast exceeds the critical value is
| (9) |
where the variance
| (10) |
is the rms mass fluctuation of the linear density field extrapolated to when filtered by the window function on a spatial scale containing mass , and is the Fourier transform of the density contrast. The results weakly depend on the window function which is often taken to be a sharp k-space or a top hat filter. Expression (9) gives the commulative probability of forming collapsed objects with any mass. However, we are interested in the differential probability which gives the number of halos within a particular mass range. The number of halos, in the mass interval is
| (11) |
where the ”fudge” factor multiplying the left-hand-side was originally inserted by hand to ensure the right normalization for the total probability (Press & Schechter 1974). The halo mass function depends on redshift through the variance . For a scale-invariant power spectrum, , the variance can be written as where , and the characteristic mass increases with decreasing redshift and is defined by . Hence, the mass spectrum of halos at any given time has the analytic form
| (12) |
The Press-Schechter mass function is universal: the shape of the distribution function is independent of the initial mass function, redshift and cosmological parameters. In spite of its simplicity and various unjustified assumptions, Press-Schechter theory remains a reliable and influential analytic method for calculating the mass function because of its remarkable success when tested against numerical N-body simulations.
Press and Schechter originally developed their theory to describe galaxy formation by hierarchical clustering. Subsequently, using a simplified version of the mass function, Schechter (1976) constructed the fitting formula
| (13) |
for the galaxy luminosity function, where and are the characteristic luminosity function and luminosity. It is clear that mass and luminosity functions contain the same information as long as one knows the value of . Thus, assuming a constant mass to light ratio for galaxies, one can directly compare the mass function (12) to the observed luminosity function (13). For small masses, the predicted slope of the mass function is a poor fit to the power-law tail of the galaxy luminosity function, whose slope depends on the galaxy colour selection and varies between in the blue and in the red end of the spectrum. Thus, hierarchical models over-predicts significantly the number of satellite galaxies (e.g. of the satellites of milky way predicted by this model have not been observed).
In arriving at the Press-Schechter mass function, we have overlooked the fact that a halo can contain smaller sub-halos, which is referred to as the cloud-in-cloud (CIC) problem. The CIC problem has been dealt with in an extension of Press-Schechter theory (Bond et al. 1991). In the extended theory the factor of in (11) is derived naturally and the agreement between the predicted and observed luminosity functions at the faint end of the spectrum is improved, since the number of low-mass objects diminishes due to merger (White and Frenk 1991). Recently, a different fitting function has been obtained directly from numerical simulation results (Sheth and Tormen 1999). The discrepancy between theory and simulation can be due to the assumption that objects collapse spherically in the Press-Schechter theory. Indeed, it has been shown that this discrepancy reduces substantially if bound structures are assumed to form from an ellipsoidal, rather than a spherical, collapse (Sheth et al. 2001).
3.3 Density profile of dark matter halos
It is generally believed that galaxy rotation curves depends on the density profile of dark matter halos. Analytic evaluation of the halo density profile goes back to the work of Gott (1975) and Gunn (1977) who established that gravitational collapse could lead to the formation of virialized systems with almost isothermal density profile (). Their work was based on the assumption that halos form by accretion or secondary infall of matter onto an initially overdense perturbation. If infall produces density profile as shallow as , then the flat rotation curves of disk galaxies and the related observation of increasing on large scales might thereby be explained. A somewhat steeper profile resulting from infall also explain the Hubble law light profile of elliptical galaxies (Gott 1975). Further refinement was made (Bertschinger 1985) and it was shown analytically that the secondary infall approaches a self-similar form, whose exact behavior depends on the central boundary conditions and on the kind of gas; if there is no central black hole, the form proposed by Gott & Gunn prevails, otherwise the density profile has the power-law form .
That the halo profile should vary from one cosmological model to another was proposed later on (Hoffman & Shaham 1985). Approximately flat circular velocities were then obtained for and (where is the spectral index, see section above expression (12). This provided a strong support for the then fashionable CDM model where at the galactic scale the index of the power-spectrum was (Blumenthal et al. 1984). It therefore became customary to model virialized halos by isothermal spheres characterized by two parameters; a velocity dispersion and a core radius. Later on, in a high resolution simulation of a galaxy-sized CDM halo, surprisingly, it was found that the density profile could be singular even at very small scales (Dubinski & Carlberg 1991) and well-approximated by the model proposed for the elliptical galaxies (Hernquist 1990) for which in the inner parts, down to the smallest resolved scale, kpc. Further on, it was shown (Navarro et al. 1996, 1997) that the spherically-averaged equilibrium density profiles of CDM halos of all masses can be fitted by the formula
| (14) |
where is this case , is a scale radius where the profile changes shape and is a characteristic density. Although, this profile was originally found for a standard CDM model, it turned out that (14) provides an excellent fit to halo density profile from other cosmological models (Cole & Lacey 1996). Expression (14) is now assumed to be a universal two-parameter function describing the profile of dark matter halos which is independent of the halo mass, redshift, the initial density fluctuation spectrum and the values of the cosmological parameters.
Therefore, at small radii, the results of numerical simulations indicate that the density profile (14) might be cuspy without the presence of a central core. Although an isothermal profile at large radii agrees with the galaxy rotation curves, there are controversies as whether a cuspy profile near the centre is in accordance with various observations such as the rotation-curve of well-studied gas-rich dwarf spirals (Flores & Primack 1994). In addition, it has been argued that the radial arcs, require a flat core in the cluster density profile, in apparent contradiction with a singular density profile (Mellier et al. 1993). Subsequent independent higher-resolution simulations (Fukushige & Makino 1997; Moore et al. 1998) have confirmed the presence of a central cusp, but a shallower density profile () has been obtained at small radii which might resolve some of the aforementioned problems.
4 Galaxy formation
Galaxy formation is a complex process in which not only gravity, discussed in the previous sections, but also gas dynamics, chemistry and turbulence play crucial rôles. We still do not have a clear understanding of galaxy formation and the reason for this predicament is that we do not yet have a fundamental theory of star formation. Most theoretical studies in this field are based on phenomenological arguments and numerical simulations. Among the different processes involved in galaxy formation are those responsible for heat balance of the gas: shock heating and radiative cooling within collapsing dark matter halos, the subsequent transformation of cold gas into stars and the regulation of star formation by feedback from stellar winds and supernovae. Application of CDM theory at the galaxy scale is rather difficult and most results are based on numerical studies which are mainly either direct simulations or semi-analytic modelings of galaxy formation. In the first approach the gravitational and hydrodynamical equations are solved explicitly using various types of numerical codes (e.g. Katz et al. 1992). In the second approach, the evolution of baryonic gas is calculated using simple analytic models while the evolution of dark matter is evaluated using numerical N-body simulations (White & Frenk 1991) or a Monte Carlo techniques in which one studies the merger tree of dark matter halos (Cole et al. 1994) .
4.1 Heating & cooling of gas
During the collapse of a dark matter halo, the baryonic gas is supposed to be shock-heated, or undergo adiabatic compression depending on the halo mass, to the virial temperature of the host halo, given by
| (15) |
where is the total mass contained inside the virial radius which is usually taken to be half of the initial turn-around radius, is the molecular mass and is the mass of hydrogen atom. Typically , where and .
To form stars the gas has to cool. The characteristic cooling time, defined as the ratio of the thermal energy density to the cooling rate per unit volume , is
| (16) |
where is the density of the gas, is the metallicity and is the cooling function, normally taken from tabulated values (e.g. Sutherland & Dopita 1993). A second constraint on star formation is imposed by the dynamical time , which has to be longer than the characteristic cooling time. If we suppose that the gas has a primordial chemical composition, i.e. , then the cooling process is essentially due to bremsstrahlung and the cooling function is proportional to . In this case, equating both timescales one obtains a critical density which for the above example gives a temperature of or g cm -3.
If we assume, in a first approximation, that baryon distribution follows the dark matter distribution, then which gives a critical baryon mass of
| (17) |
corresponding to a dynamical time of where is the Hubble constant. Thus, only fragments heavier than the above mass can cool fast enough to fragment and form stars during gravitational collapse.
Star formation converts gas into luminous matter and at the same time affects the physical state of surrounding gas, since supernova explosion and young stars inject energy and metals out of the galactic disc in the form of a hot wind. The latter acts as a feedback process which regulates the star formation rate. In addition, the injected metals enrichen both the cold star-forming gas and the surrounding diffuse hot halo gas. Thus, the later evolution of galaxies depends strongly on when the first stars form because they can reionize the intergalactic medium (at ) and enrichen it with metals, affecting the cooling-heating balance. Metals increase the cooling efficiency, decreasing the gas cooling time and increasing the star formation rate. In the hierarchical approach, small objects form first and, if constituted only of primordial material, the cooling timescale may be longer than the Hubble timescale, being one of the problems in this scenario.
4.2 Angular momentum and morphology
Apart from the clear difference in their stellar populations, the other difference between spiral disks and ellipsoids is that the former are supported against gravity by rotation, whereas for the latter it is primarily the pressure of the anisotropic stellar orbits that is responsible. The significance of rotation may be quantified by a dimensionless spin parameter which is the ratio between the observed angular velocity and the angular velocity which would be required to support the galaxy by rotation alone:
| (18) |
where is the binding energy and is the angular momentum. The spin parameter can be as high as for spirals and only for ellipticals.
A physical explanation of these values remains a major unresolved problem. Recent N-body simulations show that in the absence of star formation, protogalactic gas loses much of its angular momentum as it cools into pregalactic fragments that subsequently merge, producing disks that rotate much too slowly (Navarro et al. 1995; Navarro & Steinmetz 1997) which is a difficulty concerning the possible formation of S0’s and E’s from the merger of spirals.
A possible but poorly-understood solution is feedback, briefly discussed previously, which can prevent the gas from cooling into dense fragments. Furthermore, the Kelvin circulation theorem guarantees that in the absence of dissipation, an initially irrotational velocity field remains irrotational. Earlier on we have seen that on large scales motions of self-gravitating particles are in the form of a potential-flow which has zero vorticity.
A possible origin for the rotation of galaxies was suggested, for the first time, by Hoyle (Hoyle 1949). In his model the acquisition of angular momentum is attributed to the tidal action of protogalactic objects around it, at the epoch when the protogalaxy is just about to form a galaxy. One assumes that the initial density field consists of non-spherical lumps with mass and density contrast . The total torque, , produced on a clumps, which is roughly taken as a dipole, from another one at a distance of is where as before is the scale factor. In the linear regime and hence the torque remains constant and the angular momentum grows linearly with time (). To obtain the binding energy once again we invoke our simple spherical model. We know the density contrast at the time of collapse is . Since the mass of the object is , this gives the proper radius of the object at turn around in terms of which the binding energy can be written . Let us assume that the object has an overdensity then we obtain for the dimensionless spin parameter
| (19) |
which is in very good agreement with that of ellipticals but is too low to account for the angular momentum spiral galaxies. But how can one account such morphological segregation ? A possible explanation is that ellipticals formed earlier when the universe was denser and angular momentum smaller. An alternative explanation frequently used in CDM hierarchical scenario, is that spirals formed first and ellipticals formed from mergings of the spirals. This might seem to be plausible given that ellipticals are usually observed in the dense regions, but as we shall see later, there are severe observational evidences disfavoring this picture.
It is worth commenting that dissipative effects, neglected in the tidal picture, might be important factors in the explanation of the origin of the angular momentum and its morphological dependence. However, dissipative mechanisms are complex processes and so far rather poorly understood. Although, angular momentum is approximately conserved during baryon infall and disk accretion, the numerical simulations (with CDM model) show that most of the angular momentum is actually lost to the dark matter halo. The clumpiness (existence of substructure) induces strong angular momentum transfer via tidal torquing and dynamical friction from the dissipating baryons to energy-conserving collisionless dark matter. The resulting disk therefore has very little specific angular momentum (Navarro & Steinmetz 2000). A possible solution is feedback by supernova explosion which would inject angular momentum into infalling baryons, which however, leads to significant delay in the formation of disks.
4.3 Galaxy mergers
We have already discussed that during their evolution dark matter halos merge and form larger halos with masses which can host the galaxies. However, there is a second important merger event and that is the merger of the galaxies themselves. In hierarchical models of galaxy formation, it is normally assumed that when dark matter halos merge, the most massive galaxy automatically becomes the central galaxy in the new halo while the other galaxies become satellite galaxies orbiting within dark matter halo. The orbits of these satellite galaxies will gradually decay as energy and angular momentum are lost via dynamical friction to halo material. Thus eventually the satellite galaxies will spiral in and merge with the central galaxy.
In these models, the galaxy morphologies are ascribed to the particular merger history and accretion events that galaxies experience during their assembly in the Universe. In this model, disks are envisioned to form as the result of gas accreted smoothly from the intergalactic medium (Katz & Gunn 1991) whereas the primary route by which elliptical galaxies and the bulge components of spiral galaxies form is through major merger events where disks are thrown together and mixed violently on a short timescale (Toomre 1977). Some numerical N-body simulations have shown that merger of galaxies of comparable masses (major mergers) result in the formation of elliptical galaxies (Barnes 1988).
We comment that one can have a monolithic scenario of galaxy formation which accommodates the merger of halos but not that of the galaxies. For this, collisions between halos must not be head-on and the dynamical friction timescale between baryonic and dark matter should be larger than Hubble time.
4.4 The epoch of galaxy formation
The epoch of formation of a galaxy is usually defined as the redshift by when more than half of its present mass had been assembled within a sphere of radius kpc.
As we have mentioned earlier, the main competing beliefs for the epoch of galaxy formation are monolithic (high-redshift formation time) and hierarchical (low-redshift formation time). The simplest possibility for star formation epoch is that the baryonic gas turned into star at the very early stage of the collapse of dark matter. There would then be no segregation between stars and dark matter, since stars would behave as collisionless particles. It was then argued that metal-poor stars in the solar neighborhood have very eccentric orbits and hence must have formed in a time short compared to the collapse time, such that their orbits mixed collisionlessly (Eggen et al. 1962). This is one simple description of the monolithic scenario.
Application of CDM theory at the galaxy scale is rather difficult and most results are based on numerical studies which are mainly either direct simulations or semi-analytic modelings of galaxy formation. In the first approach the gravitational and hydrodynamical equations are solved explicitly using various types of numerical codes (e.g. Katz et al. 1992). In the second approach, the evolution of baryonic gas is calculated using simple analytic models while the evolution of dark matter is evaluated using numerical N-body simulations (White & Frenk 1991) or a Monte Carlo techniques in which one studies the merger tree of dark matter halos (Cole et al. 1994) .
A tight upper-bound on the formation redshift of galaxies can be obtained by using again our simple spherical model for a protogalaxy of radius . A protogalaxy can only be formed when its mean average density, , is higher than the mean background density . Dynamical relaxation after formation increases the internal energy of the stars in the protogalaxy. Thus a reasonable bound on the circular velocity, , (in the case of a disk system) or on the dispersion velocity, , (in the case of a ellipsoidal system) is the present value for the bright galaxies. Using , we get the ratio
| (20) |
which has to be larger than unity at the formation time. For a spherical model this ratio can be estimated easily. The proper radius of the spherical shell containing mass has the parametric form (Peebles 1980)
| (21) |
where . The spherical shell initially expands with the background while decelerating more due to its higher density, until it reaches the maximum radius at and turns around and collapses. In Einstein de-Sitter Universe the background density falls as , and hence at the time of maximum expansion the ratio
| (22) |
is obtained. Equating this ratio with (20) and for a circular (dispersion) velocity of and kpc we obtain
| (23) |
Thus, for Universe, bright spheroids of galaxies could be in place at redshift of about .
Thus, arguments such as above admit the possibility that galaxy formation could occur relatively early at redshifts up to . However, in CDM models galaxies are expected to form at redshifts much lower than this. One reason for this is that the clustering pattern of galaxies, as measured by two-point correlation evolves rapidly with time in Einstein-de Sitter Universe. If galaxies were to form at then one would expect a drastic steepening of the slope of the correlation function which is incompatible with observations.
5 Stellar populations and chemical evolution
5.1 Stellar population synthesis and applications
An important point should be emphasized: the interpretation of the integrated colors or line indices of complex stellar populations, requires necessarily the use of models. Two main ”schools” have been practicing this exercise in the past years: the first use single stellar population (SSP) models, the second evolutionary models.
SSP models are straightforward applications of the theory of stellar evolution. Given an initial mass function (IMF) and chemical composition, the theory allows to calculate the time evolution of such a population and the corresponding spectral properties are obtained from the available stellar ”library” (theoretical or empirical). The uncertainties in such models were discussed by Charlot et al. (1996). The comparison with the observed indices (color or lines) give constraints on the input parameters (age and metallicity in the simplest case). A popular series of SSP models by Worthey (1994) has been extended by Trager et al. (2000b) to take into account non-solar ratios of elements to Fe, a bias in usual spectral libraries first noted by Borges et al. (1995).
Evolutionary models are, in general, of the ”one-layer” type including (or not) mass loss from galactic winds, or infall of matter from the intergalactic medium. The star formation begins when a critical gas mass is attained (see Section 4), corresponding to a galactic age of about 15 Gyr. The population mix is calculated, as a function of time, by summing the SSP models representative of successive stellar generations: these are controlled by the amount of residual gas available for star formation, while their chemical composition results from the progressive enrichment of the ISM in ”metals” by gas loss from stars, notably supernovae. Evolutionary models have been calculated by Bressan et al. (1996); de Freitas Pacheco (1996a); Vazdekis et al. (1996); Kodama & Arimoto (1997). The model used by Idiart et al. (2002b) is an upgrade of the quoted one by de Freitas Pacheco (1996a). To obtain representative populations for E’s of various masses, one selects input parameters, i.e., the star formation efficiency and the IMF, through an iterative procedure, in such a way as to reproduce one fundamental property of E’s (or eventually several). For instance, in the quoted models by Idiart et al. (2000b) models are fitted, through an iterative procedure, to the color-magnitude diagram (U-V) versus of ellipticals in the Coma and Virgo clusters. The required star formation efficiency should then be an increasing function of the galactic mass, and the slope of the IMF should be slightly flatter in brighter objects.
With the advent of fast computers and powerful simulation techniques, there has been considerable progress in describing the growth of structures and in reproducing some of the basic properties of galaxies and their evolution. In the case of E’s, codes including Smooth Particle Hydrodynamics and N-body Tree, have been used to explore whether the formation of E-galaxies inside non-rotating virialized DM halos leads to results compatible with actual data. Models along these lines, including heating and cooling (see Section 4.1), energy feedback and chemical evolution have been developed (Chiosi & Carraro 2002), indicating that they can reproduce the basic observed properties of E-galaxies as the color-magnitude relation or the ratio versus central velocity dispersion. These simulations suggest that massive E’s form the bulk of the stars in a short timescale, whereas low-mass E’s have a complex star formation history: in other words, star formation is early and ”monolithic” in high initial density systems, irregular and intermittent in low initial density ones. With the models by Kawata (2001), the low ratio observed in bright ellipticals as well as their brightness profile ( the law), can be reproduced adequately by simulations considering the clustering of subclumps caused by initial small-scale density fluctuations. This phenomenon leads to angular momentum transfer from the baryon component to the DM, resulting in a nearly spherical system supported by random motions. On the other hand, N-body/SPH simulations eventually predict that the morphology (see Section 4.2) is a ”transient” phenomenon within the lifetime of a galaxy and is determined basically by the mode of gas accretion (Steinmetz & Navarro 2002). Disks arise from the smooth deposition of cold gas at the center of DM halos while spheroids result from the stirring of preexisting disks during mergers.
5.2 Inferences from models
Age and metallicity effects can be disentangled using SSP models if different indices (colors or/and spectral) are used and if the considered stellar system is really single (de Freitas Pacheco 1997, 1998). Elliptical galaxies are certainly not single systems. If, on the one hand the age range of the population mix constituting the galaxy is probably quite narrow (3-4 Gyr), a reason invoked to justify the use of SSP models, on the other hand the build up of chemical elements requires successive stellar generations, producing a metallicity spread adequately described by population mix models.
Nevertheless, SSP models have been successfully used to get insight in the chemistry of ellipticals. A summary of analysis made on different mean elemental abundances in E’s can be found in Worthey (1998).
In the last decade many studies suggested that the mean [Mg/Fe] ratio in bright ellipticals, derived from the comparison between observed and synthetic indices, are non-solar (Worthey et al. 1992; Carollo & Danziger 1994; de Freitas Pacheco 1996a). The resulting enhanced [Mg/Fe] ratio could simply be the consequence of a short period of star formation activity, where the bulk of the stellar population is formed, with successive stellar generations being enriched mainly by the ejecta of type II supernovae (SNII). The iron-rich ejecta of SNIa begin to contaminate the medium later, about 0.8-1.0 Gyr after the onset of the star formation process, and only a small fraction of the total stellar population can be enriched by these events, producing stars with lower [Mg/Fe] ratios, i.e. near solar.
Using SSP models, Trager et al. (2000b) derived from the indices H, Mgb and an average (near center) metallicity [Z/H], for a sample of 39 E’s. Kobayashi & Arimoto (1999) used the same models (but with solar [Mg/Fe]) and the indices and Mg2 (Mgb) to obtain mean metallicities for a sample of 80 early-type galaxies. The resulting values are in the range , with the abundances derived from the index being systematically lower than those estimated from the Mg2 (Mgb) index.
Idiart et al. (2002a) obtained central colors (UBVRI) and gradients for a sample of 40 early-type galaxies, and derived central and mean metallicities using these data and evolutionary models described above (Idiart et al 2002b). They find mean metallicities in the range , with a sample average [Fe/H](rmsd). Central values are about dex higher with nearly the same dispersion. These results suggest that ellipticals have a narrow range of metallicities, varying within a factor of three, while their masses vary within two orders of magnitude (from to ), according to the models of the aforementioned authors.
While both SSP and evolutionary models tend to agree in the determination of the [Fe/H] and [/Fe] ratios, there are still disagreements in age determinations. Trager et al. (2000a) determine ”SSP-equivalent ages”, together with metallicities and [/Fe] enhancements from three line indices, and accept real age excursions from about 2 to 24 Gyr.
Colours and spectral indices from evolutionary models of ellipticals, including gas inflow and outflow were computed by Bressan et al. (1996), who concluded that E-galaxies do not follow a pure sequence either of age or metallicity: galaxies of different masses have suffered different star formation histories, in spite of having rather old (13-15 Gyr) populations. Kodama & Arimoto (1997) considered two model sequences (age and metallicity sequences), in which the parameters were adjusted in order to fit the CM diagram of ellipticals in Coma. They compared the evolution of both CM sequences up to redshifts and concluded that the age sequence deviates significantly from observations already at , supporting the view that the CM diagram is primarily a metallicity variation with luminosity. Similar conclusions were reached by Tamura et al. (2000) from the analysis of E’s in the Hubble Deep Field North, as well as by Saglia et al. (2000b), who investigated the evolution of colour gradients with the redshift, by comparing values in the cluster CL0949+44 () with those derived for local ellipticals.
In the series of evolutionary models published by Idiart et al (2002b), the star formation activity begins about 15 Gyr ago and the mean ages of the population mix vary from 12.5 to 13 Gyr in the full range of galaxy masses. In these old populations, the bulk of the stars were formed within a time interval of about 2 Gyr, or at an epoch 2.5 -3.0 (for a world model with = 0.3 , = 0.7 and = 65 km/s/Mpc). The calculated spectral properties, notably the relations between the H and other line or color indices, are in general agreement with observed data. More recently, Waddington et al. (2002) obtained images with the HST of two previously known elliptical galaxies (53W069 and 53W091) at z 1.5, having old stellar populations. Their observations indicate that the rest frame (U-V) colour gradient of 53W069 is consistent with that of present-day E’s, suggesting that the bulk of the stars were formed on a very short timescale at z 5. The other object has a colour gradient larger than those observed in ellipticals at z 1, but the authors concluded that also in that E-galaxy the bulk of the stellar population was formed in a high-redshift short star formation burst. Waddington et al. concluded that both galaxies are ”passively” evolving (see Section 5.3) into ordinary ellipticals by the present day.
5.3 Cosmic evolution
In this section we review the main sources of information presently available to guide our efforts towards a better understanding of the formation and evolution of E-galaxies.
In the hierarchical scenario, massive E’s form at relatively low redshifts () through the merging of spiral galaxies, so that older ellipticals should be rare at higher redshifts. In contrast, the monolithic scenario predicts that massive ellipticals formed at , after a brief and intense star formation period and are evolving passively, implying a constant comoving number density. In this case, a substantial number of objects with the integrated colours and spectra of old populations is expected to be detected at . There has been however a number of discrepant results: some authors found a clear deficit of old objects at (Stiavelli & Treu 2000; Rodighiero et al. 2001), while others found evidence for a constant comoving density (Scodeggio & Silva 2000; Im et al. 2001). ¿From near IR surveys, Extremely Red Objects (EROs) have been known for years, and their identification with either star forming dusty galaxies or old early-type galaxies with passive evolution has been proposed. Recent work, using relatively large survey fields, aimed at choosing between the two possibilities using the RK colors, spectra and clustering properties. It appears that both proposed types of EROs occur in roughly equal proportions at with an age of perhaps 3 Gyr for the ”old EROs”, corresponding to formation at (Cimatti et al., 2002a). Near , the old E’s are much more strongly clustered (Daddi et al., 2002). From their statistics for 480 K-band selected objects, with redshifts up to 1.5 or more, Cimatti et al. (2002b) attempt to test current galaxy formation models, and favor the pure luminosity evolution of old galaxies against hierarchical merging evolution.
The Fundamental Plane is still ”fundamental” at large . The small scatter observed in the M/L ratio derived from the FP imposes tight constraints on the dynamics, IMF and ages of the stellar populations (Renzini & Ciotti 1993). Jrgensen et al. (1999) have obtained photometric and kinematic data and derived the FP for two clusters near . They compare their results with those of van Dokkum & Franx (1996), and Kelson et al. (1997) for still more distant clusters, and find a smooth decrease of M/L with . The results are consistent with passive evolution of a stellar population formed at (for ). This agrees with the conclusions reached by using other clues of evolution, i.e. the Kormendy relation for Ziegler et al. (1999), and the colour or line-indices relations. The work of Pahre et al. (2001) again demonstrates that the SB intercept of the FP, the rest frame U-V colour and the absorption line strengths, all evolve passively in the range covered by the data.
The small scatter observed in the Mg2 - (or colour - ) relation suggests that the bulk of stars of luminous ellipticals must be rather old, and formed in a short time interval of the order of Gyr. In the evolutionary models by Idiart et al. (2002b), the more massive galaxies have a higher star formation efficiency and therefore the slope of the relation Mg2 - increases slightly with the redshift. In Fig. 10 the plot of this relation for different redshifts clearly demonstrates this effect.
Mgb indices of E’s in three clusters at intermediate redshifts (z 0.37) were compared to those in nearby (z 0) clusters by Ziegler & Bender (1997). These authors found a mean difference Å between both samples, compatible with a ”passive” evolution. In fact, using their data on the velocity dispersion and theoretical Mg2 - relations, the predicted mean difference is 0.34 Å(Mg), consistent with observations. Moreover a brightening of about -0.5 mag at fixed is observed in the B-magnitude, also consistent with the theoretically expected increase of about -0.44 mag in the V filter.
The variation of the CM diagram in clusters has been studied up to by Stanford et al. (1995, 1998). The results are again explained by the passive evolution of a population formed at . van Dokkum et al. (2000) have obtained extensive color data for E’s in a cluster at , concluding by a passive evolution of a population mix older than .
The rôle played by the -elements, represented mainly by magnesium, in the evolution of early-type galaxies was recently reviewed by Thomas et al. (2002). They use SSP models with variable [/Fe] ratios to analyze line-indices in a sample of 126 field and cluster local E-galaxies, and find a correlation between the ratio and the velocity dispersion (see also de Freitas Pacheco 1996), and also between this ratio and the estimated mean population age. They conclude that the more massive the galaxy, the shorter is its star formation scale, and the higher is the redshift of the bulk of the star formation. These findings are not compatible with the predictions of hierarchical models of galaxy formation. These conclusions are in line with evolutionary models as presented by Idiart et al (2000b).
The morphological classification of galaxies, extended to large from HST images, leads to rather ambiguous results. This is in part due to the intrinsic difficulty of this exercise, with different observers obtaining divergent results from the same data (Fabricant et al. 2000). Dressler et al. (1997) found a relative high fraction of spirals accompanied by a low fraction of S0’s in clusters within the redshift range , concluding that the former classes transform into the later morphological types. Other authors (see, for instance, Andreon et al. 1997) find a much ”milder” evolution of the S/S0 ratio. van Dokkum et al. (2000) studied the rich cluster MS1054-03 at and found a deficit in the population of early-type galaxies, reaching a factor of 2 from to . Moreover, they have estimated that the fraction of very close binary (or interacting) galaxies, probably future mergers, is 17%, which could support the idea that ellipticals are ”merged” spirals.
In conclusion, the stars in ellipticals (or most of them by mass and light) are no doubt old from their spectral properties and the corresponding variations. But they may have been reassembled much later into their present nice spheroidal systems: Franx & van Dokkum (2001) have proposed a mechanism to reconcile these conflicting indications, at least as far as cluster galaxies are concerned.
6 Concluding remarks
The recent high quality imaging and kinematical data on ellipticals have shown that besides tri-axiallity, these galaxies have a complex structure including the presence of inner disks, cores and cuspy light profiles. The tri-axiallity inferred from radial variations of the axial ratios was further supported by new data, suggesting substantial rotation along the minor axis. Moreover, such high quality data demonstrated the existence of small central components not sharing the rotation of the main body, which are interpreted as the result of capture of a small nearby galaxy.
There is presently strong evidences that most (if not all) ellipticals host in their centers a massive black hole able to modify the profile of the very central matter distribution (baryonic and non-baryonic). These SMBH form perhaps contemporaneously with all stellar spheroids, a picture supported by the observed correlation between the SMBH mass and the central velocity dispersion of the galaxy.
The dynamical evidence for the presence of dark matter in the central regions either of spirals or ellipticals is not conclusive, since the predicted ”cuspy” profiles from numerical simulations are not seen in rotation curves, and stars can provide the required gravitational field inside the optical radius to explain kinematical data. However, at larger distances, the confinement of the hot gas seen in X-rays implies the existence of a substantial amount of dark matter in halos, also supported by recent kinematic data on planetary nebulae and globular clusters, in the outskirts of giant ellipticals. The extensive numerical simulations performed by several authors indicate that the density distribution inside dark matter halos, formed through successive merging episodes, can be represented by an ”universal” profile, independent of the parameters defining the cosmological model, the mass of the halo or the redshift.
The understanding of the heating and cooling of the baryon component is an essential key in the process of galaxy formation, since it permits the definition of a critical mass (for a given dark halo mass) above which star formation is triggered. However many problems still remain unsolved, as the origin of the angular momentum and its relation with the galactic morphology. In the hierarchical scenario, the morphology is the consequence of a particular merger and accretion history that galaxies experience during their assembly. Disks are the result of gas accreted smoothly from the intergalactic medium, while spheroids would be formed through major merger events where disks are mixed and relaxed violently.
The bulk of the stellar populations of E’s is quite old (12-13 Gyr), according to the interpretation of the integrated colors and the color-magnitude diagram. However, based mainly on the H and indices, some authors found galaxies with stellar populations substantially younger, sometimes in contradiction with the observed colors. It should be emphasize that other effects than age or emission may affect the index as, for instance, the horizontal branch morphology (de Freitas Pacheco & Barbuy 1995; de Freitas Pacheco 1998). Recent star formation episodes triggered by accretion of intergalactic material or small nearby galaxies cannot be excluded, and appears prominent in several local objects. A further indication of an initial and intense star formation period is provided by the relative abundance of the -elements, which is a ”clock” suggesting that the majority of the stars were formed in a timescale of 2-3 Gyr. Most of the E’s have mean metallicities near solar, which is an indication of a population mix, constituted of different generations required to the build up of the chemical elements.
The colors, the color-magnitude diagram (most probably a metallicity-mass diagram) and the relative abundance of the -elements favors an evolutive scenario where the star formation activity begins after the assembly of a critical mass of gas, according to the description given previously. After the triggering, most of the stars are formed in a relatively short timescale (2-3 Gyr) and then evolve ”passively”. These conclusions, as seen in Section 5.2, are reinforced by the small scatter in the M/L ratio derived from the Fundamental Plane and its decrease with redshift, equivalent to a brightening of the galaxies with . The evolution of the luminosity function of ”red” galaxies also points in such a direction, as well as the evolution of the Mgb - relation, although the available data on the latter cannot be considered as conclusive. On the other hand, the main argument in favor of an assembly of spirals to form ellipticals is the possible decrease of the fraction of the latter at higher redshifts, an evidence criticized by some authors on the basis of the difficulties to distinguish morphological types at high .
The two scenarii, ”monolithic” versus ”hierarchical”, sketched in our introductory section to describe the origin and evolution of ellipticals, will probably be no more tenable in a near future, at least in their simplistic forms. Recently observers and theoreticians have made great strides towards a synthesis. The epochs of major stellar formation have been identified from very deep multi-wave-length surveys (Steidel, 1999) and from the analysis of the Cosmic IR Background (Gispert et al. 2000). The stellar formation rate strongly declined after and was possibly maximal near . The brightest galaxies detected at such epochs (Lyman Break Galaxies) seem to be analogous to the local luminous IR galaxies with intense star formation behind an heavy dust ”curtain”. Guiderdoni (2002) summarizes the work undertaken to model, within a supercluster-size volume, the formation and hierarchical evolution of these objects, which could be the progenitors of massive present day galaxies, both spirals and ellipticals.
We thank U. Frisch and S. Matarrese for helpful comments. R.M. is supported by European TMR network (contract HPRN-CT-2000-00162).
References
- (1) Andreon S, Davoust E., Heim T., 1997, A&A 323, 337
- (2) Arnaboldi M., Freeman K.C., 1996, in The Nature of Elliptical Galaxies, eds. M. Arnaboldi et al., ASP Conf. Ser. 116, 54
- (3) Arnaboldi M., Freeman K.C., Mendez R.H., Capaccioli M., Ciardullo R., Ford H., Gerhard O., Hui X., Jacobi G.H., Kudritzki R.P., Quinn P.J., 1996, ApJ 472, 145
- (4) Arnaboldi M., Freeman K.C., Gerhard O., Matthias M., Kudritzki R.P., Mendez R.H., Capaccioli M., Ford H., 1998, ApJ 507, 759
- (5) Arnol’d V.I., 1986, Catastrophe Theory, Springer-Verlag Telos, 2nd Edition
- (6) Awaki H., Mushotzky R., Tsuru T., Fabian A.C., Fukazawa Y., Lowenstein M., Makishima K., Matsumoto H., Matsushita K., Mihara T., Ohashi T., Ricker G.R., Serlemitsos P.J., Tsusaka Y., Yamazaki T., 1994, PASJ 46, 65
- (7) Bacon R., Adam G., Barane A., Courtes G., Dubet D., Dubois J.P., Emsellem E., Ferruit P., Georgelin Y., Monnet G., Pecontal E., Rousset A., Say F., 1995, A&AS 113, 347
- (8) Bacon R., Emsellem E., Copin Y., Monnet G., 2000, in Imaging the Universe in Three Dimensions, eds. W. van Breugel, J. Bland-Hawthorn, ASP Conf.Ser. 195, 173
- (9) Bacon R., Copin Y., Monnet G., Miller B.W., Allington-Smith J.R., Bureau M., Carollo C.M., Davies R.L., Emsellem E., Kuntschner H., Peletier R.F., Verlome E.K., de Zeeuw P.T., 2001, MNRAS 326, 23
- (10) Bahcall N.A., Lubin L., Dorman V., 1995, ApJ 447, L81
- (11) Bahcall N.A., Ostriker J.P., Perlmutter S., Steinhardt P., 1999, Science 284, 1481
- (12) Barnes D.G., 1998, PASA 15, 348
- (13) Baugh C.M., Cole S., Frenk C.S., 1996, MNRAS 283, 1361
- (14) Baugh C.M., Cole S., Frenk C.S., Lacey C.G., 1998, ApJ 498, 504
- (15) Bender R., 1988, A&A 202, L5
- (16) Bender R., 1992, in Structure, Dynamics and Chemical Evolution of Elliptical Galaxies, eds. I.J. Danziger et al., ESO - Munich, p.3
- (17) Bender R., Saglia R.P., Gerhard O.E., 1994, MNRAS 269, 785
- (18) Bertin G., Saglia R.P., Stiavelli M., 1992, ApJ 384, 423
- (19) Bertola F., Capaccioli M., 1975, ApJ 200, 439
- (20) Bertola F., Buson L.M., Zeilinger W.W., 1992, ApJ 401, L79
- (21) Bertola F., Pizzella A., Persic M., Salucci P., 1993, ApJ 416, L45
- (22) Bertschinger E., 1985, ApJ 58, 39
- (23) Bharadwaj S., Sahni V., Sathyaprakash B.S., Shandarin S.F., Yess C., 2000, ApJ 528, 21
- (24) Binney J.J., 1978, MNRAS 183, 501
- (25) Binney J.J., Davis R.L., Illingworth G.D., 1990, ApJ 361, 78
- (26) Blakeslee J.P., Lucey J.R., Barris B.J., Hudson M.J., Tonry J., 2001, MNRAS 327, 1004
- (27) Blumenthal G.R., Faber S.M., Primack J.R., Rees M.J., 1984, Nature 311, 517
- (28) Bond J.R., Cole S., Efstathiou G., Kaiser N., 1991, ApJ 379, 440
- (29) Borges A.C., Idiart T.P., de Freitas Pacheco J.A., Thévenin F., 1995, AJ 110, 2408
- (30) Boselli A., Lequeux J., Sauvage M., Boulade O., Boulanger F.,Cesarski D., Dupraz C., Madden S., Vigroux L., 1998, A&A 335, 53
- (31) Bosma A., 1978, PhD Thesis, University of Groningen
- (32) Bower G.A., Lucey J.R., Ellis R.S., 1992a, MNRAS 254, 589
- (33) Bower G.A., Lucey J.R., Ellis R.S., 1992b, MNRAS 254, 601
- (34) Bower G.A., Heckman T.M., Wilson A.S., Richstone D.O., 1997, ApJ 483, 33
- (35) Bower G.A., 1999, in Galaxy Dynamics, ed. D. Merritt et al., ASP Conf. Ser. 182, 59
- (36) Bressan A., Chiosi C., Tantalo R., 1996, A&A 311, 425
- (37) Buote D.A., Canizares C.R., 1998, MNRAS 298, 811
- (38) Byun Y.-I., Grillmair C., Faber S., Ajhar E.A., Dressler A., Kormendy J., Lauer T.R., Richstone D., Tremaine S., 1996, AJ 111, 1889
- (39) Canizares C.R., Fabbiano G., Trinchieri G., 1987, ApJ 312, 503
- (40) Caon N., Capaccioli M., d’Onofrio M., 1993, MNRAS 265, 1013
- (41) Capaccioli M., 1988, in Le Monde des Galaxies, eds. H.G. Corwin & L. Bottinelli, Springer - Verlag
- (42) Cappacioli M., Caon M., d’Onofrio M., 1992, in Structure, Dynamics and Chemical Evolution of Elliptical Galaxies, eds. I.J. Danziger et al., ESO - Munich
- (43) Capaccioli M., Longo G., 1994, A&A Rev. 5, 293
- (44) Carollo C.M., Danziger I.J., 1994, MNRAS 270, 523
- (45) Carollo C.M., Franx M., Illingworth G.D., Forbes D.A., Duncan A. 1997a, ApJ 481, 710
- (46) Carollo C.M., Danziger I.J., Rich R., Chen X., 1997b, ApJ 491, 545
- (47) Charlot S., Worthey G., Bressan P., 1996, ApJ 457, 625
- (48) Chiosi C., Carraro G., 2002, MNRAS 335, 335
- (49) Cohen J.G., Ryzhov A., 1997, ApJ 486, 230
- (50) Cole S., Lacey C.G., 1996, MNRAS 281, 716
- (51) Cole S., Aragón-Salamanca A., Frenk C., Navarro J.F., 1994, MNRAS 271, 781
- (52) Copin Y., Bacon R., Bureau M., Davies R.L., Emsellem E., Kuntschner H., Miller B., Peletier R.F., Verlome E.K., de Zeeuw P.T., 2001, in Soc.Fr.Astr.Astrophys., Scientific Highlights 2001, eds; F. Combes, D. Barret, F. Thèvenin, p.289
- (53) Daddi E., Cimatti A., Broadhurst T., Renzini A., Zamorani G., Mignoli M., Saracco P., Fontana A., Pozzeti L., Poli F., Cristiani S., D’Odorico S., Giallongo E., Gilmozzi R., Menci N., 2002, A&A 384, L1
- (54) Davies R.L., Birkinshaw M., 1988, ApJS 68, 409
- (55) Davies R.L., Kuntschneer H., Emsellem E., Bacon R., Bureau M., Carollo C.M., Copin Y., Miller B.W., Monnet G., Peletier R.F., Verolme E.K., de Zeeuw P.T., 2001, ApJ 548, 33
- (56) Davis D.S., White R.E., 1996, ApJ 470, L35
- (57) de Blok W.J.G., Bosma A., 2002, A&A 385, 816
- (58) de Carvalho R.R., Djorgovsky G., 1992, ApJ 389, L49
- (59) de Freitas Pacheco J.A., Barbuy B., 1995, A&A 302, 718
- (60) de Freitas Pacheco J.A., 1996a, RMxAA Conf 4, 51
- (61) de Freitas Pacheco J.A., 1996b, MNRAS 278, 841
- (62) de Freitas Pacheco J.A., 1997, A&A 319, 394
- (63) de Freitas Pacheco J.A., 1998, in Abundance Profiles: Diagnostic Tools for Galaxy History, PASP Conf. Ser. 147, 205
- (64) de la Rosa I.G., de Carvalho R.R., Zepf S.E., 2001, ApJ 122, 93
- (65) de Vaucouleurs G., 1948, Ann. d’Astrophys. 11, 247
- (66) de Vaucouleurs G., Capaccioli M., 1979, ApJS 40, 699
- (67) de Zeew P.T., Franx M., 1991, ARA&A 29, 239
- (68) de Zeeuw P.T., Bureau M., Emsellem E., Bacon R., Carollo C.M., Copin Y., Davies R.L., Kuntschner H., Miller B.W., Monnet G., Peletier R.F., Verlome E.K., 2002, MNRAS 329, 513
- (69) Djorgovski S.G., Davis M., 1987, ApJ 313, 59
- (70) Dressler A., Lynden-Bell D., Burstein D., Davies R.L., Faber S.M., Terlevich R., Wegner G., 1987, ApJ 313, 42
- (71) Dressler A., Oemler A.Jr., Couch W.J., Smail I., Ellis R.S., Barger A., Butcher H., Poggianti B.M., Sharples R.M., 1997, ApJ 490, 577
- (72) Dubinski J., Carlberg R., 1991, ApJ 378, 496
- (73) Ebisuzaki T., Makino J., Okamura S.K., 1991, Nature 354, 212
- (74) Eggen O.J., Lynden-Bell D., Sandage A.R., 1962, ApJ 136, 748
- (75) Emsellem E., 1998, in Galaxy Dynamics, eds. D. Merritt et al., ASP Conf.Ser. 182, 45
- (76) Fabbiano G., 1989, ARA&A 27, 87
- (77) Fabbiano G., Kim D.W., Trinchieri G., 1992, ApJS 80, 531
- (78) Faber S., Jackson R.E., 1976, ApJ 204, 668
- (79) Faber S., Tremaine S., Ajhar E.A., Byun Y.-I., Dressler A., Gebhardt K., Grillmair C., Kormendy J., Lauer T.R., Richstone D., 1997, AJ 114, 1771
- (80) Fabricant D., Franx M., van Dokkum P., 2000, ApJ 539, 577
- (81) Ferrarese L., Merritt D., 2000, ApJ 539, L9
- (82) Ferrari F., Pastoriza M.G., Maccheto F.D., Bonatto C., Panagia N., Sparks W.B., 2002, A&A 389, 355
- (83) Fich M., Rupen M.P., Knapp G.R., Malyshkin L., Harper D.A., Wynn-Williams C.G., 1998, in The Universe as Seen by ISO, eds. P.Cox & M.F. Kessler, ESA Publ., p.877
- (84) Flores A.R., Primack J.R., 1994, ApJ, 427, L1
- (85) Forbes D.A., Franx M., Illingworth G.D., 1995, AJ 109, 1988
- (86) Forman W., Jones C., Tucker W., 1985, ApJ 293, 102
- (87) Franx M., Illingworth G., 1988, ApJ 327, L55
- (88) Franx M., Illingworth G., de Zeeuw P.T., 1991, ApJ 383, 112
- (89) Franx M., van Dokkum P.G., 2001, in Galaxy Disks and Disk Galaxies, Eds. J.G. Funes, E.M. Corsini, ASP Conf. Ser. 230, 581
- (90) Fukushige T., Makino J., 1997, ApJ 477, L9
- (91) Gebhardt K., Richstone D., Ajhar E.A., Lauer T.R., Byun Y.-I., Kormendy J., Dressler A., Faber S., Grillmair C., Tremaine S., 1996, AJ 112, 105
- (92) Gebhardt K., Bender R., Bower G., Dressler A., Faber S.M., Filipenko A.V., Green R., Grillmair C., Ho L.C., Kormendy J., Lauer T.R., Magorrian J., Pinkey J., Richstone D., Tremaine S., 2000a, ApJ 539, L13
- (93) Gebhardt K., Richstone D., Kormendy J., Lauer T.R., Ajhar E.A., Bender R., Dressler A., Faber S.M., Grillmair C., Magorrian J., Tremaine S., 2000b, AJ 119, 1157
- (94) Gerhard O., Jeske G., Saglia R.P., Bender R., 1998, MNRAS 295, 197
- (95) Gerhard O., Kronawitter A., Saglia R.P., Bender R., 2001, AJ 121, 1636
- (96) Gispert R., Lagache G., Puget J.-L., 2000, A&A 360, 1
- (97) Gnedin O.Y., Zhao H., 2002, MNRAS 333, 299
- (98) Gott J.R., 1975, ApJ 201, 296
- (99) Goudfrooij P., Hansen L., Jrgensen H.E., Nrgaard-Nielsen T., de Jong T., van den Hoek L.B., 1994a, A&AS 104, 179
- (100) Goudfrooij P., Hansen L., Jrgensen H.E., Nrgaard-Nielsen T., 1994b, A&AS 105, 341
- (101) Goudfrooij P., de Jong T., 1995, A&A 298, 784
- (102) Goudfrooij P., 2000, in Small Galaxy Groups, eds. J.V. Mauri, C. Flynn IAU Colloqium 174, ASP Conf. Ser. 209, 74
- (103) Guiderdoni B., 2002, Ap&SS 281, 13
- (104) Gunn J.E., 1977, ApJ 218, 592
- (105) Halliday C., Davies R.L., Kuntschner H., Birkinshaw M., Bender R., Saglia R.P., Baggley G., 2001, MNRAS 326, 473
- (106) Harms R.J., Ford H.C., Tsvetanov Z.I., Hartig G.F., Dressel L.L., Kriss G.A., Bohlin R., Davidsen A.F., Margon B., Kochhar A.K., 1994, ApJ 435, L35
- (107) Hernquist L., 1990, ApJ 356, 359
- (108) Hoekstra H., van Albada T.S., Sancisi R., 2001, MNRAS 323, 453
- (109) Hoffman Y., Shaham J., 1985, ApJ 297, 16
- (110) Hoyle F., 1949 in The origin of the rotation of galaxies, eds. Burgers J.M., van de Hulst H.C. Problems of cosmological Aerodynamics. Central air documents office, Dayton.
- (111) Hu E.M., Cowie L.L., McMahon R.G., Capak P., Iwamuro F., Kneib J.-P., Maihara T., Motohara K., 2002, ApJ 568, 75
- (112) Idiart T.P., de Freitas Pacheco J.A., Costa R.D.D., 1996, AJ 112, 254
- (113) Idiart T.P., Michard R., de Freitas Pacheco, J.A., 2002a, A&A 383, 30
- (114) Idiart T.P., Michard R., de Freitas Pacheco J.A., 2002b, in press
- (115) Illingworth G., 1977, ApJL 218, L43
- (116) Illingworth G., Franx M., 1988, in Dynamics of Dense Stellar Systems, Cambridge University Press, p.13
- (117) Im M., Faber S.M., Gebhardt K., Koo D.C., Phillips A.C., Schiavon R.P., Simard L., Willmer C.N.A., 2001, ApJ 122, 750
- (118) Jaffe W., Ford H.C., O’Connell, van den Bosch F.C., Ferrarese L., 1994, AJ 108, 1567
- (119) Jaffe W., Ford H.C., Tsvetanov Z., Ferrarese L., Dressel L., 1998 in Galaxy Dynamics, eds. D. Merritt et al., ASO Conf. Ser. 182, 13
- (120) Jrgesen I., Franx M., Kjaergaard P., 1996, MNRAS 280, 167
- (121) Jrgensen I., Franx M., Hjorth J., van Dokkum P.G., 1999, MNRAS 308, 833
- (122) Katz N., Gunn J.E., 1991, ApJ 377, 365
- (123) Katz N., Hernquist L., Weinberg D., 1992, ApJ 399, L109
- (124) Kawata D., 2001, ApJ 548, 703
- (125) Kelson D., van Dokkum P.G., Franx M., Illingworth G.D., Fabrikant D., 1997, ApJ 478, L13
- (126) Kissler-Patig M., Brodie J.P., Schroder L.L., Forbes D.A., Grillmair C.J., Huchra J.P., 1998, AJ 115, 105
- (127) Kissler-Patig M., Ashman K.M., Sepf S.E., Freeman K.C., 1999, AJ 118, 197
- (128) Knapp G.R., Guthathakurta P., Kim D.W., Jura M., 1989, ApJS 70, 329
- (129) Kobayashi C., Arimoto N., 1999, ApJ 527, 573
- (130) Kodama T., Arimoto N., 1997, A&A 320, 41
- (131) Kormendy J., 1977, ApJ 218, 333
- (132) Kormendy J., Richstone D., 1995, ARA&A 33, 581
- (133) Kronawitter A., Saglia R.P., Gerhard O., Bender R., 2000, A&AS 144, 53
- (134) Larson R.B., 1975, MNRAS 173, 671
- (135) Lauer T.R., Ajhar E.A., Byun Y.-I., Dressler A., Faber S., Grillmair C., Kormendy J., Richstone D., Tremaine S., 1995, AJ 110, 2622
- (136) Leach R., 1981, ApJ 248, 485
- (137) Loewenstein M., 1999, in Star Formation in Early-Type Galaxies, eds. J. Cepa & P. Carral, ASP Conf. Ser. 163, 153
- (138) Lucey J.R., Guzmán R., Carter D., Terlevich R.J., 1991, MNRAS 253, 584
- (139) Madden S.C., Vigroux L., 1999, in Star Formation in Early-Type Galaxies, eds. J. Cepa & P. Carral, ASP Conf. Ser. 163, 135
- (140) Magorrian J., Tremaine S., Richstone D., Bender R., Bower G., Dressler A., Faber S.M., Gebhardt K., Green R., Grillmair C., Kormendy J., Lauer T., 1998, AJ 115, 2285
- (141) Makino J., 1997, ApJ 478, 58
- (142) Marchesini D., D’Onghia E., Chincarini G., Firmani C., Conconi P., Molinari E., Zacchei A., 2002, ApJ 575, 801
- (143) Matsumoto H., Koyama K., Awaki H., Tsuru T., Loewenstein M., Matsushita K., 1997, ApJ 482, 133
- (144) Mehlert D., Saglia R.P., Bender R., Wagner G., 2000, A&AS 141, 449
- (145) Mellier Y., Fort B., Kneib J.-P., 1993, ApJ 407, 33
- (146) Mendez R.H., Riffeser A., Kudritzki R.P., Matthias M., Freeman K.C., Arnaboldi M., Capaccioli M., Gerhard O., 2001, ApJ 563, 135
- (147) Merritt D., 1998, in Galaxy Dynamics, ed. D. Merritt et al., ASP Conf. Ser. 182, 164
- (148) Merritt D., Quinlan G.D., 1998, ApJ 498, 625
- (149) Michard R., 1979, A&A 74, 206
- (150) Michard R., 1984, A&A 140, L39
- (151) Michard R., 1985, A&AS 59, 205
- (152) Michard R., 1998a, A&A 334, 453
- (153) Michard R., 1998b, A&A 335, 49
- (154) Michard R., 1998c, A&A 335, 479
- (155) Michard R., 1999, A&AS 137, 245
- (156) Michard R., 2000, A&A 360, 85
- (157) Minniti D., Kissler-Patig M., Goudfrooij P., Meylan G., 1998, AJ 115, 121
- (158) Moore B., Governato F.,Quinn T., Stadel J., Lake G., 1998, ApJ 499, L5
- (159) Mushotzky R., Loewenstein M., 1997, ApJ 481, 63
- (160) Mushotzky R., Angelini L., Loewenstein M., 2001, in New Century of X-Ray Astronomy, eds. H. Inoue & H. Kunieda, ASP Conf. Ser. 251, 64
- (161) Navarro J.F., Frenk C.S., White S.D.M., 1995, MNRAS 275, 56
- (162) Navarro J.F., Frenk C.S., White S.D.M., 1996, ApJ 62, 563
- (163) Navarro J.F., Frenk C.S., White S.D.M., 1997, ApJ 490, 493
- (164) Navarro J.F., Steinmetz M., 1997, ApJ 478, 13
- (165) Navarro J.F., Steinmetz M., 2000, ApJ 538, 477
- (166) Nieto J-L, Bender R., Surma P., 1991, A&A 244, L37
- (167) Ortega V.G., de Freitas Pacheco J.A., 1989, AJ 97, 1000
- (168) Ortega V.G., Lopes Vieira G., de Freitas Pacheco J.A., 1998, Ap&SS 260, 271
- (169) Pahre M.A., Djorgovsky S.G., de Carvalho R.R., 1995, ApJ 453, L17
- (170) Pahre M.A., Djorgovsky S.G., de Carvalho R.R., 1998a, AJ 116, 1591
- (171) Pahre M.A., de Carvalho R.R., Djorgovsky S.G., 1998b, AJ 116, 1606
- (172) Pahre M.A., Djorgovski S.G., de Carvalho R.R., 2001, Ap&SS 276, 983
- (173) Palunas P., Williams T.B., 2000, AJ 120, 2884
- (174) Peebles P.J.E., 1965, ApJ 142, 1317
- (175) Peebles P.J.E., 1972, Comm. Ap. and Space Phys. 4, 53
- (176) Peebles P.J.E., 1980, in The large-scale structure of the Universe, Princeton University Press, New Jersey.
- (177) Peebles P.J.E., 2002., in A New Era in Cosmology. eds. N. Metcalfe & T. Shanks ASP Conf. Ser., in press - astro-ph/0201015
- (178) Press W.H, Schechter P., 1974, ApJ 187, 425
- (179) Prugniel Ph., Simien F., 1994, A&A 282, 1
- (180) Prugniel Ph., Simien F., 1996, A&A 309, 749
- (181) Prugniel Ph., Golev V., Maubon G., 1999, A&A 346, 25
- (182) Quinlan G.D., Hernquist L., Sigurdsson S., 1995, ApJ 440, 554
- (183) Renzini A., Ciotti L., 1993, ApJ 416, 49
- (184) Rest A., van den Bosch F.C., Jaffe W., Tran H., Tsvetanev Z., Ford H.C., Davies J., Schafer J., 2001, AJ 121, 2431
- (185) Richstone D., Ajhar E.A., Bender R., Bower G., Dressler A., Faber S.M., Filippenko A.V., Gebhardt K., Green R., Ho L.C., Kormendy J., Lauer T.R., Magorrian J., Tremaine S., 1998, Nature 395, A14
- (186) Rix H.-W., White S.D.M., 1990, ApJ 362, 52
- (187) Rodighiero G., Francheschini A., Fasano G., 2001, MNRAS 324, 491
- (188) Rubin V.C., Burstein D., Ford Jr. W.K., Thonnard N., 1985, ApJ 289, 81
- (189) Rupen M.P., 1996, in Nature of Elliptical Galaxies, eds. M. Arnaboldi et al., ASP Conf. Ser. 116, 113
- (190) Saglia R.P., Kronawitter A., Gerhard O., Bender R., 2000a, AJ 119, 153
- (191) Saglia R.P., Maraston C., Greggio L., Bender R., Ziegler B., 2000b, A&A 360, 911
- (192) Sargent W.L.W., Young P.J., Lynds C.R., Boksenberg A., Shortridge K., Hartwick F.D.A., 1978, ApJ 221, 731
- (193) Sarazin C.L., 1997, in The Nature of the Elliptical Galaxies, eds. M. Arnaboldi et al., ASP Conf. Ser. 116, 375
- (194) Schlegel D.J., Finkbanker D.P., Davis M., 1998, ApJ 500, 525
- (195) Schwarzschild M., 1979, ApJ 232, 236
- (196) Scodeggio M., Gionanelli R., Haynes M.P., 1998, AJ 116, 2738
- (197) Scodeggio M., Silva D.R., 2000, A&A 359, 953
- (198) Sérsic J.L., 1968, in Atlas de Galaxias Australes, Observatorio Astronomico de Cordoba
- (199) Schechter P., 1976, ApJ 203, 297
- (200) Shandarin S.F., Klypin A.A., 1984, Sov. Astron. 28, 491
- (201) Sheth R.K., Tormen G., 1999, MNRAS 308, 119
- (202) Sheth R.K., Mo H.J., Tormen G., 2001, MNRAS 323, 1
- (203) Silva D.R., Wise M.W., 1996, ApJ 457, L15
- (204) Simien F., Prugniel P., 1997a, A&AS 122, 521
- (205) Simien F., Prugniel P., 1997b, A&AS 126, 15
- (206) Simien F., Prugniel P., 1977c, A&AS 126, 519
- (207) Simien F., Prugniel P., 1998, A&AS 131, 287
- (208) Simien F., Prugiel P., 2000, A&AS 145, 263
- (209) Simien F., Prugniel P., 2002, A&A 384, 371
- (210) Sofue Y., Rubin V., 2001, ARA&A 39, 137
- (211) Stanford S.A., Eisenhardt P.R.M., Dickinson M., 1995, ApJ 450, 512
- (212) Stanford S.A., Eisenhardt P.R.M., Dickinson M., 1998, ApJ 492, 461
- (213) Steidel C.C., 1999, Proc.Nat.Acad.Sci. USA 96, 4232
- (214) Steinmetz M., Navarro J., 2002, New Astronomy - in press - astro-ph/0202466
- (215) Stiavelli M., Treu T., 2000, AAS 197, 77.17
- (216) Sutherland R.S., Dopita M.A., 1993, ApJS 88, 253
- (217) Tamura N., Kobayashi C., Arimoto N., Kodama T., Ohta K., 2000, AJ 119, 2134
- (218) Thomas D., Maraston C., Bender R., 2002, A&SS 281, 371 (astro-ph/0202166)
- (219) Tonry J., Schneider D.P., 1988, AJ 96, 807
- (220) Tonry J., Dressler A., Blakeslee J.P., Ajhar E.A., Fletcher A.B., Luppino G.A., Metzger M.R., Moore C.B., 2001, ApJ 546, 681
- (221) Toomre A., 1977, in The Evolution of Galaxies and Stellar Populations, eds. B.M. Tinsley, R.B. Larsen, Yale Univ. Press, p.401
- (222) Trager S.C., Worthey G., Faber S.M., Burstein D., Gonzáles J.J., 1998, ApJS 116, 1
- (223) Trager S.C., Faber S.M., Worthey G., Gonzáles J.J., 2000a, AJ 120, 165
- (224) Trager S.C., Faber S.M., Worthey G., Gonzáles J.J., 2000b, AJ 119, 1645
- (225) van der Marel R.P., Binney J.J., Davies R.L., 1990, MNRAS 245, 582
- (226) van der Marel R.P., Franx M., 1993, ApJ 407, 525
- (227) van der Marel R.P., van den Bosch F.C., 1998, AJ 116, 2220
- (228) van der Marel R.P., Cretton R., de Zeew P., Rix H.W., 1998, ApJ 493, 613
- (229) van der Marel R.P., 1999, AJ 117, 744
- (230) van Dokkum P.G., Franx M., 1995, AJ 110, 2027
- (231) van Dokkum P.G., Franx M., 1996, MNRAS 281, 985
- (232) van Dokkum P.G., Franx M., Fabricant D.,Illingworth G.D., Kelson D.D., 2000, ApJ 541, 95
- (233) van Gorkom J., Schiminovich D., 1996, in Nature of Elliptical Galaxies, eds. M. Arnaboldi et al., ASP Conf. Ser. 116, 113
- (234) Vazdekis A., Casuso E., Peletier R.F., Beckman J.E., 1996, ApJS 106, 307
- (235) Waddington I., Windhorst R.A., Cohen S.H., Dunlop J.S., Peacock J.A., Jimenez R., McLure R.J., Bunker A.J., Spinrad H., Dey A., Stern D., 2002, MNRAS 336, 1342
- (236) Wernli F., Emsellem E., Copin Y., 2001, in Soc.Fr.Astr.Astrophys., Scientific Highlights 2001, eds. F. Combes, D. Barret, F. Thèvenin, p.327
- (237) Wise M.W., Silva D.R., 1996, ApJ 461, 155
- (238) Witt A.N., Thronson H.A. Jr., Capuano J.M.Jr., 1992, ApJ 393, 611
- (239) White S.D.M., Rees M.J., 1978, ApJ 183, 341
- (240) White S.D.M., Frenk S.F., 1991, ApJ 379, 52
- (241) William , Schwarzschild M., 1979a, ApJ 227, 56
- (242) William, Schwarzschild M., 1979b, ApJS 41, 209
- (243) Worthey G., Faber S.M., Gonzáles J.J., 1992, ApJ 398, 69
- (244) Worthey G., 1994, ApJS 95, 107
- (245) Worthey G., 1998, PASP 110, 888
- (246) Young P.J., 1980, ApJ 242, 1232
- (247) Zel’dovich Ya.B., 1970, A&A 5,84
- (248) Ziegler B.L., Bender R., 1997, MNRAS 291, 572
- (249) Ziegler B.L., Saglia R.P., Bender R., Belloni P., Greggio L., Seitz S., 1999, A&A 346, 13

![[Uncaptioned image]](/html/astro-ph/0301248/assets/x2.png)