Deep images of cluster radio halos
New radio data are presented for the clusters A401, A545, A754, A1914, A2219 and A2390, where the presence of diffuse radio emission was suggested from the images of the NRAO VLA Sky Survey. Sensitive images of these clusters, obtained with the Very Large Array (VLA) at 20 cm confirm the existence of the diffuse sources and allow us to derive their fluxes and intrinsic parameters. The correlation between the halo radio power and cluster X-ray luminosity is derived for a large sample of halo clusters, and is briefly discussed.
Key Words.:
Radio continuum: general - Galaxies: clusters: general - Intergalactic medium - X-rays: galaxies: clusters1 Introduction
Great attention has been devoted in recent years to the study of cluster large-scale diffuse radio sources that have no obvious connection to any individual cluster galaxy. The sources classified as radio halos are generally regular in shape and located at the cluster centers. Sources with similar properties have also been found at the cluster peripheries: they are the relic sources. They commonly show irregular and elongated shape and exhibit stronger polarization than halos. Moreover, in some clusters with a central powerful radio galaxy, the relativistic particles can be traced out to distances up to 500 kpc, forming what is called a mini-halo (see e.g. 3C 84 in the Perseus cluster, Burns et al. 1992). These sources demonstrate the existence of relativistic electrons and large scale magnetic fields in the intracluster medium, so they probe that non-thermal processes are common in clusters of galaxies.
The difficulty in explaining these diffuse sources arises from the combination of their large size and the short lifetimes of radiating electrons. Two main classes of theoretical models have been proposed for the origin of radio halos: (i) in-situ electron reacceleration by turbulent gas motion or shocks produced in the intergalactic medium during cluster merger processes; (ii) secondary particle production by hadronic interaction of relativistic protons with the background gas of the IGM. Also the relics have been suggested to be connected to shocks in cluster merger processes, either through diffusive shock acceleration of radio emitting particles (Enßlin et al. 1998) or adiabatic recompression of fossil radio plasma (Enßlin & Brüggen 2002). On the contrary, the mini-halos are not linked to cluster merger processes. A recent models involving electron reacceleration due to MDH turbulence in the cooling flow has been suggested by Gitti et al. (2002a).
The knowledge of the physical properties of these sources, and of their origin and evolution is limited by the low number of halos and relics well studied up to now. Also, it is not yet clear if radio halos and relics have a common origin and evolution, or should be considered as different classes of sources.
To properly map these extended sources one needs large sensitivity to the extended features, but also high resolution to distinguish a real halo from the blend of unrelated sources.
| Name | z | RA (2000) | DEC | BM | kpc/′′ | T | L |
|---|---|---|---|---|---|---|---|
| h m s | ∘ ′ ′′ | keV | erg s-1 | ||||
| A401 | 0.0737 | 02 58 58.3 | +13 34 36 | I | 1.89 | 8.0 | 2.54E+45 |
| A545 | 0.154 | 05 32 25.3 | –11 32 35 | III | 3.48 | 5.5 | 2.11E+45 |
| A754 | 0.0542 | 09 09 20.6 | –09 40 35 | I-II | 1.44 | 9.0 | 2.22E+45 |
| A1914 | 0.1712 | 14 26 01.1 | +37 49 26 | II | 3.77 | 10.5 | 5.63E+45 |
| A2219 | 0.2256 | 16 40 21.1 | +46 41 59 | III | 4.59 | 12.4 | 6.29E+45 |
| A2390 | 0.228 | 21 53 37 | +17 41 41 | I | 4.62 | 11.1 | 6.05E+45 |
Caption. Col. 1: cluster name; Col. 2: redshift from Struble & Rood (1999); Cols. 3 and 4: coordinates of the X-ray cluster center from David et al. (1999), but A2390 from Böhringer et al. (1998); Col. 5: Bautz-Morgan type; Col. 6: linear to angular conversion; Col. 7: temperature from Wu et al. (1999) but A1914 from White (2000); Col. 8: bolometric X-ray luminosity from a revised version of the table given in Wu et al. (1999).
We present here sensitive images of 6 clusters of galaxies, where the presence of diffuse sources was suggested by Giovannini et al. (1999) from a search in the NRAO111The National Radio Astronomy Observatory is operated by Associated Universities, Inc., under contract with the National Science Foundation. VLA Sky Survey (NVSS, Condon et al. 1998). As a cluster sample, Giovannini et al. (1999) used the X-ray brightest Abell clusters reported by Ebeling et al. (1996). They found 29 clusters, 11 of which were already known in the literature to contain a radio halo or relic, and 18 were new detections of cluster diffuse sources. Images with improved sensitivity and resolution of 6 clusters (A115, A520, A773, A1664, A2254 and A2744) have already been presented by Govoni et al. (2001).
The observations of the 6 clusters A401, A545, A754, A1914, A2219 and A2390, were carried out using the Very Large Array (VLA) in the C and D configurations at 20 cm. For each extended source, we derived the total flux densities, the size, and the physical conditions.
For the computation of intrinsic parameters, a Hubble constant H0=50 km s-1 Mpc-1 and a deceleration parameter q0=0.5 are adopted.
2 Radio Observations
The general properties of the clusters under study are given in Table 1. The choice of the observing frequency and of the configurations ensures a good sampling of short spacings, to adequately image the extended diffuse sources. The shortest baseline is 35 m, thus allowing to detect structures up to about 15′ in angular size. The details of the radio observations are given in Table 2. Data were calibrated and reduced with the Astronomical Image Processing System (AIPS), following the standard procedure (Fourier inversion, CLEAN and RESTORE, Self-Calibration). Significant editing of the data was needed because of strong interferences, affecting in particular the D array observations in the higher frequency IF. In some cases, this full data set was omitted. Therefore the noise in the final maps is much higher than the theoretical thermal noise.
| Name | Freq. | Bw | Array | Date | Durat. |
|---|---|---|---|---|---|
| MHz | MHz | min. | |||
| A401 | 1365/1435 | 50 | D | SEP 2000 | 160 |
| A545 | 1365/1435 | 50 | C | APR 2000 | 130 |
| 1365/1435 | 50 | D | SEP 2000 | 160 | |
| A754 | 1365/1435 | 50 | D | SEP 2000 | 160 |
| A1914 | 1365/1435 | 50 | C | APR 2000 | 160 |
| 1365/1435 | 50 | D | SEP 2000 | 160 | |
| A2219 | 1365/1435 | 50 | C | APR 2000 | 160 |
| 1365/1435 | 50 | D | SEP 2000 | 160 | |
| A2390 | 1365/1435 | 50 | C | APR 2000 | 60 |
Data from the two different configurations were first reduced separately, for a consistency check, and then added together to produce the final images. Images with angular resolutions ranging from 15′′ to 70′′ were produced. We also obtained maps of the polarized intensity in the standard way.
3 Results
We give below the description of the results for each cluster and the images of the diffuse radio emission detected in all of them. We summarize in Table 3 the properties of the diffuse sources. The total flux densitiy refers to the diffuse emission, after subtraction of discrete sources. The volume was evaluated by assuming an ellipsoidal shape, with the depth equal to the minimum size. The minimum energy density and equipartition magnetic field were computed using standard formulae (Pacholczyk 1970), integrating the radio emission between 10 MHz and 10 GHz, with a radio spectral index = 1.2 222S(, and assuming equal energy density in protons and electrons, and a volume filling factor of 1.
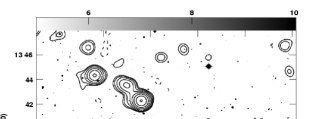
3.1 Abell 401
The presence of diffuse emission in this cluster, located north of the central cD galaxy, was reported by Harris et al. (1980a) and Roland et al. (1981). The last authors identified the possible radio halo with their source 14W19-b and reported a flux density of 80 mJy at 610 MHz, with a spectral index 1.4. Unlike the previous images, a faint radio emission located around the central cD galaxy was detected in the NVSS image (Giovannini et al. 1999), with a total flux density at 1.4 GHz of 21 mJy.
The deep radio map of this cluster, shown in Fig. 1, confirms the presence of a diffuse radio source around the cD galaxy, as found in the NVSS. The total flux density in the present image is lower than that reported by Giovannini et al. (1999), because of the accurate subtraction of the discrete sources. The diffuse emission is not detected in the short observation obtained with the VLA at 330 MHz by Giovannini & Feretti (2000). As discussed by Kassim et al. (2001) for the cluster A754, the extended low brightness emission could be missed at 330 MHz because of the poor uv coverage. Therefore, the lack of detection at 330 MHz cannot be used to obtain an upper limit to the radio spectral index .
The two emission peaks S1 and S2 have been considered as two possible unrelated sources. Thus their flux has been subtracted in the computation of the total flux of the halo. The classification of this diffuse source as a radio halo is only based on the fact that it is located at the cluster center. However, unlike typical radio halos, its shape is very elongated and irregular, more similar to peripheral radio relics.
No polarization is detected down to a limit of 4%. This fact would not support the possibility that this is a relic projected onto the cluster center.
According to the ASCA temperature map, Markevitch et al. (1998) suggested that this cluster is beginning a collision with the near cluster A399. They considered A401 as a rather unusual cluster, since neither temperature map nor the X-ray image indicate recent merger activity in the central cluster region, and yet it has no cooling flow (White et al. 1997, Peres et al. 1998). On the other hand, from the wavelet analysis of the ROSAT X-ray brightness distribution, Slezak et al. (1994) determined a complex structure and obtained a wavelet image which, we note, is remarkably similar to the structure of the radio halo.
3.2 Abell 545
The radio image of this cluster is presented in Fig. 2, where the extended radio halo is easily visible. Its structure is rather regular and centrally located.
A strong discrete source is present within the radio halo at RA2000 = 05h 32m 25.7s, DEC2000 = –11∘ 32′ 30.2′′(source S4 in Fig. 2), i.e, within 8.5′′ from the position of the brightest cluster galaxy given by Schneider et al. (1983). The identification between the radio source and the galaxy cannot be established with the present data but it is unlikely. Indeed, no cluster radio galaxies are reported in this cluster by Ledlow & Owen (1995). Another strong radio source, located at the south-western halo boundary, is clearly unrelated to the diffuse radio emission. No higher resolution image of this region is available from the literature or the VLA Faint Images of the Radio Sky at Twenty-cm Survey (FIRST, Becker et al. 1995).
The total flux density reported by Giovannini et al. (1999) from the NVSS image is 41 mJy. This is higher than the present flux density estimate, due to the accurate subtraction here of discrete sources. For this cluster, a comparison between the data of the two separate frequencies 1365 and 1435 MHz allowed to derive that the spectrum is steep with a lower limit 1.4. The central part of the halo is not polarized at a level of a few percent. At the boundaries, the upper limit to the polarized flux is, however of 15%.
The X-ray structure of this cluster is highly elongated within 0.5 Mpc, which may reflect dynamical youth of the interior (Buote & Tsai 1996, Buote 2001). Its unrelaxed state is consistent with the absence of a cooling flow (White et al. 1997).
| Name | S1.4 | LLS | Volume | P1.4 | umin | Heq | Type | |
|---|---|---|---|---|---|---|---|---|
| 107 | 1024 | 10-14 | ||||||
| mJy | ′ ′ | kpc | kpc3 | W Hz-1 | erg cm-3 | G | ||
| A401 | 171 | 6.3 2 | 700 | 1.7 | 0.41 | 4.5 | 0.7 | H |
| A545 | 231 | 5.6 5.3 | 1150 | 75 | 2.52 | 1.4 | 0.4 | H |
| A754 | 864 | 15.8 4.6 | 1350 | 11 | 1.12 | 1.8 | 0.6 | H |
| 693 | 13 10 | 1130 | 44 | 0.89 | 1.1 | 0.3 | R | |
| A1914 | 643 | 7.4 5.3 | 1650 | 120 | 8.72 | 2.3 | 0.5 | H |
| A2219 | 814 | 8 6.3 | 2180 | 340 | 19.6 | 2.0 | 0.5 | H |
| A2390 | 633 | 2 1.7 | 550 | 6.5 | 15.6 | 16.8 | 1.3 | MH |
Caption. Col. 1: cluster name; Col. 2: flux at 1.4 GHz; Cols. 3: angular size (maximum minimum); Col. 4: maximum linear size; Col. 5: source volume; Col. 6: radio power at 1.4 GHz; Col. 7: minimum energy density; Col. 8: equipartition magnetic field; Col. 9: type of diffuse source: H = halo, R = relic, MH = mini-halo.

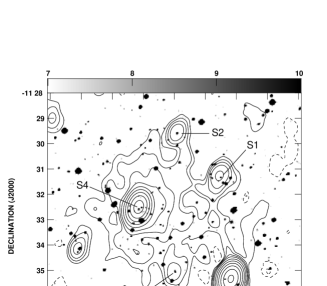
3.3 Abell 754
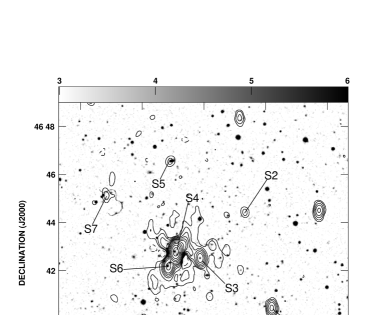
The existence of a halo in this cluster was suggested by Harris et al. (1980b) and recently confirmed by the image at 0.3 GHz of Kassim et al. (2001). The image obtained with the present data is shown in Fig. 3, where the resolution has been slightly degraded, to improve the signal to noise ratio. The diffuse emission detected here is complex and very extended, consisting of two main features. A diffuse source is visible around the brightest optical galaxy, classified as cD galaxy by Dressler (1980). Moreover, diffuse emission is detected to the east, consistent with the NVSS image (Giovannini et al. 1999) and with the 74 MHz image of Kassim et al. (2001). This feature is classified by the latter authors as the east relic. We note that in Fig. 3, there are holes of radio emission north of the discrete sources S7 and S3. We do not detect in our image any radio emission in the region of the western relic of Kassim et al. (2001).
A possible connection between the two components of the diffuse emission cannot be excluded on the basis of our image. To better investigate this point, we produced an image where the discrete sources embedded within the diffuse emission are subtracted. The procedure was as follows: we first obtained an image of discrete sources, by selecting from the original data set only the data from the long baselines, which do not contain the extended halo emission. This image was then subtracted from the total image. The map obtained in this way is presented in Fig. 4, which has a higher resolution with respect to that reported in Fig. 3, to better show the structure. It is clear from Fig. 4 that the subtraction of discrete sources is only partial. We note, however, that the two diffuse sources are both irregular in shape, and there is a deficit of radio emission in between them. Therefore we consider them as two separate sources. The diffuse emission west of sources S1 and S2 in Fig. 3 is not visible here, because of its very low surface brightness.
The polarization image is quite noisy, allowing only to derive upper limits of 9% and 15% to the polarization degree of the western and eastern diffuse features, respectively.
The determination of the center of this cluster is not obvious, since the cluster shows a very asymmetric morphology in X-ray and two major clumps in the optical, neither of them lying on the off-center peak of the X-ray emission (Zabludoff & Zaritsky 1995). The center given in Table 1 is close to the X-ray peak, which is about 3.5′ north of the eastern optical peak. In Fig. 4, we indicate with star-symbols the centers of the two optical clumps, as given by Zabludoff & Zaritsky (1995). It is interesting to note that the two components of the diffuse emission are associated with the two optical clumps. The classification of these diffuse sources as a halo and a relic is tentative. It is based on the presence of a cD galaxy in the western optical clump, and therefore the indication that this clump is the main cluster. Alternatively, the two diffuse sources could be i) two halos according to the optical galaxy distributions, ii) two relics according to the X-ray image. We can generally conclude that the diffuse emission in A754 is quite complex, reflecting the complexity of the dynamical state of this cluster (see also the structure analysis by Buote & Tsai 1996 and the ASCA temperature map by Markevitch et al. 1998). No cooling flow (White et al. 1997, Peres et al. 1998) is present in this cluster. Fusco-Femiano et al. (2002) report the detection of hard X-ray emission at the 3.2 level from this cluster, possibly of Inverse Compton origin. From the comparison between the X-ray data and the present radio data, they infer a magnetic field of 0.1 G.
For the central radio halo, Kassim et al. (2001) obtain flux densities of 4 Jy and 750 mJy, at 74 MHz and 330 MHz, respectively, leading to a spectral index 1.1. The comparison between the present flux in Table 3 and that at 0.3 GHz given by Kassim et al. (2001) leads to a spectral index of the halo of 1.5. This is steeper than the spectrum in the 74-330 MHz range, indicating the presence of a possible spectral cutoff.
In the 74 MHz map of Kassim et al. (2001), the relic has a flux density of 1.45 Jy. It is significantly less extended than in the present map and it is located at the eastern boundary of the diffuse source detected here, including the discrete source S8. Therefore, we can only obtain a lower limit to the spectral index ( 1). An upper limit 1.7 is derived from the lack of a detection above 3 sigma in the 330 MHz image.

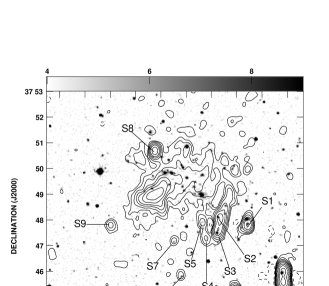

3.4 Abell 1914
A very steep spectrum radio source (4C 38.39, 2) was detected by Komissarov & Gubanov (1994) and Roland et al. (1985). The diffuse emission has been reported also by Kempner & Sarazin (2001) as a result of their search for halo and relic candidates in the Westerbork Northern Sky Survey (WENSS) at 0.3 GHz. The low resolution map presented in Fig. 5 shows the entire diffuse emission, which is more complex and extended than in any previous images. The total flux density estimated here is higher than that obtained from the NVSS (50 mJy, Giovannini et al. 1999), confirming that some structure is missing in the NVSS image. The higher resolution map in Fig. 6 allows one to distinguish the discrete sources. The elongated feature south of source S8 is completely resolved out in high resolution images (e.g. the FIRST) and therefore is part of the halo, which looks quite irregular in shape.
A spectrum of this source, using the present data and the flux densities published by Komissarov & Gubanov (1994) is given in Fig. 7. The 0.3 GHz flux of 114 mJy given by Kempner & Sarazin (2001) is not reported in the figure, since it is likely understimated because of limited sensitivity. The spectrum is very steep, with an overall slope of 1.8. For a discussion of the spectral behaviour and its possible curvature we refer to the paper of Komissarov & Gubanov (1994).
No polarized flux is detected in this halo down to a level of 3%.
In the morphological and dynamical analysis performed by Buote & Tsai (1996), the values of the power ratios P1/P0 and P3/P0 for this cluster are representative of a disturbed system. This is confirmed by the asymmetric X-ray brightness distribution detected in the Chandra ACIS image, retrieved from the Chandra archive. No significant mass accretion rate is derived by White (2000), indicating that there is no cooling flow in this cluster.

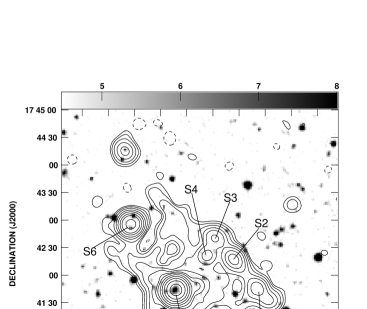
3.5 Abell 2219
A giant radio halo is detected in this cluster, as shown in Fig. 8. The strong radio source at the cluster center is the blend of three sources (see the high resolution image in Fig. 9) identified with cluster galaxies (see Fig. 7 and Owen et al. 1992). The northermost radio galaxy (S4 in Fig. 8) shows a tailed structure (B1638+468, Owen & Ledlow 1997). The polarization map is noisy. Only an upper limit of 6.5% to the polarized flux has been obtained.
The radio halo has a rather regular and symmetric structure, reminiscent of typical well known halos (Coma, A2255, A2163). It is 10 times more powerful than the halo in the Coma cluster, comparable with the giant halo in A2163 (Feretti et al. 2001).
Some diffuse emission in this cluster is also detected in the WENSS image at 0.3 GHz (Kempner & Sarazin 2001), but their total flux density is clearly understimated because of limited sensitivity.
From the X-ray image obtained with the Rosat HRI, presented by Rizza et al. (1998), it is evident that this cluster shows significant substructure, with two main X-ray peaks displaced by about 1′. According to Allen & Fabian (1998), no cooling flow is present in this cluster.

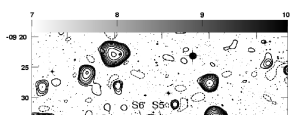
3.6 Abell 2390
The diffuse emission in the center of this cluster is presented in Fig. 10. It is quite irregular showing sharp and almost straight edges toward south and east, and filaments to the north (note the hole of emission north of the source S5). The western edge is confused by several discrete radio sources. The strongest source at the center, labelled S5, is identified with the cluster dominant cD galaxy (Pierre et al. 1996). This source is barely resolved on the arcsec scale (size 3′′ , Owen et al. 1993)
The analysis of optical and X-ray ROSAT data (Pierre et al. 1996, Böhringer et al. 1998) indicates that the center of the thermal gas distribution coincides with the position of the cD galaxy and that the cluster is characterized by a massive cooling flow. Recent Chandra data (Allen et al. 2001) confirm the presence of a cooling flow in the cluster central region and show in addition some substructure on the large scale ( 2′), suggesting that the cluster has not fully relaxed following its most recent merger activity.
The diffuse radio emission, located at the cluster center and smaller than 2′ in size, is unlikely to be related to the X-ray substructure, i.e. the cluster merger. Based on the presence of a cluster cooling flow and of a strong central radio galaxy, the diffuse source in this cluster naturally falls in the class of mini-halos, i.e. halos of moderate size around powerful radio galaxies at the center of cooling flows (as in the Perseus cluster). The mini-halo in A2390 is similar in size to that of the Perseus cluster ( 640 kpc in diameter, scaled to our Hubble constant, Burns et al. 1992), but its structure is remarkably non spherical and more irregular (see also the minihalo in A2626, Gitti et al. 2002b).
This is the only diffuse source of the present sample where polarized flux has been detected (see Fig. 11). The polarization percentage is highest in the southern region of the diffuse emission, with values between 10% and 20%, whereas in north-western and eastern regions the polarization degree is of 8-10%. The strong central source identified with the cD galaxy is almost unpolarized (1%). The equipartition magnetic field is of the order of 1 G as expected from the model of Gitti et al. (2002a). The orientation of the magnetic field, predicted to be isotropic by the above mentioned model, cannot be established with 1.4 GHz data, which could be affected by Faraday Rotation.


4 Correlation between halo radio power and cluster X-ray luminosity
The presence of a correlation between the halo radio power and the cluster X-ray luminosity has been first noted by Liang et al. (2000) and confirmed in further studies (Feretti 2000, Govoni et al. 2001). By adding the present data to data in the literature, we obtain the correlation in Fig. 12.
We stress here that the correlation applies to clusters showing major merger events, and therefore cannot be generalized to all clusters.
Using only clusters with giant radio halos (size 1 Mpc), the best fit between radio and X-ray luminosity is P. The addition of the smaller size halos (Fig. 13), add a larger dispersion of the X-ray data in the region of lower radio power. The overall correlation does not change significantly, however we note that at P1.4GHz lower than 3 1024 W Hz-1, the correlation seems to be virtually absent, with the only indication that halos are present in clusters with X-ray luminosity 1045 erg s-1. No firm conclusion can be drawn, as the number of low power radio halos is presently quite small.
An extrapolation of the large radio halo correlation to low radio and X-ray luminosities indicates that clusters with LX 1045 erg s-1 would host halos of power of a few 1023 W Hz-1. With a typical size of 1 Mpc, they would have a radio surface brightness lower than current limits obtained in the literature and in the NRAO VLA Sky Survey. Therefore, it is possible that future new generation instruments (LOFAR, SKA) will allow the detection of low brightness/low power large halos in virtually all the merging clusters. On the other hand, future highly sensitive data will clarify whether the correlation holds also at low power and for small size halos, or the cutoff in the X-ray luminosity suggested by Fig. 13 is real.
5 Conclusions
VLA images of 6 clusters of galaxies confirm the presence of a central diffuse radio halo source in A401, A545, A754, A1914, and A2219 while in A2390 a mini-halo source has been found.
In A754 a second diffuse component has been detected. The two diffuse sources in this cluster could be classified as a halo and a relic source, but we cannot exclude that they are actually two halos or two relics, given the very complex structure of this cluster.
The radio halo in A2219 is among the largest sources known in the literature: it is 10 times more powerful than the halo in the Coma cluster and more than 2 Mpc in size.
Present results confirm the correlation of radio halos with cluster merger processes while mini-halos seem to be correlated to the presence of an active cD galaxy in cooling flow clusters.
Adding these new data to the literature data we obtained a sample of 16 well known radio halos with a linear size larger than 1 Mpc. For these sources we derived the correlation between the radio and X-ray luminosity. The estimated best fit is P, suggesting that clusters with a low X-ray luminosity ( 1045 erg s-1) would host halos too faint to be detected with the present generation of radio telescopes. However, the addition of smaller size radio halos could suggest the presence of a cutoff in the previous correlation: radio halos could be absent in clusters with a X-ray luminosity lower than 1045 erg s-1. The future generation of new radio telescopes (LOFAR, SKA) will allow the investigation of this point.
Acknowledgements.
We thank the referee David Buote for his useful comments, and for pointing out the X-ray structure of A1914, as detected from the archive Chandra ACIS image. This work was partially funded by the Italian Space Agency.References
- (1) Allen S.W. & Fabian A.C., 1998, MNRAS 297, L57
- (2) Allen S.W., Ettori S. & Fabian A.C., 2001, MNRAS 324, 877
- (3) Becker R.H., White R.L. & Helfand D.J., 1995, ApJ 450, 559
- (4) Böhringer H., Tanaka Y., Mushotzky R.F., Ikebe Y. & Hattori M., 1998, A&A 334, 789
- (5) Burns J.O., Sulkanen M.E., Gisler G.R. & Perley R.A., 1992, ApJ 388, L49
- (6) Buote D.A., 2001, ApJ 553, 15
- (7) Buote D.A. & Tsai J. C., 1996, ApJ 458, 2
- (8) Condon J.J., Cotton W.D., Greisen E.W., et al. , 1998, AJ 115, 1693
- (9) David L.P., Forman W. & Jones C., 1999, ApJ 519, 533
- (10) Dressler A., 1980, ApJS 42, 565
- (11) Ebeling H., Voges W., Böhringer H., et al. , 1996, MNRAS 281, 799
- (12) Enßlin T.A., Biermann P.L., Klein U. & Kohle S., 1998, A&A 332, 395
- (13) Enßlin T.A. & Brüggen M., 2002, MNRAS 331, 1011
- (14) Feretti L., 2000, in The Universe at low Radio Frequencies, Symposium IAU 199, in press, astro-ph/0006379
- (15) Feretti L., Fusco-Femiano R., Giovannini G. & Govoni F., 2001, A&A 373, 106
- (16) Fusco-Femiano R., Orlandini M., De Grandi S., et al. , 2002, A&A, Submitted
- (17) Giovannini G., Tordi M. & Feretti L., 1999, New Astronomy 4, 141
- (18) Giovannini G. & Feretti L. 2000, New Astron., 5, 335
- (19) Gitti M., Brunetti G. & Setti G. 2002a, A&A, 386, 456
- (20) Gitti M., Brunetti G., Setti G. & Feretti, L. 2002b, Proceedings of the Conference on “Matter and Energy in Clusters of Galaxies”, ASP Conf. Series, eds. S. Bowyer & C.-Y. Hwang, in press (astro-ph/0207145)
- (21) Govoni F., Feretti L., Giovannini G., et al. , 2001, A&A 376, 803
- (22) Harris D.E., Kapahi V.K. & Ekers R.D., 1980a, A&AS 39, 215
- (23) Harris, D.E., Pineda, F.J., Delvaille, J.P., et al. , 1980b, A&A 90, 283
- (24) Kassim N.E., Clarke T.E., Enßlin T.A., Cohen A.S. & Neumann D.M., 2001, ApJ 559, 785
- (25) Kempner J. C. & Sarazin C.L., 2001, ApJ 548, 639
- (26) Komissarov S.S. & Gubanov A.G., 1994, A&A 285, 27
- (27) Ledlow M. J. & Owen F.N., 1995, Astron. J. 109, 853
- (28) Liang H., Hunstead R.W., Birkinshaw M. & Andreani P., 2000, ApJ 544, 686
- (29) Markevitch M., Forman W. R., Sarazin C. L. & Vikhlinin A., 1998, ApJ 503, 77
- (30) Owen F.N. & Ledlow M. J., 1997, ApJS 108, 41
- (31) Owen F.N., White R.A. & Burns J.O., 1992, ApJS 80, 501
- (32) Owen F.N., White R.A. & Ge J-P., 1993, ApJS 87, 135
- (33) Pacholczyk, A.G., 1970, Radio Astrophysics, Freeman and Co., San Francisco.
- (34) Peres C.B., Fabian A.C., Edge A.C., et al. , 1998, MNRAS 298, 416
- (35) Pierre M., Le Borgne J.F., Soucail G. & Kneib J.P., 1996, A&A 311, 413
- (36) Rizza E., Burns J.O., Ledlow M.J., et al. , 1998, MNRAS 301, 328
- (37) Roland J. Sol, H. Pauliny-Toth I. & Witzel A. 1981, A&A 100, 7
- (38) Roland J., Hanisch R.J., Veron P. & Fomalont E., 1985, A&A 148, 323
- (39) Schneider D.P., Gunn J.E. & Hoessel J.G, 1983, ApJ 264, 337
- (40) Slezak E., Durret F. & Gerbal D, 1994, Astron J 108, 1996
- (41) Struble M.F. & Rood H.J., 1999, ApJS 125, 35
- (42) White D.A., Jones C. & Forman W., 1997, MNRAS 292, 419
- (43) White D.A., 2000, MNRAS 312, 663
- (44) Wu X-P., Xue Y-J. & Fang L-Z., 1999, ApJ 524, 22
- (45) Zabludoff A.I. & Zaritsky D., 1995 ApJ 447, L21