Galactic Gamma-Ray Halo of
the Nearby Starburst Galaxy NGC 253
Abstract
Recently, the CANGAROO-II telescope detected diffuse TeV gamma-ray emission from a nearby edge-on starburst galaxy, NGC 253. The emission mechanism is discussed in this report. We review the emissions of radio-to-TeV gamma-rays from NGC 253, and present a model of the non-thermal emissions due to synchrotron radiations and inverse Compton scatterings. A halo model successfully explains the multiband spectrum of NGC 253.
1 Introduction
The CANGAROO-II imaging atmospheric Cherenkov telescope has detected TeV gamma-ray emission from a nearby edge-on starburst galaxy, NGC 253 (Itoh et al., 2002a, b). This TeV emission is spatially extended and temporally steady, whose nature is different from that of previously observed extragalactic objects of the active galactic nuclei (AGN) class. This is the first detection of TeV gamma-rays from a normal-sized spiral galaxy like our Galaxy. We can learn how high-energy particles propagate on the galactic scale from the observations of NGC 253 by TeV gamma-rays.
The acceleration and propagation of galactic cosmic rays (GCRs), which are observed directly near the earth, are among the big topics in physics and astrophysics. The distribution of GCR with an energy of less than 10 GeV in the Galaxy has been surveyed by tracing diffuse gamma-rays which are produced by the interaction of GCR with the interstellar medium(Hunter et al., 1997). The resultant distribution of diffuse gamma-rays as a function of the galactic longitudes and latitudes has been argued based on the scenario of the SNR origin of GCR. In the TeV energy range (LeBohec, S. et al., 2000; Aharonian et al., 2001), searches for diffuse gamma-rays in our Galaxy have been also carried out to obtain the spatial distribution of TeV cosmic rays. It is, however, difficult due to the limitations of the present techniques. In some respects, studies of nearby galaxies which are near enough to obtain detectable fluxes from outside are more reasonable than that of our Galaxy from inside. A further question naturally arises as to whether other galaxies also harbour cosmic-rays like ours. Photons from radio to gamma-rays produced by cosmic-rays would reveal their existence. The electrons of GeV energies associated with edge-on galaxies have been known by radio observations (Berzinskii et al., 1990; Beck, 1997). EGRET demonstrated clear evidence for the existence of GeV particles in LMC (Sreekumar et al., 1992); however, no evidence for such high-energy particles as TeV in normal galaxies had been known, except for that from our Galaxy. Obviously, investigating nearby galaxies like NGC 253 is a key.
In Section 2 we review the emissions of radio-to-TeV gamma-rays of this galaxy. In Section 3 we present a model which explains the observed multiband spectrum and the spatial distribution of cosmic rays in NGC 253. We discuss the propagation of high-energy particles into the halo, the reacceleration of particles due to the galactic wind, and the total cosmic-ray energy of NGC 253 in Section 4.
2 Multi-wavelength Spectrum
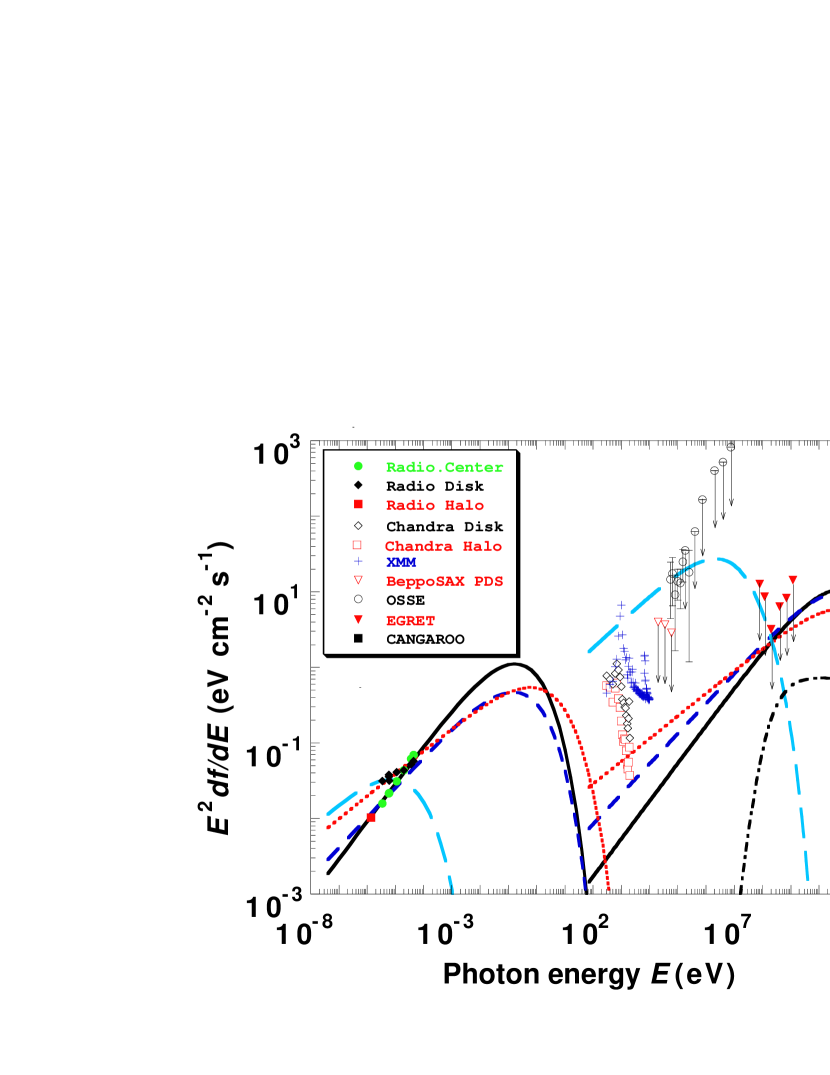
The distance to NGC 253 is as close as 2.5 Mpc (Vaucouleurs, 1978) with a visual size of 0.3∘ from Earth. This is one of the best targets where the cosmic-rays density is expected to be high due to its high supernova rate (Völk et al., 1996). Here, we summarize previous studies at NGC 253 in various photon energies. The compiled fluxes and upper limits on NGC 253 are shown in Fig. 1.
The EGRET instrument on board the Compton Gamma Ray Observatory(CGRO) has reported stringent upper limits for GeV gamma-rays (Sreekumar et al., 1994; Blom et al., 1999). On the other hand, the OSSE on board CGRO has claimed the detection of 50200 keV gamma-rays (Bhattacharya et al., 1994). The PDS on board BeppoSAX gives a contradicting upper limit on the hard X-ray emission just below OSSE’s energy band (Cappi et al., 1999).
At TeV energies, CANGAROO-II has detected diffuse emission. The size of the emitting region is similar to, or larger than, the optical image of NGC 253 (Itoh et al., 2002a, b). A simple power-law fit gave a soft spectral photon index of (Itoh et al., 2002b), suggesting a cutoff.
The radio continuum emission consists of three main components: a central region, a disk component, and a halo extending (Hummel et al., 1984; Carilli et al., 1992). The radio spectral energy index is in the disk, and it is steepened to in the halo. The fractional polarization increases with the distance from the plane (less than 4% in the disk, up to 15% in the halo in 1.4GHz (Carilli et al., 1992), and reaching 40% at 10GHz (Beck et al., 1994)). The turbulent magnetic fields estimated from the fractional polarization are in the disk and in the halo (Beck et al., 1994). The radio emission in the central region of shows a flat spectrum with an energy index of (Hummel et al., 1984). From high-resolution radio observations of the inner 200 pc of NGC 253, Ulvestad & Antonucci (1997) detected compact radio sources, half of which are in the HII regions with flat spectra. The other half are presumably synchrotron supernova remnants.
The X-ray structure of NGC 253 is complex, and consists of point sources, hot intersteller matter (ISM) in the disk and the central region, and the halo. The diffuse X-ray emission from the halo was first detected with Einstein, and followed up by ROSAT, ASCA, BeppoSAX, XMM-Newton, and Chandra (Watson et al., 1984; Fabbiano, 1988; Pietsch et al., 2000; Ptak et al., 1997; Pietsch et al., 2001; Strickland et al., 2000, 2002; Cappi et al., 1999; Weaver et al., 2002). X-ray spectral studies of the disk and the halo show the existence of optically thin thermal plasmas at temperatures of keV. Chandra and XMM-Newton observations of the central region of NGC 253 reveal the existence of a heavily absorbed high-temperature thermal plasma component ( keV) with an ionized iron K emission line (Pietsch et al., 2001; Weaver et al., 2002). This absorbed component is also seen in the spatially integrated spectra over the whole galaxy obtained with the previous X-ray satellites (Ptak et al., 1997; Cappi et al., 1999; Ohashi et al., 1990). Based on a magnetic field strength of in the central region, estimated from the standard minimum energy assumption, Weaver et al. (2002) suggested that the inverse Compton process makes only a minor contribution to the hard X-ray emission.
3 Inverse Compton Emission Halo Model
We first discuss the emission mechanism at gamma-ray energies from the multi-wavelength spectrum, as shown in Fig. 1. Goldshmidt & Rephaeli (1995) reported that the gamma-ray emission detected by OSSE (the blank circles in Fig. 1) was attributed to the Inverse Compton Scattering (IC) of ubiquitous far-infrared(FIR) photons from dusts observed around the center of the galaxy. However, a simple extrapolation to the GeV range exceeds the 2 upper limit of cm-2 s-1 (Blom et al., 1999) obtained by EGRET (the red triangles). The multi-wavelength spectrum suggests that the origin of TeV gamma-rays should be different from that of sub-MeV gamma-rays.
If we assume that the energy spectrum of particles is a power law with an exponential cut, and that the power-law index is softer than , the index of the differential photon spectra in GeV energies due either to the emissions of decay produced by the collisions of high-energy protons with the matter or non-thermal bremsstrahlung of the high-energy electrons also becomes softer than , leading to a contradiction with the EGRET upper limit.
The remaining possibility of the emission mechanism of GeV and TeV gamma-rays is IC scattering. When the power-law index of the electron energy spectrum is assumed to be , the index of the differential photon spectrum of the IC becomes nearly .
The very large radio halo of (Carilli et al., 1992) would suggest the existence of a population of very high-energy electrons which emit our TeV gamma-rays other than those concentrated near to the central or disk region of the galaxy, which might emit photons observed by OSSE. On the other hand, there are sure target photons for IC, such as CMB as well as very abundant FIR photons. Here, we quantitatively examine whether these electrons and photons are responsible for TeV emissions.
We assume that the total number spectrum of electrons at the source has the following form:
| (1) |
where is an electron density factor, the Lorentz factor, and the maximum Lorentz factor of the electrons (a cutoff), respectively. The spectrum of the IC emission is given by
| (2) |
where is the distance to the source, the number spectrum of the soft photon, the speed of light, the energy of the target photons, the energy of the scattered photons, the energy of the electrons, and the Klein-Nishina cross section for IC scattering, respectively.
We take the FIR photon spectrum model, in which the dust absorption efficiency is proportional to the photon frequency, as described in Goldshmidt & Rephaeli (1995). The total FIR luminosity is , with from cool dust having a temperature K and from warm dust with K, respectively. Here, we assume that the photon field is isotropic. The energy density of the photon field at radius is approximated as . We simply adopt the average value of in a spherical region with a size of as the photon density. The average photon density () is . The optical photon field is assumed to be a diluted blackbody with a temperature of K and a luminosity of (Pence, 1980). Assuming the value of the electron spectrum index , we could determine the two parameters and for the electron spectrum as fitting the CANGAROO-II flux and keeping the EGRET upper limit.
Here, we adopt a one-zone model with two different sizes for simplicity. First, we adopt kpc, suggested by the size of TeV emitting region (Itoh et al., 2002a), with assuming a cosmic-ray halo. We considered three populations of photons as the target of the IC process, IR, optical, and CMB. The energy densities for each population are eV cm-3, eV cm-3, and eV cm-3, respectively. Although is greater than , its contribution was suppressed by the Klein-Nishina effect. In Fig. 1, the solid and dashed lines represent the synchrotron and IC emission models with the power-law index of the electrons being and , respectively. Here, the value of was chosen based on constraints by the shock acceleration () and reconciliation between the EGRET upper limits and the CANGAROO-II TeV results () (Itoh et al., 2002a, b). The fluxes of the TeV gamma-rays and the upper limit of EGRET restricted the parameter choices of the electron spectrum: cm-2 and TeV) for , cm-2 and TeV) for , and cm-2 and TeV) for , respectively. The IC fluxes at keV for are predicted to be the same as the Chandra X-ray data in the halo region. This X-ray data imply these halo models favor the value of . We find the total energies and average energy densities of the electrons to be within kpc: erg and eV cm -3 for , erg and eV cm -3 for , and erg and eV cm -3 for , respectively. The strength of the magnetic field () were estimated to be for , for , and for , respectively, by adjusting the calculated synchrotron emissions to the radio halo data. These values are smaller than the estimations obtained by the fractional polarization in radio measurements (Beck et al., 1994).
On the other hand, we examined the case for a disk component of cosmic-rays. We adopted a higher average photon density within kpc. The values of the average photon energy densities are eV cm-3 and eV cm-3. In Fig. 1, the dotted lines represent the emission models from a disk with the power-law index of the electrons of , which was estimated based on the radio data of the disk. The parameters of the electron spectrum are cm-2 and TeV). We found the total energy and average energy density of the electrons within kpc to be: erg and eV cm -3. The strength of the magnetic field, , reproduces the radio fluxes from the disk. In the case of a soft electron spectrum with , fittings for the CANGAROO-II fluxes and the upper limits of EGRET are rather difficult, as shown in Fig. 1. The high-energy electron halo model explained better the radio and GeV-TeV emission.
The halo model, however, cannot describe any emissions in the keV-MeV energy region. Goldshmidt & Rephaeli (1995) introduced the IC model with a very localized FIR and high-energy electrons in order to explain the OSSE result. Their IC model should require a cutoff in the energy spectrum of electrons to reconcile with the EGRET upper limits. We could reproduce the OSSE flux by adopting an average photon density of eV cm-3 within kpc, and taking the following parameters of the electron spectrum: for example, in case of , cm-2 and GeV). The total energy and average energy density of the electrons are erg and eV cm -3, respectively. Such a high density and low cutoff energy may be reasonable, considering the starburst characteristics and FIR density around the center of this galaxy. This is also consistent with the EGRET upper limits, as shown in Fig. 1 (the long-dashed line). The synchrotron emission was also reproduced along with the strengths of the magnetic field, , which is almost the same value as that adopted by Goldshmidt & Rephaeli (1995). However, the model IC flux at or above keV is more than one order of magnitude higher than the Chandra and XMM X-ray data, which were corrected for the photoelectric absorption in both the Galaxy and NGC 253. The model IC flux in hard X-ray energy band is also higher than the BeppoSAX PDS X-ray data, while these data were not corrected for the absorption which was estimated to be negligibly small in the higher energy. We concluded that some modifications are necessary for this model.
Hitherto, we considered only the possibility of a leptonic origin of the observed TeV gamma rays; however, we should check before reaching any final conclusion whether hadronic models can explain CANGAROO-II’s positive detection consistently with the EGRET upper limits. In this estimation of gamma-ray emission by -decay(Mori, 1997), we assume the proton-to-electron ratio to be 300, which is rather high compared to that of GCRs () and accordingly is a favourable case for hadronic models. We assume the parameters for electrons to be with a higher cutoff energy of 10 TeV and , which we have shown previously. We also assumed the total mass of the gas which interacts with protons to be (Puche et al., 1991; Houghton et al., 1997). The expected gamma-ray flux is shown in Fig. 1 as the dot-dashed line. It can be clearly seen that hadronic models fail to explain the observations, even in the favourable case.
4 Propagation and Acceleration
The high-energy electrons in the halo of the galaxy explain most of multiband spectrum of NGC 253 quite well. Here, we discuss the origin of these cosmic-ray electrons and the total cosmic-ray energy, which should be compared with our Galaxy.
The biggest question is whether high-energy electrons can propagate out to a distance of 10kpc from the disk of the galaxy without any severe energy losses. Electrons may diffuse out to a distance of within their cooling time () due to synchrotron and IC losses, where is inversely proportional to a sum of the energy densities of the magnetic field and the photons in ambient space, and is also inversely proportional to the energy of the electrons. When the diffusion coefficient of electrons () of order is used, we found that electrons of TeV which emit sub-TeV gamma-rays can propagate to a distance of kpc, assuming the strength of magnetic field to be , and the energy density of FIR photon to be kpc. The assumption regarding the energy dependence of is crucial for this estimation.
The diffuse X-ray emission extending from the nuclear region toward the halo is thought to be due to the galactic wind (super-wind), powered by supernovae occurring in the nuclear starburst region (Chevalier & Clegg, 1985), which has been successfully described by many papers based on hydrodynamical simulations (Tomisaka et al., 1988; Strickland & Stevens, 2000; Suchkov et al., 1994). Continuous supernova explosions heat up the ISM in the nuclear starburst region, and creates a bubble of high-temperature plasmas with . The bubble expands while sweeping and pushing cool ISM and ambient gas up towards the halo. A galactic wind running freely along the galactic minor axis is formed around after the start of the starburst activity. Wind with a velocity of finally hits the ambient cool gas and forms a shock in the halo. This picture explains that the image of the synchrotron radio halo at generally matches the diffuse X-ray emission (Pietsch et al., 2000). This shock in the halo may accelerate particles by the Fermi process.
The maximum energy of electrons accelerated by this process is estimated to be 8 25 TeV if we assume a shock velocity of , a magnetic field of 2 G, and a starburst age of yr by equating the acceleration rate with the cooling rate due to the synchrotron and IC losses. The estimated maximum energy of electrons agrees well with that determined from TeV gamma-ray spectrum by CANGAROO observation. Another possibility of particle acceleration in the termination shock of the galactic wind has been proposed by Jokipii & Morfill (1985). These two cosmic-ray acceleration processes may be related to the rather hard spectrum required for the electrons in the halo.
Finally, we discuss the total cosmic-ray energy in the halo. The electron energy density was obtained to be eV cm-3, which is one order higher than that of our Galaxy. If we assume the proton to electron ratio to be 100, this implies that the total energy of cosmic rays in NGC 253 may amount to , which is one hundred-times higher than that for our Galaxy. Note that the value for our Galaxy was derived assuming a disk population of cosmic-rays. If our Galaxy has a halo with the same cosmic-ray density, the deviation becomes smaller. The starburst age and the supernova rate in NGC 253 were estimated to be and , respectively (Rieke et al., 1988). Thus, taking the ambiguities (e.g. the proton to electron ratio) into account, the starburst activity characterizing NGC 253 may explain the large amount of total energy of cosmic rays.
References
- Aharonian et al. (2001) Aharonian, F.A. et al. 2001, A&A, 375, 1008
- Beck et al. (1994) Beck, R. 1994, A&A, 292, 409
- Beck (1997) Beck, R. 1997, The Physics of Galactic Halos, Lersch, H., Dettmar R.-J., Mebold, U., & Schlickeiser, R., Berlin: Akademie Verlag, 135
- Berzinskii et al. (1990) Berzinskii, V.S. et al. 1990, Astrophysics of Cosmic Rays, Amsterdam: North-Holland
- Bhattacharya et al. (1994) Bhattacharya, D. et al. 1994, ApJ, 437, 173
- Blom et al. (1999) Blom, J.J., Paglione, T.A.D, and Carraminana, A. 1999, ApJ, 516, 744
- Cappi et al. (1999) Cappi, M. et al. 1999, A&A, 350, 777
- Carilli et al. (1992) Carilli, C.L. et al. 1992, ApJ, 399, L59
- Chevalier & Clegg (1985) Chevalier, R. A., & Clegg, A. W., 1985, Nature, 317, 44
- Fabbiano (1988) Fabbiano, G. 1988, ApJ, 330, 672
- Goldshmidt & Rephaeli (1995) Goldshmidt, O. & Rephaeli, Y. 1995, ApJ, 444, 113
- Houghton et al. (1997) Houghton, S. et al. 1997, A&A, 325, 923
- Hummel et al. (1984) Hummel, E., Smith, P., & van der Hulst, J.M. 1984, A&A, 137, 138
- Hunter et al. (1997) Hunter, S.D. et al. 1997, ApJ, 205, 481
- Itoh et al. (2002a) Itoh, C., et al. 2002a, A&A, 396, L1-4
- Itoh et al. (2002b) Itoh, C., et al. 2002b, submitted for publication
- Jokipii & Morfill (1985) Jokipii, J. R. & Morfill, G. E. 1985, ApJ, 290, L1.
- LeBohec, S. et al. (2000) LeBohec, S. et al. 2000, ApJ, 539, 209
- Mori (1997) Mori, M. 1997, ApJ, 478, 225
- Ohashi et al. (1990) Ohashi, T. et al. 1990, ApJ, 365, 180
- Pence (1980) Pence, W. D. 1980, ApJ, 239, 54
- Pietsch et al. (2000) Pietsch, W. et al. 2000, A&A, 360, 24
- Pietsch et al. (2001) Pietsch, W. et al. 2001, A&A, 365, L174
- Ptak et al. (1997) Ptak, A. et al. 1997, AJ, 113, 1286
- Puche et al. (1991) Puche et al. 1991, AJ, 91, 456
- Rieke et al. (1988) Rieke, G. H., Lebofsky, M. J., and Walker, C. E. 1988, ApJ, 325, 679
- Sreekumar et al. (1992) Sreekumar, P. et al. 1992, ApJ, 400, L67
- Sreekumar et al. (1994) Sreekumar, P. et al. 1994, ApJ, 426, 105
- Strickland & Stevens (2000) Strickland, D. K., & Stevens, I. R. 2000, MNRAS, 314, 511
- Strickland et al. (2000) Strickland, D. K., et al. 2000, AJ, 120, 2965
- Strickland et al. (2002) Strickland, D. K., et al. 2002, ApJ, 568, 689
- Suchkov et al. (1994) Suchkov, A. A., et al. 1994, ApJ, 430, 511
- Tomisaka et al. (1988) Tomisaka, K., & Ikeuchi, S. 1988, ApJ, 330, 695
- Ulvestad & Antonucci (1997) Ulvestad , J.S. & Antonucci, R.R. 1997, ApJ, 488, 621
- Vaucouleurs (1978) Vaucouleurs, G. de 1978, ApJ, 224, 710
- Völk et al. (1996) Völk, H.J., Aharonian, F.A., & Breitschwerdt, D. 1996, Sp. Sci. Rev., 75, 279
- Watson et al. (1984) Watson, M. G., Stanger, V., & Griffiths, R. E. 1984, ApJ, 286, 144
- Weaver et al. (2002) Weaver, K. A. et al. 2002, ApJ, 576, L19