XMM-Newton study of hard X-ray sources in IC443
We present XMM-Newton observations of hard X-ray emission from the field of IC443, a supernova remnant interacting with a molecular cloud. The hard emission from the field is dominated by 12 isolated sources having 2–10 keV flux . Only a fraction of the sources are expected to be extragalactic or stars on statistical grounds, while the others may be associated with the remnant. We have analyzed near-infrared K band and also DSS optical data for all of the detected sources, finding that six X-ray sources are located in a relatively small region where there is strong 2.2 infrared emission, indicating interaction with a molecular cloud. The source 1SAX J0618.0+2227, the brightest in this region (excluding the plerion), is resolved with XMM-Newton into two sources, one of which is extended and has a hard power law spectrum photon index 1.5) and shows some indications of spectral line signatures (e.g. Si), while the other is point-like and has a featureless spectrum of steeper photon index 2.2. Possible interpretations of some of the discrete sources in terms of interaction between the SNR and the molecular cloud are discussed.
Key Words.:
Acceleration of particles; Radiation mechanisms: non-thermal; ISM: clouds; ISM: cosmic rays; ISM: individual object: IC443; ISM: supernova remnants1 Introduction
The middle-aged SNR IC443 (G189.1+3.0) appears in multiwavelength images as an extended ( 45 arcmin size) source of both nonthermal and thermal continuum emissions with rich line spectra from radio to X-rays. The extended component of the thermal soft X-ray emission from IC 443 has been observed with the Einstein satellite and the HEAO 1 A2 experiment (Petre et al. 1988), ROSAT (Asaoka & Aschenbach 1994) and ASCA (Keohane et al. 1997; Kawasaki et al. 2002). On the other hand, the hard X-ray emission from IC443 in the 2–10 keV band, detected by Wang et al. (1992) using data of the Ginga satellite, has been studied in detail only recently. Keohane et al. (1997), using the ASCA X-ray observatory, mapped for the first time the hard X-ray emission of IC443, concluding that most of the 2–10 keV photons came from an isolated emitting feature and from the southeast elongated ridge of hard emission. They also suggested that synchrotron emission of 10 TeV regime electrons provides the explanation for these observed features. BeppoSAX observations in the hard X-ray band resolved the two ASCA sources into two compact sources of hard emission up to 10 keV (1SAX J0617.1+2221 and 1SAX J0618.0+2227) and a harder component up to 100 keV, indicating that a synchroton origin is unlikely, and suggesting electron acceleration by a slow shock in a molecular cloud (Bocchino & Bykov 2000). While recent observations of 1SAX J0617.1+2221 with Chandra (Olbert et al. 2001) and XMM-Newton (Bocchino & Bykov 2001) have established the plerionic nature of this source, the debate is still open about the nature of 1SAX J0618.0+2227.
The morphology of IC443 at high X-ray energies is therefore expected to be very interesting. It is important to note that IC443 is associated with the EGRET source 3EG J0617+2238 (Esposito et al. 1996), but the relation between the remnant and the -ray source is not yet clear. In fact, the 95% error circle of the most recent-derived sky position of 3EG J0617+2238, reported by Hartman et al. (1999), does not include the plerion (see Fig. 1), and the other compact X-ray sources, even if the extrapolation of the X-ray flux of 1SAX J0617.1+2221 and 1SAX J0618.0+2227 to the EGRET regime indicates that there could be a direct relation (Bocchino & Bykov 2000). High-resolution hard-X-ray studies are therefore of great importance to understand this complicated object, also in the light of the recent discovery by Uchiyama et al. (2002) of very similar features in the hard X-ray emission of the SNR Cygni observed by the ASCA X-ray satellite. Compact sources with hard emission spectra in both IC 443 and in Cygni could be of similar nature e.g. shocked molecular clumps as was predicted by the model of Bykov et al. (2000).
Another interesting class of hard X-ray sources related to the SNR could be fast moving fragments of metal-rich ejecta interacting with the ambient medium. The isolated X-ray emitting ejecta fragments were discovered in the middle-aged Vela SNR (Aschenbach et al. 1995) and also in type Ia Tycho SNR (e.g. Decourchelle et al. 2001). A model of X-ray line emission from fast moving ejecta fragments predicts that the fragments interacting with molecular clouds are the brightest and they could be detected from a few kpc distances (Bykov 2002).
In this paper, we are not discussing the IC443 plerion, which was already described by Olbert et al. (2001) and Bocchino & Bykov (2001), while we will address in detail 1SAX J0618.0+2227, a source closely correlated with the molecular line emission region (Bocchino & Bykov 2000). Moreover, the combination of high sensitivity of the PN and MOS cameras aboard XMM-Newton to 2–10 keV photons with a few arcseconds angular resolution has allowed us to study the hard X-ray emission from the whole extended supernova remnant IC443 in great detail, thus discovering an additional extended component and a new set of weaker compact sources. Both were undetected in previous BeppoSAX and ASCA observations. In the present paper using the Cal/PV dedicated pointings on IC443 we present the counting and analysis of all the hard sources of X-ray emission within the boundary of the IC443 remnant with 2–10 keV flux , while a study of the diffuse hard X-ray emission of this remnant will be discussed elsewhere.
2 Observations and Data analysis
IC443 has been observed as part of the Cal/PV phase of the XMM-Newton satellite (Jansen et al. 2001). In this paper, we have used the observations listed in Table 1. Data from the two MOS (Turner et al. 2001) cameras and the PN (Strüder et al. 2001) camera have been used. MOS and PN cameras are CCD arrays which collect X-ray photons between 0.1 and 15 keV and have a field of view of . The pixel size is and for MOS and PN respectively, while the mirror PSF width is FWHM–HEW. The data have been acquired with the medium filter and in full image mode, and therefore the temporal resolution is low, 2.5 s and 73 ms for MOS and PN, respectively. The worse spatial resolution of the PN is compensated by its greater sensitivity, on the average 20-30% more than the combined two MOS.
| Obs. | Coord (J2000) | Tus/Ts111Unscreened and screened exposure times | Date |
|---|---|---|---|
| ksec | |||
| ptg1 | 23/10 | 26 Sep 2000 | |
| ptg2222Two pointings combined | 30/21 | 25 Sep 2000 | |
| ptg3b | 32/24 | 27 Sep 2000 | |
| ptg4 | 30/23 | 28 Sep 2000 |
The Standard Analysis System (SAS) software we have used (version 5.3) takes care of most of the required event screening. However, we have further screened the data to eliminate some residual hot pixels and occasional background enhancement due to intense flux of soft protons in the magnetosphere. In particular, we have extracted the background light-curve at energy keV and we have identified time intervals of unusually high count rates (typically more than 25 cnt s-1) and removed them from subsequent analysis. Moreover we have also selected events with values of the PATTERN keywords between 0 and 12 for MOS and between 0 and 4 for PN. The exposure time of the screened observations is also reported in Table 1. In the case of and , which are splitted into two subpointings each, we have merged the event files of the subpointings before continuing with the analysis.
2.1 Image mosaic
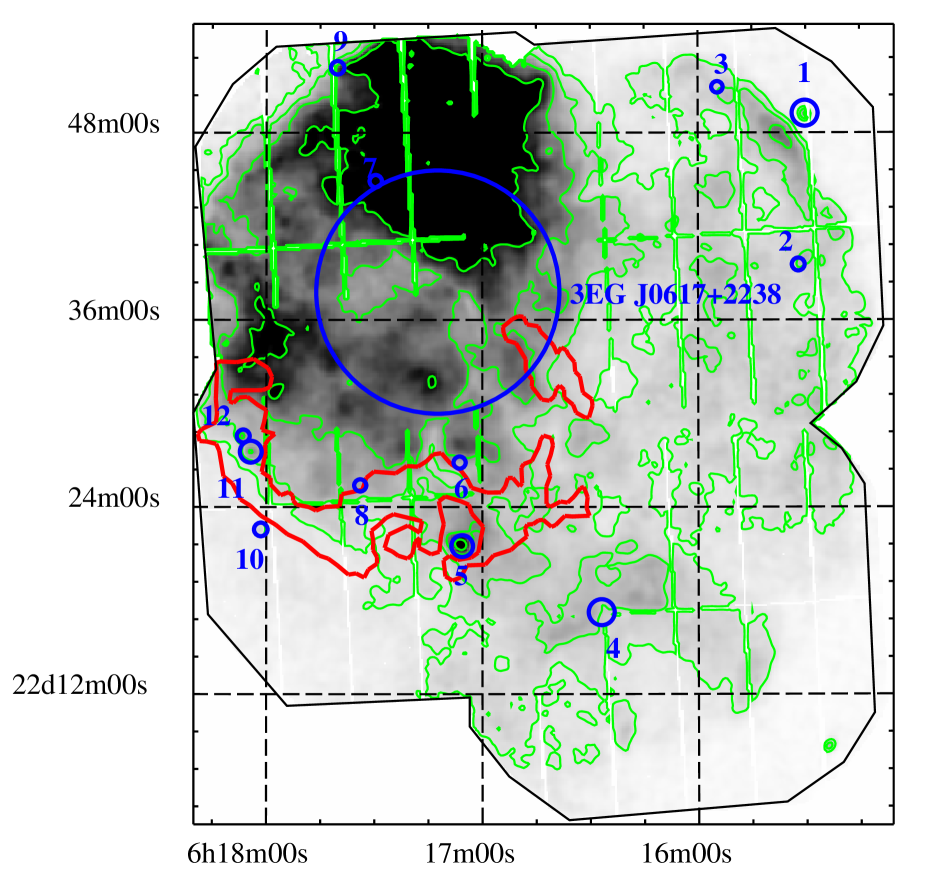
For each of the pointings listed in Table 1 we have extracted PN images with 8′′ pixel size and exposure images at the same resolution. We have defined two energy bands in which to extract images, namely 0.5–2 keV (hereafter soft band) and 3–10 keV (hard band). The images in each band (and the exposure maps) have been aligned using the reference pointings directions. The resultant count image has been divided by the exposure maps mosaic to correct for exposure and vignetting effect. Fig. 1 shows the 0.5–2 keV mosaic of the PN pointings. Most of the emission in this band is of thermal origin, as established by Asaoka & Aschenbach (1994) based on ROSAT data.
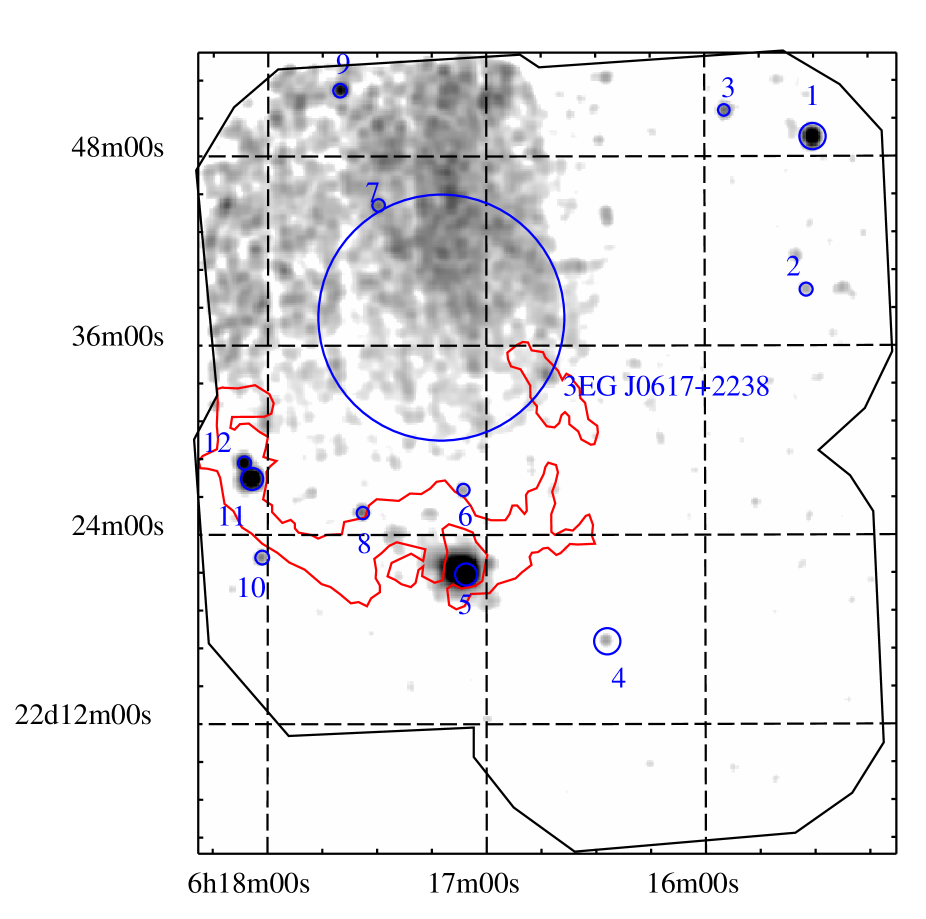
Fig. 2 reports the 3–10 keV PN mosaics of IC443. Most of the thermal emission associated to IC443 is not present in this band, and therefore this band is very well suited for the study of hard compact X-ray sources in the vicinity of this SNR.
2.2 Compact sources
2.2.1 Source detection
We have used the ewavelet SAS task (v2.4) to detect sources in the PN images. This task uses the mexican hat wavelet algorithm to detect both point and extended sources provided that the source extent is not too large (th the image size). A review of detection algorithms for XMM-Newton, including ewavelet is presented by Valtchanov et al. (2001), while further information about this task can be found in the SAS User’s Guide. Valtchanov et al. (2001) have tested ewavelet with simulations of both point-like and extended sources, finding that the algorithm performs very well for point-like sources, whereas it tends to miss more extended sources than other algorithms (e.g. emldetect). Since we are mostly interested in compact hard X-ray sources, we have discarded sources detected at large wavelet scales ( pixel), and therefore this limitation does not affect our results. A crucial parameter for source detection is the detection threshold; Valtchanov et al. (2001) show that ewavelet finds a number of false detections of 10% of the number of input sources in an observation of 10 ks with cosmic background, and using a threshold of . To further reduce the number of spurious detections, we have adopted a threshold of .
We have run the algorithm in the soft (0.5–2 keV) and hard (3–10 keV) energy band, using wavelet scales in the range 2–8 pixels. We have detected 88 sources in the soft band, and 12 in the 3–10 keV band. We therefore expect less than one spurious source in the hard band. The soft-band list is dominated by sources representing fluctuations in the thermal soft X-ray emission of this remnant. For this reason, we have reported in Table 2 only the 3–10 keV band detections along with their soft counterpart if any. Figs. 1 and 2 also show the positions of the detected sources.
Table 2 reports the source position, the wavelet correlation coefficients which are a measure of source detection significance, the wavelet scale of detection and the extension parameter, which is equivalent to a FWHM in the approximation of a Gaussian Point Spread Function. Simulations with point sources only have shown that this parameter is in 97% of the cases, and therefore indicates reliably if a source is point-like or not.
| N | RA | Dec | WCORR333The maximum correlation coefficient is a measure of source significance. | FWHM | cts s-1444The count rate is given in the 2–10 keV band for comparison with other published results. The flux was corrected for the PSF following the suggestion of Valtchanov et al. (2001). cnt s-1 is corresponding to adopting a power-law emission model with and interstellar absorption NH cm-2. | Texp | Note555“S” marks sources with a counterpart in the soft band. |
| J2000 | arcsec | sec | |||||
| 1 | 6 15 30.1 | 22 49 16.7 | 5.8 | 12.0 7.2 | 36.7 3.6 | 7107 | S |
| 2 | 6 15 32.1 | 22 39 33.0 | 0.7 | 11.9 2.8 | 6.3 1.3 | 9335 | |
| 3 | 6 15 54.6 | 22 50 55.6 | 1.3 | 11.3 1.8 | 5.7 1.2 | 9994 | |
| 4 | 6 16 27.1 | 22 17 18.2 | 1.5 | 10.5 1.4 | 2.8 0.6 | 20441 | |
| 5 | 6 17 05.5 | 22 21 29.7 | 11.0 | 20.5 1.2 | 65.8 4.4 | 16301 | S, Plerion |
| 6 | 6 17 06.3 | 22 26 51.1 | 0.5 | 12.5 3.8 | 4.8 0.9 | 18356 | |
| 7 | 6 17 29.6 | 22 44 53.9 | 0.7 | 11.0 2.6 | 7.0 1.5 | 9398 | S |
| 8 | 6 17 33.9 | 22 25 23.4 | 2.1 | 11.7 1.3 | 5.8 0.9 | 22860 | |
| 9 | 6 17 40.2 | 22 52 10.2 | 0.2 | 53.0 22.0 | 13.1 2.3 | 4430 | |
| 10 | 6 18 01.5 | 22 22 33.7 | 1.3 | 11.3 1.7 | 7.2 1.2 | 13382 | S |
| 11 | 6 18 04.3 | 22 27 32.8 | 2.9 | 20.6 2.2 | 24.7 3.2 | 12463 | S |
| 12 | 6 18 06.4 | 22 28 32.8 | 3.3 | 12.2 1.0 | 23.4 2.3 | 11471 | S |
2.2.2 Sources identification
In order to investigate the nature of the hard X-ray sources in IC443, we have carried out an extensive set of cross correlations with existing catalogues and digital data. In particular, we have used all the catalogues present in the W3Browse facility of Goddard Space Flight Center of NASA, and in the SIMBAD facility of the Centre de Donnèes astronomiques de Strasbourg. We have used a standard search radius of 2′ for all the catalogues except astrometric optical catalogues such as GSC, USNO and Tycho, were we have used 10′′. The list of identification is reported in Table 3.
| N | Source name | Name | Catalog | Offset | Remarks |
|---|---|---|---|---|---|
| arcsec | |||||
| 1 | XMMU J061530.1+224917 | U061530.75+224910.6 | USNO | 9 | B=18.8,R=15.8 |
| 2 | XMMU J061532.1+223933 | ||||
| 3 | XMMU J061554.6+225055 | 06128+2250 | IRASPSC | 84 | Jy |
| 4 | XMMU J061627.1+221718 | ||||
| 5 | XMMU J061705.5+222129 | U061705.98+222120.0 | USNO | 11 | B=16.7,R=15.9 |
| 1WGA J0617.1+2221 | WGACAT | 6 | |||
| H061706.08+222131.3 | ROSHRI | 6 | |||
| 1SAX J0617.1+2221 | Src A in Bocchino & Bykov (2000) | ||||
| 6 | XMMU J061706.3+222651 | ||||
| 7 | XMMU J061729.6+224453 | U061729.57+224452.8 | USNO | 1 | B=15.9,R=15.6 |
| 8 | XMMU J061733.9+222523 | TXS 0614+224 | TEXAS666The Texas Survey of Radio Sources at 365 MHz of Douglas et al. (1996). | 34 | PosErr |
| 9 | XMMU J061740.2+225210 | ||||
| 10 | XMMU J061801.5+222233 | H061801.60+222229.8 | ROSHRI | 4 | |
| RICH88 | DIXON777The Master List of Radio Sources (Version 43) of Dixon (1970). | 74 | |||
| 11 | XMMU J061804.3+222732 | 1SAX J0618.0+2227c | Src B in Bocchino & Bykov (2000) | ||
| 12 | XMMU J061806.4+222832 | 1SAX J0618.0+2227888The BeppoSAX source 1SAX J0618.0+2227 is resolved in two sources by our XMM-Newton observation. | Src B in Bocchino & Bykov (2000) |
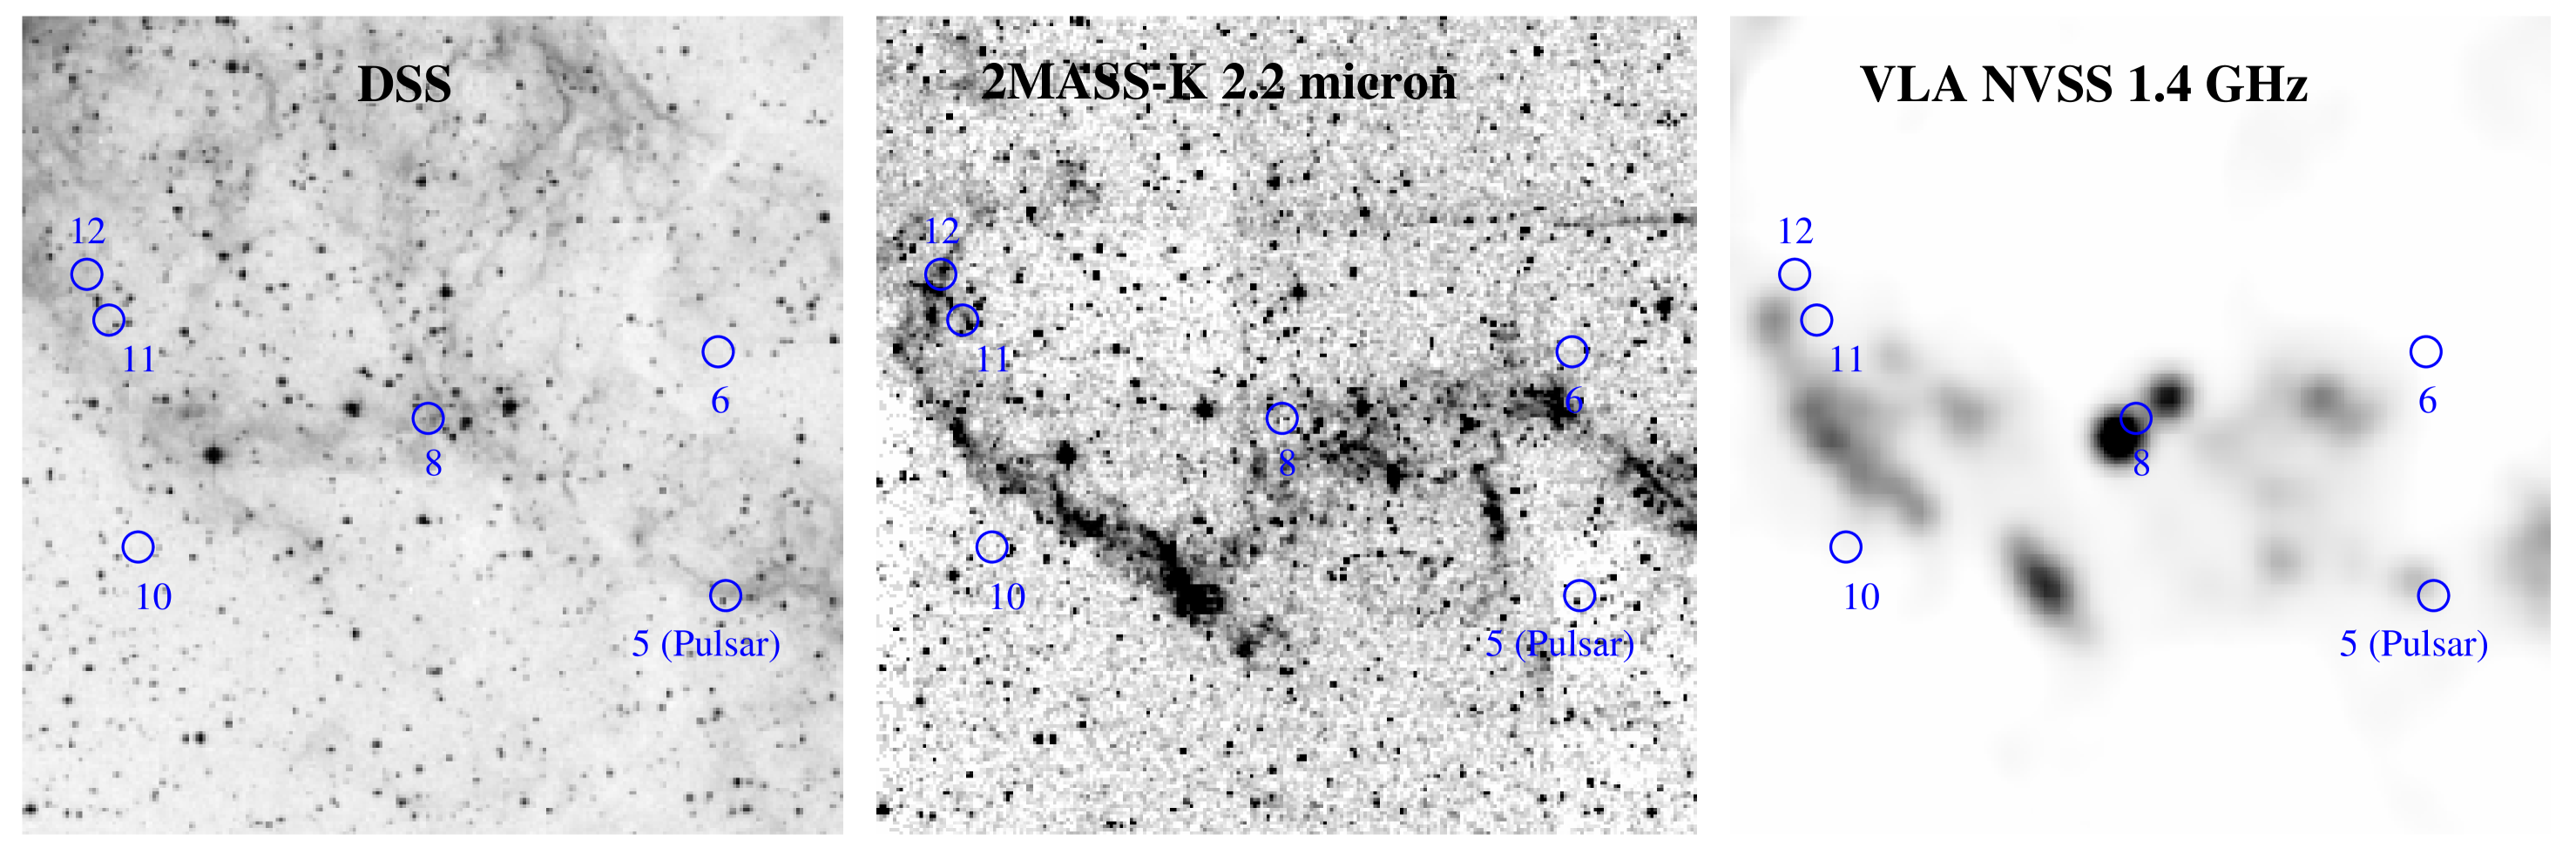
To verify if the hard X-ray sources are due to the interaction between IC443 and the molecular cloud which lies in foreground (Burton et al. 1988, Rho et al. 2001), as suggested by Bocchino & Bykov (2000), we have exploited the high spatial resolution of the PN data for a comparison with high-resolution optical and infrared data. We have used the Digital Sky Survey and the near-infrared data of the Two Micron All Sky Survey (2MASS, Cutri 1998), which has a resolution of . In particular, we have considered the Ks (2.32 ) band of 2MASS, for which most of the emission can be explained by molecular H2 rovibrational lines (Rho et al. 2001), a classical indicator of a shocked molecular cloud. Fig. 3 shows the correspondence between the infrared, optical and X-ray emission of the hard X-ray sources located in the region of interaction between the SNR and the molecular cloud.
2.2.3 Hardness ratios of detected sources
| Name | Si | Hi |
|---|---|---|
| HR1 | 0.2–0.5 | 0.5–2.0 |
| HR2 | 0.5–2.0 | 2.0–4.5 |
| HR3 | 2.0–4.5 | 4.5–10.0 |
In order to characterize the spectral properties of the detected source, we have computed three different and statistically independent hardness ratios (HRs) of the form
| (1) |
where the spectral bands are defined in Table 4. The definition is the same as adopted by Hasinger et al. (2001) to classify the sources detected in a deep XMM-Newton observation of the Lockman hole. The hardness ratios of the detected sources are displayed in Fig. 4, in which we have also reported, for comparison, the HRs of a sample of regions of the thermal shell (Th1 - Th4), and the four regions of the plerion nebula defined in Bocchino & Bykov (2001). The latter can be described by a pure non-thermal power law spectrum with a slope steepening toward the outer regions (i.e. going from the core to the “pl3” region, see Table 2 of Bocchino & Bykov 2001).
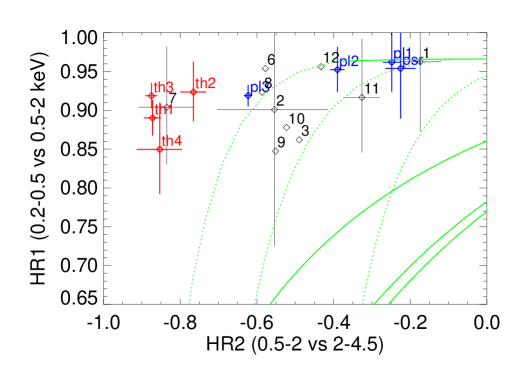
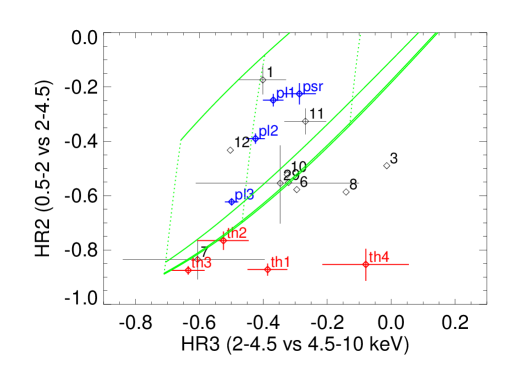
Most the sources, except source number 7, clearly have a non-thermal origin, and are located in a well-defined region of the diagram, near “pl3”, i.e. the most external plerion region which has a power-law spectrum with a photon index of . Source 1, 11 and 12 are located in a different group, near the regions “psr” and “pl1”, thus implying an intrinsically harder and/or more absorbed spectrum.
2.2.4 Spectral analysis of the sources
We have chosen to extract the spectra of the brightest sources which correlate with the infrared filaments, namely Src 10, Src 11 and 12 (Fig. 3). A background region outside the IC443 bright thermal emission has been identified. We have also identified the Th4 region at from Src 12 to be used as background region for the analysis of Src 11 and 12 which are surrounded by substantial thermal emission from the SNR. In all the cases the background regions have been corrected for vignetting and area effects prior to subtraction from source spectra, using the ancillary response files (arf) computed with the SAS task arfgen. As a final step, we have summed the spectra of MOS1 and MOS2, averaging the arf files, and we have used the response matrix of MOS1 for the analysis of the summed spectrum. The fittings have been performed on the PN and MOS-summed spectrum for each source.
Src 11 and 12 were confused into a single source in a BeppoSAX observation (Bocchino & Bykov 2000), but are clearly separated by XMM-Newton into one extended source (n. 11) plus a point-like source (n. 12, Fig. 3). Given the vicinity of these two sources to the diffuse thermal emission, we have analyzed their spectra using the Th4 region as background. We have extracted the spectra from a circle with radius of 16′′ and 24′′ for Src 12 and 11, respectively. We have applied the PSF correction to the effective area used in the fits of Src 12 spectrum only. The spectra of these two sources are shown in Fig. 5 together with their best-fit model, while the best-fit parameters and their uncertainties are reported in Table 5. A fit to a combination of thermal models (not reported) shows that the thermal nature of the spectra of these sources can be ruled out safely.
The spectrum of Src 10 is also non-thermal. In spite of the higher uncertainties associated with its best-fit parameters (this source is sensibly fainter than the Src 11 and 12, see Table 5), we can say this source is characterized by a spectrum of intermediate slope between Src 11 and 12, and a significantly lower absorption.


| Name | NH | flux999Absorbed power-law flux in the 0.5–10 keV band. | ||
|---|---|---|---|---|
| erg cm-2 s-1 | ||||
| Src10 | 14/17 | |||
| Src11 | 97/88 | |||
| Src12 | 64/67 |
3 Discussion
The XMM-Newton observations of IC443 presented above have unprecedented sensitivity in 2–10 keV regime. The nature of the detected localized sources within the boundary of IC443 SNR should be a subject of a careful inspection because some of them could be extragalactic sources unrelated to the SNR. Using the sensitivity map of the detection run,we have computed the log(N)-log(S) relation in 2–10 keV band of our IC443 observations, and we have compared it with the same function computed for the set of 10 XMM Galactic Plane Survey (GPS) observations of Bocchino et al. (2002). The GPS log(N)-log(S) is systematically lower than the relation we have found in IC443 by a factor of 2 in the range cnt s-1, and even more for brighter sources, thus indicating a clear excess of bright sources in the IC443 field of view. It seems therefore likely that some of the detected sources are expected to be really related to the SNR on statistical grounds. We have therefore investigated the possible nature of compact X-ray sources inside IC443.
The hardness ratio distributions (Fig. 4) allow us to conclude that only Src 7 is most likely of galactic nature, probably an X-ray counterpart of an active star. As for the other sources, the HR diagram does not make it possible to tell if they are galactic or extragalactic. The results of the spectral analysis on some of the sources give us additional informations. In Fig. 6, we report the contour of confidence levels for the interstellar absorption and the power-law spectral index of Src 10, 11 and 12, along with some expected values for NH. We can conclude that Src 10 and 11 have the highest probability to be of galactic origin, while for Src 12 there is a large overlap between the allowed range of NH and values well above the total galactic NH toward this direction. However, we note that Asaoka & Aschenbach (1994) report a total absorption of cm-2 for regions inside the shells of IC443 and the overlapping G189.6+3.3 SNR, as the region we are considering here. We also note that, in addition to the absorption along the line of sight, there could be a considerable contribution to NH from the molecular cloud. For instance, Richter et al. (1995) have measured an extinction in the 2.2 band of in this region, which corresponds to a value of NH cm-2. Therefore, after all, there is no strong evidence even for Src 12 to be extragalactic.

Having established that there may be a relation between the sources and IC443, we now discuss a different scenario which may explain the association. There are three basic classes of compact hard X-ray sources related to the SNR. One of these, the existence of a pulsar wind nebula inside IC443, has already been discussed by Olbert et al. (2001) and Bocchino & Bykov (2001) for Src 5, and therefore we will not discuss it here.
3.1 Shocked molecular clump
Shocked molecular clumps could represent another class of compact hard sources. As was discussed earlier, IC443 is known to be interacting with a molecular cloud and the southern part of the remnant reveals a clumped and knotty structure of the IR molecular emission down to arcsecond scales (e.g. Richter et al. 1995). Recent ISO observations (Cesarsky et al. 1999) of the southern region are consistent with that expected from shocked molecular clump models. This is also shown by Fig. 3 which shows the optical, infrared, and radio images of the region in which the interaction with the cloud is occurring. In particular, the absence of bright optical filaments is due to the very low shock velocity and very high density confirmed by Richter et al. (1995), while the strong emission in the 2.2 image is primarily due to the 1-0 line of at 2.122 , another strong indicator of slow shock in molecular clouds. It is remarkable that 5 out of 11 (excluding the plerion) compact X-ray sources are located close to this infrared-filament network.
Modeling of nonthermal emission from an SNR interacting with a molecular cloud has been recently performed by Bykov et al. (2000). It has been shown that hard X-ray and -ray emission structure should consist of an extended shell-like feature related to a radiative shock, and localized sources corresponding to shocked molecular clumps. Bykov et al. (2000) predicted a hard spectrum with a photon index below 2.0. Because of the hard spectrum and heavy absorption, localized spots of a few arcmin size would be seen only in hard X-rays. The emission originates from shock-accelerated electrons of energy below 1 GeV. The predicted flux density is keV cm-2 s-1 keV-1 at 10 keV for a 30 shock in a clump of half parsec radius and density of 10. The predicted count rates are consistent with the observed rate of 1SAX J0618.0+2227 (Bocchino & Bykov 2000). Recent ASCA study of Cygni, a shell-type SNR interacting with a molecular cloud, revealed several clumps of hard X-ray emission dominating the SNR emission above 4 keV (Uchiyama et al. 2002). While somewhat brighter () and more extended, the clumps resemble the spectra and surface brightness of the source 1SAX J0618.0+2227 inside IC 443.
Therefore, 1SAX J0618.0+2227, located near bright spots of molecular hydrogen emission, could be a shocked molecular clump. However, with the XMM-Newton PN camera the source 1SAX J0618.0+2227 is resolved into two different sources, Src 11 and 12 (Fig. 2). Src 12 apparently has a soft spectrum and a size of 12′′ FWHM, which makes the clump interpretation unlikely. The Src 11 has a hard spectrum, but still only a size of 20′′ FWHM ( cm at 1.5 kpc). The shocked molecular clump interpretation of Src 11 would require a substantially higher shock velocity in the clump than 30 to match the observed flux. The energetic requirements are rather stringent for such a small scale shock.
3.2 Fast-moving isolated ejecta fragments
The third class of possible compact hard X-ray sources related to the SNR are the isolated ejecta fragments. Multiwavelength studies of the structure of supernova remnants have revealed the presence of fine-scale structure with rich emission spectra. There are metal-rich fragments of SN ejecta interacting with surrounding media as well as circumstellar mass-loss matter. Some X-ray knots, e.g. the silicon-rich shrapnel, were observed in the Vela SNR by Aschenbach et al. (1995) and Miyata et al. (2001) and also in the Tycho SNR with XMM-Newton by Decourchelle et al. (2001). Supersonic motion of the knots in the ambient medium will result in a bow shock/knot-shock structure creation. It was shown that an individual knot propagating through a molecular cloud would be observable with XMM-Newton and Chandra from a few kpc distance (Bykov 2002). Such a know would have a hard X-ray spectrum of photon index in 1–10 keV regime, with prominent lines of some metals e.g. Si, S, Ar, Ca, Fe etc.
In order to verify the knot hypothesis for Src 11 and Src 12, we investigated the presence of emission lines in the X-ray spectrum. We added a gaussian line of variable width in the range 0–200 eV to the power-law model and we fitted the spectra, thus deriving the contour levels for the line centroid and flux shown in Fig. 7. We did not detect any emission lines at the 99% confidence level, even though there is excess flux at 1.8 keV, 3.4–3.6 keV and 5.1 keV only for Src 11. Fig. 7 reports the upper-limit to the line flux at different centroid energies. We have verified that the excess flux cannot be explained by known background emission lines.

We applied the supersonic knot model of Bykov (2002) to Src 11. X-ray line emission was simulated from a metal rich ejecta fragment of cm radius ( at 1.5 kpc) and a mass of interacting with a molecular cloud. The simulated fragment mass was dominated by oxygen with a minor mass contribution () of other SN nucleosynthesis products like Si, S, Ar, Ca, Fe. The knot travels through an inter-clump medium of number density at a velocity of . Under these conditions, the model yields a 1.8 keV Si line flux of ph cm-2 s-1 (if the electron diffusion coefficient is cm2 s-1), to be compared with our upper-limit of ph cm-2 s-1. The optical depth of the 1.8 keV Si line (Si VI and higher ionization states) is in that case, implying a saturation effect, i.e. increasing the Si mass would not increase the observed flux, if the knot radius is the same. The depth is somewhat lower for heavier elements where the saturation becomes improtant only above . A higher knot velocity (or lower diffusion coefficients) would produce higher Si line fluxes, as so would a bigger knot. However, the apparent size of Src 11 would point against knots having sizes sensibly different from those used in our simulation. The knot position, given the SNR age above 10 kyr, is constraining the knot velocity. Thus the electron diffusion coefficient is the most important parameter, which may be varied to match more accurate measurement of the 1.8 Si emission line flux.
We note that the lifetime of the ejecta fragment in the inter-clump medium is rather short, being below 100 yr. This implies that the fragment should spent most of its time in a tenuous gas of density of the SNR interior to survive during the lifetime of IC443, which is expected to be about 30,000 yr (e.g. Chevalier 1999). Indeed, the Src 11 is located just on the border of the molecular cloud, which suggests that the interaction with denser material has just started. Note that the [Ar III] bright knots of velocities (but with a somewhat smaller size) observed in the Crab nebula with HST by Schaller & Fesen (2002) could represent a similar phenomenon
The definite test to distinguish between the two interpretations, namely a fast moving metal-rich knot or a shocked clump, would be an X-ray spectral lines study because the shocked molecular clump emission would be dominated by a hard continuum in contrast to the metal-rich knot case. High-quality line spectra of the Src 11 would allow the X-ray study of SN nucleosynthesis.
4 Summary and conclusions
We have detected 12 compact hard X-ray sources in the field of the large SNR IC443, more than the expected number of galactic and extragalactic sources in this field, thus suggesting an association with the SNR for some of them. We have carried out a spectral analysis of the sources, by fitting the X-ray spectra of the brightest ones, and by computing X-ray hardness ratios. We have found that all sources but one have a clearly non-thermal spectrum. We have noted that 6 (including the plerion) out of 12 sources are concentrated in a small () area of the SNR, which was previously known to be a region of interaction between the SNR shock and a molecular cloud. We suggest that some of the sources may indeed be related to the SNR itself, and we review the possible formation mechanisms of formation of isolated hard X-ray sources in SNR shell. We have considered both electron acceleration in molecular clump shocks, and the emission from ejecta fragment as an alternative model. The latter is suggested by a modest evidence of a Si line in the spectrum of one of the sources. A deeper X-ray spectroscopy observation of the sources in IC443 and more X-ray observations of other SNRs interacting with molecular clouds are urgently needed to shed more light on this intriguing new class of hard X-ray sources.
Acknowledgements.
F.B. acknowledges support from European Space Agency, Ministero dell’Università e della Ricerca Scientifica, and Agenzia Spaziale Italiana. The work of A.M.B was supported by INTAS-ESA 99-1627 grant.References
- Asaoka & Aschenbach (1994) Asaoka, I. & Aschenbach, B. 1994, A&A, 284, 573
- Aschenbach et al. (1995) Aschenbach, B., Egger, R., & Trumper, J. 1995, Nature, 373, 587
- Bocchino & Bykov (2000) Bocchino, F. & Bykov, A. M. 2000, A&A, 362, L29
- Bocchino & Bykov (2001) —. 2001, A&A, 376, 248
- Bocchino et al. (2002) Bocchino, F., Favata, F., Sciortino, S., et al. 2002, in Proceedings of the Symposium: “New Visions of the X-ray Universe in the XMM-Newton and Chandra Era”, F. Jansen et al. (eds.), in press
- Burton et al. (1988) Burton, M. G., Geballe, T. R., Brand, P. W. J. L., & Webster, A. S. 1988, MNRAS, 231, 617
- Burton et al. (1990) Burton, M. G., Hollenbach, D. J., Haas, M. R., & Erickson, E. F. 1990, ApJ, 355, 197
- Bykov (2002) Bykov, A. M. 2002, A&A, 390, 327
- Bykov et al. (2000) Bykov, A. M., Chevalier, R. A., Ellison, D. C., & Uvarov, Y. A. 2000, ApJ, 538, 203
- Cesarsky et al. (1999) Cesarsky, D., Cox, P., Pineau des Forêts, G., et al. 1999, A&A, 348, 945
- Chevalier (1999) Chevalier, R. A. 1999, ApJ, 511, 798
- Cutri (1998) Cutri, R. M. 1998, in American Astronomical Society Meeting, 192, #64.02, Vol. 192, 6402
- Decourchelle et al. (2001) Decourchelle, A., Sauvageot, J. L., Audard, M., et al. 2001, A&A, 365, L218
- Dixon (1970) Dixon, R. S. 1970, ApJS, 20, 1
- Douglas et al. (1996) Douglas, J. N., Bash, F. N., Bozyan, F. A., Torrence, G. W., & Wolfe, C. 1996, AJ, 111, 1945
- Esposito et al. (1996) Esposito, J. A., Hunter, S. D., Kanbach, G., & Sreekumar, P. 1996, ApJ, 461, 820
- Hartman et al. (1999) Hartman, R. C., Bertsch, D. L., Bloom, S. D., et al. 1999, ApJS, 123, 79
- Hasinger et al. (2001) Hasinger, G., Altieri, B., Arnaud, M., et al. 2001, A&A, 365, L45
- Jansen et al. (2001) Jansen, F., Lumb, D., Altieri, B., et al. 2001, A&A, 365, L1
- Kawasaki et al. (2002) Kawasaki, M. T., Ozaki, M., Nagase, F., et al. 2002, ApJ, 572, 897
- Keohane et al. (1997) Keohane, J. W., Petre, R., Gotthelf, E. V., Ozaki, M., & Koyama, K. 1997, ApJ, 484, 350
- Miyata et al. (2001) Miyata, E., Tsunemi, H., Aschenbach, B., & Mori, K. 2001, ApJ, 559, L45
- Olbert et al. (2001) Olbert, C., Clearfield, R. C., Williams, N., Keohane, J., & Frail, D. A. 2001, ApJ, 554, L205
- Petre et al. (1988) Petre, R., Szymkowiak, A. E., Seward, F. D., & Willingale, R. 1988, ApJ, 335, 215
- Rho et al. (2001) Rho, J., Jarrett, T. H., Cutri, R. M., & Reach, W. T. 2001, ApJ, 547, 885
- Richter et al. (1995) Richter, M. J., Graham, J. R., & Wright, G. S. 1995, ApJ, 454, 277
- Schaller & Fesen (2002) Schaller, E. L. & Fesen, R. A. 2002, AJ, 123, 941
- Strüder et al. (2001) Strüder, L., Briel, U., Dennerl, K., et al. 2001, A&A, 365, L18
- Turner et al. (2001) Turner, M. J. L., Abbey, A., Arnaud, M., et al. 2001, A&A, 365, L27
- Uchiyama et al. (2002) Uchiyama, Y., Takahashi, T., Aharonian, F. A., & Mattox, J. R. 2002, ApJ, 571, 866
- Valtchanov et al. (2001) Valtchanov, I., Pierre, M., & Gastaud, R. 2001, A&A, 370, 689
- Wang et al. (1992) Wang, Z. R., Asaoka, I., Hayakawa, S., & Koyama, K. 1992, PASJ, 44, 303