A Survey of Quasars in the Sloan Digital Sky Survey II: Discovery of Three Additional Quasars at 11affiliation: Based on observations obtained with the Sloan Digital Sky Survey, and with the Apache Point Observatory 3.5-meter telescope, which is owned and operated by the Astrophysical Research Consortium; on observations obtained at the W.M. Keck Observatory, which is operated as a scientific partnership among the California Institute of Technology, the University of California and the National Aeronautics and Space Administration, made possible by the generous financial support of the W.M. Keck Foundation; on observations obtained with the Hobby-Eberly Telescope, which is a joint project of the University of Texas at Austin, the Pennsylvania State University, Stanford University, Ludwig-Maximillians-Universität München, and Georg-August-Universität Göttingen; and based on observations in the framework of the “Calar Alto Key Project for SDSS Follow-up Observations” (Grebel 2001) obtained at the German-Spanish Astronomical Centre, Calar Alto Observatory, operated by the Max Planck Institute for Astronomy, Heidelberg jointly with the Spanish National Commission for Astronomy.
Abstract
We present the discovery of three new quasars at in 1300 deg2 of SDSS imaging data, J114816.64+525150.3 (), J104845.05+463718.3 () and J163033.90+401209.6 (). The first two objects have weak Ly emission lines; their redshifts are determined from the positions of the Lyman break. They are only accurate to and could be affected by the presence of broad absorption line systems. The last object has a Ly strength more typical of lower redshift quasars. Based on a sample of six quasars at that cover 2870 deg2 presented in this paper and in Paper I, we estimate the comoving density of luminous quasars at and to be ( Mpc-3 (for , ). HST imaging of two quasars and high-resolution ground-based images (seeing ) of three additional quasars show that none of them is gravitationally lensed. The luminosity distribution of the high-redshfit quasar sample suggests the bright end slope of the quasar luminosity function at is shallower than (2-), consistent with the absence of strongly lensed objects.
1 Introduction
This paper is the second in a series presenting -dropout () quasars selected from the multicolor imaging data of the Sloan Digital Sky Survey (SDSS; York et al. (2000), Stoughton et al. (2002)). In Fan et al. (2000) and in Paper I (Fan et al. 2001c ), we presented the discovery of four quasars at , 5.82, 5.99 and 6.28, respectively, selected from deg2 of SDSS imaging data in the Northern Galactic Cap. The observations of these quasars provide important probes to the high-redshift universe. They indicate the existence of supermassive black holes with at when the universe was less than 1 Gyr old. The presence of strong metal emission lines in these quasars suggests strong chemical enrichment and strong star-forming activity in the quasar environment at early epoch. The thickening of the Ly forest, and the detection of a complete Gunn-Peterson trough in the quasar SDSS J1030+0524 (Becker et al. (2001), Pentericci et al. (2002)), indicate that the ionizing background is declining rapidly, and the intergalactic medium (IGM) neutral fraction is rising sharply at , suggesting that we might be close to the epoch of reionization at this redshift (e.g., Fan et al. (2002), Cen & McDonald (2002), Barkana (2002)).
In this paper, we describe the discovery of three quasars at , 6.23 and 6.43, selected from deg2 of new SDSS imaging data. The scientific objectives, photometric data reduction, target selection and follow-up observation procedures are described in detail in Paper I. The new observations used a slightly relaxed set of selection criteria, and are outlined briefly in §2. We present the spectroscopic observations of the three new quasars, and discuss their spectral properties in §3. In §4, we combine the new quasars with those presented in Paper I and recalculate the spatial density of luminous quasars, taking into account the effect of our color selection criteria. We also put constraints on the bright-end slope of the quasar luminosity function based on this quasar sample. At , the quasars presented in this paper and in Paper I are the most luminous objects at high redshift, and the probability of their being gravitationally lensed is boosted by the magnification bias (Turner, Ostriker, & Gott (1984), Wyithe & Loeb 2002a , Comerford, Haiman & Schaye (2002)). High-resolution images of these quasars are presented in §5 in order to uncover possible gravitational lensing. None of the objects appears to be lensed under image resolution from 0.1′′ (HST) to 0.8′′ (ground-based). We use this observation to set a limit on the magnification bias and thus to constrain the slope of the quasar luminosity function. In a subsequent paper (Fan et al. 2003), we discuss the absorption spectra of these quasars and their implication on the reionization epoch in greater detail.
As in Paper I, the results are presented using two different cosmologies: a -dominated universe with km s-1 Mpc-1, and (Ostriker & Steinhardt (1995)), which is referred to as the -model; and an Einstein-de Sitter universe with and = 50 km s-1 Mpc-1, which we refer to as the model in this paper.
2 Candidate Selection and Identification
The Sloan Digital Sky Survey is using a dedicated 2.5m telescope and a large format CCD camera (Gunn et al. (1998)) at the Apache Point Observatory in New Mexico to obtain images in five broad bands (, , , and , centered at 3551, 4686, 6166, 7480 and 8932 Å, respectively; Fukugita et al. (1996)) in 10000 deg2 of high Galactic latitude sky. About deg2 of imaging data have been collected at the time of this writing (November 2002). The imaging data are processed by the astrometric pipeline (Pier et al. (2002)) and photometric pipeline (Lupton et al. (2001)), and are photometrically calibrated to a standard star network (Smith et al. (2002), see also Hogg et al. (2001)).
At , the Ly emission line in the quasar spectrum moves out of the band and into the band, the reddest filter in the SDSS system. Quasars at higher redshift are characterized by their very red color. They are very faint or are completely undetected in the band due to the strong Ly forest absorption in that band, and become -dropout objects with only one measurable color (or its lower limit) in SDSS photometry. As discussed in detail in Paper I, because of the extreme rarity of very high-redshift quasars and the overwhelming number of possible contaminants, mostly cosmic rays in the band and very cool dwarfs (spectral types L and T), the photometric selection procedure of quasar candidates is quite complex. The procedures include further image processing to eliminate single-band cosmic rays; independent -band photometry to improve the signal-to-noise ratio (S/N) of the color; and -band photometry, either from matching with the Two Micron All Sky Survey (2MASS, Skrutskie et al. (1997)) catalog for bright sources, or independent -band measurement for fainter sources, in order to separate cool dwarfs from quasars, which have similar colors to those of quasars but much redder colors.
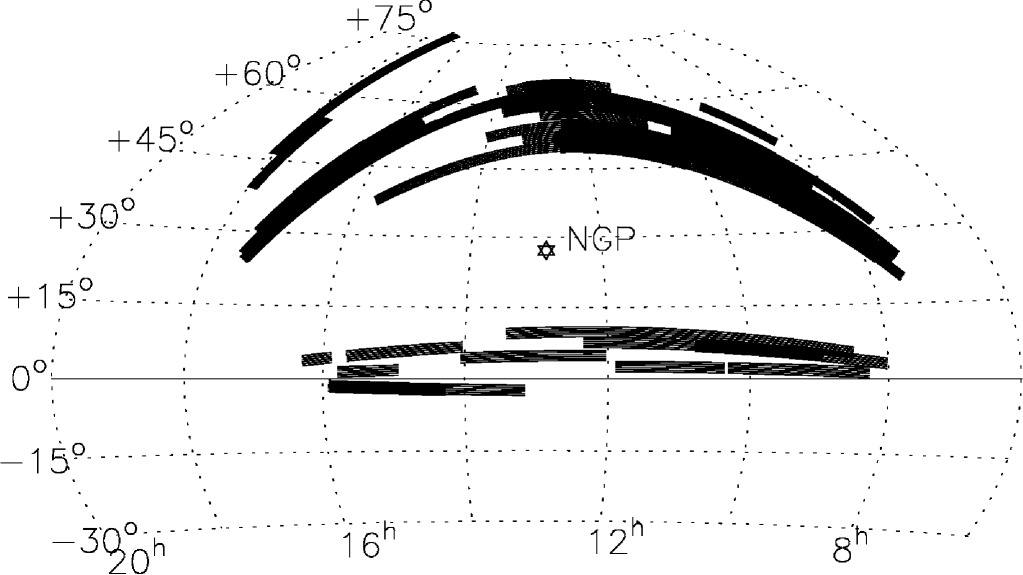
Paper I presents the results from a survey of -dropout candidates in deg2 of SDSS imaging carried out in the springs of 2000 and 2001. In Spring 2002, we searched for -dropout quasar candidates in 48 new SDSS imaging runs. These imaging data were taken between 27 April 2000 (Run 1411) and 2 April 2002 (Run 3103). We used the same criterion to decide which photometric runs to include in the -dropout survey as in Paper I: the band image quality, measured by the psfWidth parameter ( FWHM for a Gaussian profile) in the fourth column of the SDSS camera, should be better than 1.8′′. The median seeing in the and bands is for the entire survey area. The projection of the area covered by these runs is illustrated in Figure 1. This area overlaps with the area covered by Paper I, mostly in the overlap between adjacent SDSS strips and stripes (York et al. 2000). Taking these overlaps into account, we find that the total new area of the sky covered by these runs is 1320 deg2, bringing the combined sky coverage of Paper I and this paper to 2870 deg2.
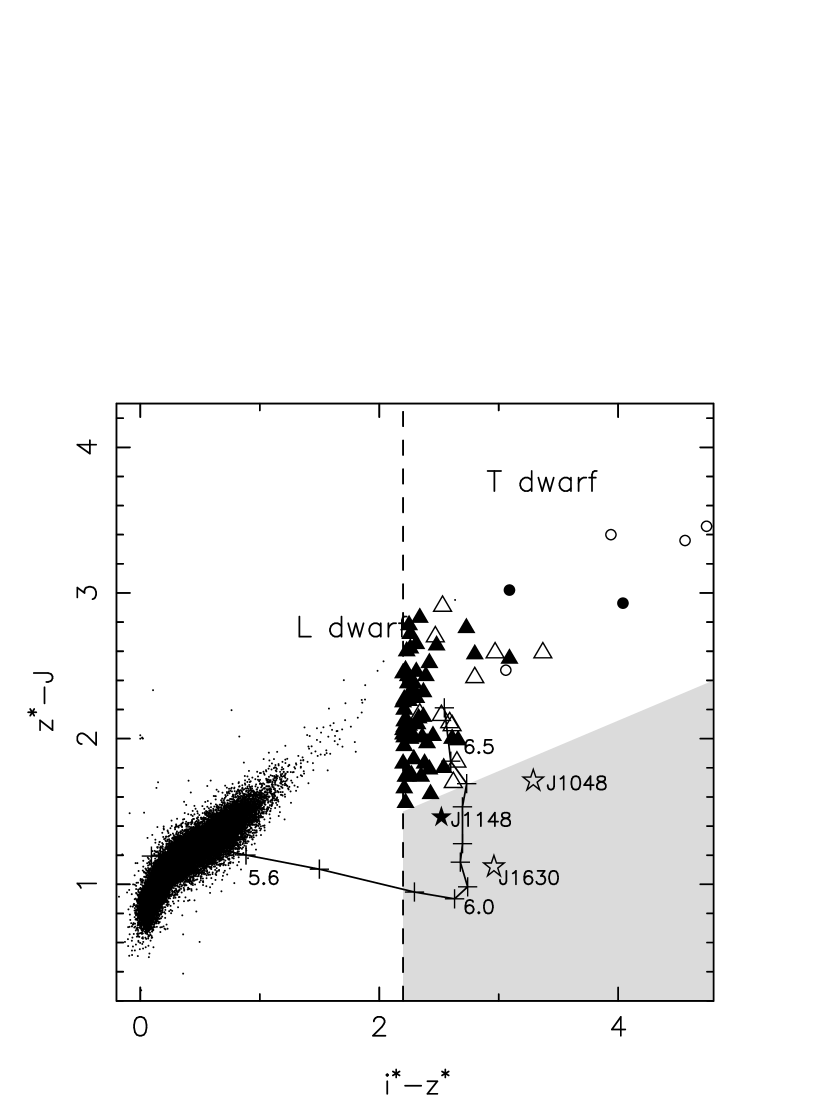
Figures 2 and 3 present the vs. color-magnitude diagram 111Following Stoughton et al. (2002), we refer to the SDSS passbands as , , , and . As the SDSS photometric calibration system is still being finalized, the SDSS photometry presented here is referred to as , , , and . and the vs. color-color diagram that we use to select -dropout candidates and to separate high-redshift quasar candidates from cool dwarfs. For quasars at , a significant amount of -band flux is also absorbed by the Ly forest absorption, resulting in an increasingly red color towards higher redshift (Figure 3). So in this Paper, we extend the color to be redder than that in Paper I in order to search for quasars at higher redshift. The final color-selection criteria are:
| (1) |
As in Paper I, we require that the object not be detected in the , or bands. The photometric error in Eq. 1(b) refers to the error measured in the original SDSS imaging, not in the high S/N follow-up -band imaging. In Eq. 1(d), the magnitude is in the AB system while the magnitude is in the Vega-based system. We illustrate these color cuts in Figures 2 and 3.
A total of 98 -dropout candidates were selected in the survey area. The photometric and initial spectroscopic follow-up observations were carried out over a number of nights between 26 December 2001 and 1 June 2002 using the ARC 3.5m telescope at the Apache Point Observatory. Independent photometry was carried out using the Seaver Prototype Imaging camera (SPICAM) in the SDSS filter on the ARC 3.5m telescope. Independent photometry was carried out using the GRIM II instrument (the near infrared GRIsm spectrometer and IMager), also on the ARC 3.5m. The initial spectroscopic follow-up observations were obtained using the Double Imaging Spectrograph (DIS) on the ARC 3.5m. For the three new quasars, further spectroscopic observations were obtained using the Calar Alto 3.5m Telescope, the Hobby-Eberly Telescope and the Keck II telescope (see §3). Descriptions of the instrument properties and data reduction can be found in Paper I.
3 Discovery of Three New Quasars at
Table 1 summarizes the classifications of the -dropout sample. Among the 98 -dropout candidates, 20 are false band only detections which are most likely cosmic rays; 67 are M or L dwarfs (most of the M or L dwarfs are classified photometrically based on their red colors). Among them, 9 are likely T dwarfs (see Knapp et al. 2003 for the infrared observations of the new T dwarfs; several objects still lack proper infrared spectroscopy, so the T dwarf classification is still preliminary). Two of the candidates, SDSS J114845.05+463718.3 222The naming convention for SDSS sources is SDSS JHHMMSS.SSDDMMSS.S, and the positions are expressed in J2000.0 coordinates. The astrometry is accurate to better than in each coordinate. (SDSS J1148+4637 for brevity), and SDSS J104845.05+463718.3 (SDSS J1048+4637) are identified as quasars at and 6.23, respectively. These two objects are the only objects that satisfy the selection criteria (Eq. 1) when improved -band photometry is used. In addition, we observed a number of objects with fainter -band magnitudes () and larger photometric errors [] to test our ability to look for faint quasars using the SDSS photometry. Among these faint candidates, one quasar (SDSS J163033.90+401209.6, SDSS J1630+4012, ) and one new T dwarf were discovered. The survey at fainter magnitudes is not complete.
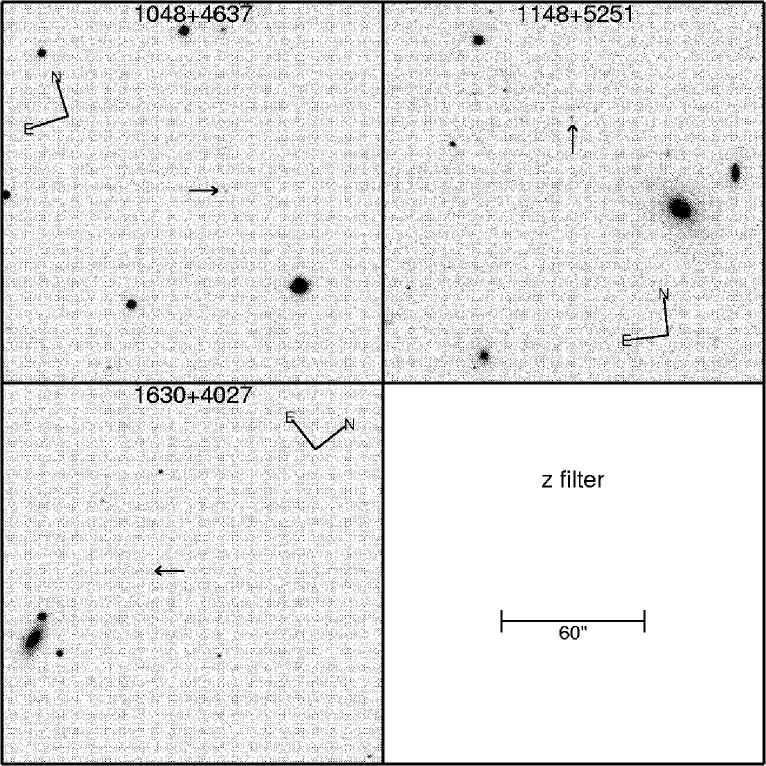
The finding charts and low resolution spectra of the three new quasars are presented in Figures 4 and 5. The spectra are flux-calibrated to match the observed band photometry. Table 2 presents the photometric properties of the new quasars, and Table 3 presents the measurements of their continuum properties. Following Paper I, the quantity is defined as the AB magnitude of the continuum at rest-frame 1280Å, after correcting for interstellar extinction using the map of Schlegel, Finkbeiner & Davis (1998). We extrapolate the continuum to rest-frame 1450Å, assuming a continuum shape to calculate .
3.1 Notes on Individual Objects
SDSS J114816.64+525150.2 (). This object is detected in two SDSS runs (Table 2) with consistent photometry. The discovery spectrum of SDSS J1148+4637 was obtained using DIS on the ARC 3.5m on 21 April 2002. The total exposure time was 3600 sec under partly cloudy skies. This initial spectrum shows a strong, broad emission Ly +NV emission line at Å and a clear Lyman break, indicating that it is at a redshift of , thus making it the highest redshift quasar yet discovered. Subsequently, we have obtained spectra with higher S/N using three telescopes: On 29 April 2002, a moderate resolution () spectrum was obtained with the Cassegrain Twin Spectrograph (TWIN) on the Calar Alto 3.5m telescope. The total exposure time was 3.5 hours under good sky conditions. The Calar Alto spectrum, which covers the spectral range of 8100Å to 9800Å, is shown in Figure 5. On 7 May 2002, a low resolution () spectrum was obtained with the Low Resolution Spectrograph (LRS, Hill et al. (1998)) on the Hobby-Eberly Telescope (HET) with a total exposure time of 5100 seconds. On 8 May and 10 May 2002, moderate resolution spectra () of SDSS J1148+5251 were obtained using the Echelle Spectrograph Imager (ESI, Epps & Miller (1998)) on the Keck II telescope. The sky was partly cloudy with variable extinction of mag. The total exposure time was 3 hours, although the S/N of the spectrum is worse than that in a 30 minute exposure on Keck of a similarly faint object under good conditions, due to the clouds. The final combined Keck spectrum (binned to 2Å/pixel) is presented in Figure 6.
While the presence of the Ly+NV emission line and Lyman break is unambiguous, the determination of an accurate redshift of this quasar is far from straightforward. The Ly+NV emission line is quite weak. The rest-frame equivalent width is Å, compared to the average value of Å for quasars at (Schneider, Schmidt, & Gunn 1991, Fan et al. 2001b ). The blue side of the Ly emission is almost totally absorbed by the Ly forest, and NV emission does not show a separate peak. No other emission line is detected with the current S/N. We adopt a redshift of using the peak of Ly emission and the onset of the Lyman break. This value is quite uncertain, and a more accurate redshift can only be determined using strong metal lines such as CIV, now redshifted well into the near infrared -band. Note, however, high-ionization lines such as CIV are systematically blueshifted from the system redshift, which is better traced by low-ionization lines such as MgII, by several hundred km s-1 (e.g., Richards et al. (2002)). This will bias the redshift determined from CIV line at the level at . We are able to identify an intervening CIV doublet absorption system at in both the Calar Alto and Keck spectra. This absorption system is discussed further in a subsequent paper (Fan et al. (2003)).
The fact that the Ly+NV emission line is very weak, while not unique among high-redshift quasars (Fan et al. (1999)), is intriguing (see also the discussion of SDSS J1048+4637 below). Clearly, a much larger sample is needed to study any trend in the evolution of the emission line strength among the highest redshift quasars. The other possible explanation for the weak line is that the Ly emission in SDSS J1148+5251 is affected by the presence of an intrinsic or associated NV absorption system, as in the case of SDSS J1044–0125 (Fan et al. 2000), a BAL quasar at (Brandt et al. (2001), Djorgovski et al. (2001), Goodrich et al. (2001), Maiolino et al. (2001)). In this case, the redshift determined by the peak of what is left of the Ly emission line can be overestimated by . A -band spectrum will be able to reveal the corresponding CIV absorption, if this were indeed the case.
At , and (-model, see Table 3), SDSS J1148+5251 is extremely luminous. Note that at this redshift, more than half of the flux in the -band is absorbed by the Ly forest. The continuum magnitude measured from the spectrum redward of Ly emission () is much brighter than the broad-band -band magnitude () which is affected by this absorption. If not gravitationally lensed (see §5), it is likely to be powered by a black hole of several billion solar masses, within a dark matter halo of order (see the discussion in Paper I). It is probably among the most luminous and massive objects in the universe at . Detailed studies of its spectral properties, such as its X-ray and sub-millimeter radiation, elemental abundances, and its environment, will provide us important insights to early galaxy and star formation.
SDSS J104845.05+463718.3 (). The discovery spectrum of SDSS J1048+4637 was obtained with DIS on the ARC 3.5m on 19 May 2002 with a total exposure time of 3600 sec under partly cloudy skies. Figure 5(b) shows a HET/LRS spectrum taken on 1 June 2002 with a total exposure time of 3600 second. This object also has a relatively weak Ly+NV emission line, with a rest-frame equivalent width of Å, compared to an average of Å at . Using the peak of the Ly+NV emission and the onset of the Lyman break, we estimate the redshift to be . Similar to the case of SDSS J1148+5251, this estimate is uncertain and could be biased due to the presence of strong NV absorption. We notice a possible absorption feature centered at 9750Å. It could be a SiIV BAL trough () if confirmed by high S/N observations. At and (the -model), this is also a very luminous object.
SDSS J163033.90+401209.6 (). The discovery spectrum of SDSS J1630+4012 was obtained using DIS on the ARC 3.5m on 2 June 2002 with a total exposure time of 1800 sec under partly cloudy skies, resulting in very low S/N. A higher S/N spectrum was obtained with HET/LRS on 3 July 2002 with an exposure time of 3400 sec, and is shown in Figure 5(c). Even with this moderate S/N and low resolution spectrum, strong Ly and NV emission lines are clearly visible and the two peaks are clearly separated. The total rest-frame equivalent width of the Ly+NV lines is Å, and the FWHM of the NV line is . Using the NV peak, we estimate the redshift of SDSS J1630+4012 to be . This object is the faintest quasar we have found so far at . Its -band magnitude is 20.4, 0.2 mag fainter than the flux limit of our complete survey. It is only an 8- detection in the SDSS -band, and is very close to its detection limit. It is encouraging that SDSS photometry still allows the detection and selection of quasars at this low S/N level. Studying quasars at lower luminosity requires deep imaging data such as those provided by the SDSS Southern Survey with multiple imaging (York et al. (2000)).
Due to its proximity on the sky to Abell 2199, Abell 2197, and the active galaxy EXO 1627.3+4014, SDSS J1630+4012 serendipitously lies in several pointed observations made with the ROSAT Position Sensitive Proportional Counter (PSPC). We have analyzed PSPC sequences rp701507 and rp800644 which provide the most sensitive coverage of SDSS J1630+4012. We do not find any highly significant detections in the standard ROSAT bands, although we note the presence of an source in the 0.5–2 keV band near SDSS J1630+4012 in rp701507; we shall conservatively set only an upper limit on the 0.5–2 keV flux. Applying the method of Kraft, Burrows, & Nousek (1991), our 95% confidence upper limit from rp701507 using a -radius aperture centered on SDSS J1630+4012 is 14.1 counts (the average effective exposure time in the aperture, accounting for vignetting, is 4440 s). We calculate an upper limit of erg cm-2 s-1 on the observed-frame, Galactic absorption-corrected, 0.5–2 keV flux (using a power-law model with a photon index of and the Galactic column density). Given the magnitude of SDSS J1630+4012, comparison with Figure 4 of Vignali et al. (2003) shows that the X-ray upper limit is consistent with X-ray observations of other quasars. SDSS J1630+4012 is not covered by the archival Chandra observations of Abell 2199, and we do not expect it to be covered by the 2002 (still proprietary) XMM-Newton observation either.
From Figures 5 and 6, it is evident that the flux levels are consistent with zero (for the S/N in each case) in the wavelength range immediately blueward of Ly emission in SDSS J1048+4637 () and SDSS J1148+5251 (). Figure 6 shows clear presence of a complete Gunn-Peterson (1965) trough from Å to Å in the spectrum of SDSS J1148+5251, similar to the one detected in SDSS J1030+0524 (Becker et al. 2001, Penterricci et al. 2002). While the S/N of the spectra is not as high for SDSS J1048+4637 and SDSS J1630+4012, the average flux at Å is also at least a factor of 50 lower than the continuum level redward of Ly emission. In a subsequent paper (Fan et al. 2003), we discuss in detail the Gunn-Peterson effect along the different lines of sight and its implication for the evolution of the ionizing background and the epoch of reionization.
4 Luminosity Function of Quasars
4.1 Spatial Density of Luminous Quasars at
In Paper I, we estimated the comoving density of quasars at using a sample of four quasars. We repeat this exercise here, adding the two additional quasars SDSS J1148+5251 and SDSS J1048+4637 which have . These six quasars form a complete sample satisfying the selection criteria in Eq. (1) over a total area of 2870 deg2. We do not use SDSS J1630+4012 as our follow-up observations at are not complete.
As in Paper I, we calculate the selection function of quasars using a Monte-Carlo simulation of quasar colors, taking into account the distribution of quasar emission line and continuum properties, the Ly absorption, the SDSS photometric errors and the Galactic extinction. The selection function as a function of redshift and absolute magnitude is illustrated in Figure 7 for the -model. At , the selection function changes somewhat from that in Figure 8 of Paper I: the relaxed color cut in the vs. color-color diagram results in a higher completeness at the highest redshift bins. Note that in principle the selection allows discovery of quasars at redshift as high as , but only with an extremely high luminosity of .
We derive the total spatial density of quasars at using the method:
| (2) |
where is the selection function and the integral extends over the redshift range . The total spatial density in the sample is estimated by:
| (3) |
Using the selection function in Figure 7, we find that at the average redshift of , Mpc-3 for the model, and Mpc-3 for the -model. The results are consistent with those in Paper I with smaller error bars. In Figure 8, we show the evolution of the spatial density of luminous quasars by combining the measurement here with the low redshift measurement from the 2dF survey (Boyle et al. (2000)) at , from Schmidt et al. (1995) at and from Fan et al. (2001a) at . The measurement at is consistent with the decline of quasar density observed at . The comoving density of luminous quasars at is 20 times smaller than that at .
4.2 Constraining the Slope of Quasar Luminosity Function
The shape of the quasar luminosity function at high redshift provides important constraints on the quasar contribution to the UV ionizing background (e.g. Madau, Haardt, & Rees (1999), Paper I) and on models of quasar formation and evolution (e.g. Haiman & Loeb 1998). Figure 7 shows that our color selection is sensitive to quasars with at (, for the -model). However, none of the six quasars in our complete sample has . How does this constrain the bright-end slope of the high-redshift quasar luminosity function?
We can calculate constraints on the bright-end luminosity function, assuming it is represented by a power-law: . In Paper I, we placed a loose limit of at the 2- level by looking at the luminosities of the two brighter vs. two fainter quasars in the original sample. Here we try to directly fit the luminosity distribution of the six quasars in the sample by a maximum likelihood estimate, following Marshall (1985) and Fan et al. (2001b). Given the limited redshift and luminosity range and the small number of objects in the sample, we do not attempt to fit the redshift evolution and assume the quasar luminosity function to be a single power law at the bright end:
| (4) |
The likelihood function can be written as:
| (5) |
For the model, we find (68% confidence level) and for the -model, . The best-fit bright-end slope is , with a 68% confidence range of [–1.6, –3.1] and a 95% confidence range of [–1.3, –3.5]. The slope of quasar luminosity function is consistent with that measured at (Fan et al. 2001b, ), and the best-fit value is shallower than the bright-end slope at from the 2dF survey, . A slope steeper than is excluded at the 2- level at based on these calculations.
The constraint presented here is still very tentative, due both to the small number statistics (the sample only contains six objects) and to the difficulty in estimating the selection function at a magnitude close to the photometric detection limit. The best-fit slope depends sensitively on the selection probability near the detection limit. We now attempt to constrain this slope independently using the magnification bias effect of gravitational lensing.
5 Gravitational Lensing of Quasars
The luminous quasars presented in this paper and in Paper I are likely to be in black holes with masses up to several billion solar masses. The presence of such massive black holes poses a challenge to models of structure formation and black hole formation at high redshift. It is therefore important to ask whether any or all of these quasars are magnified by gravitational lensing (Wyithe & Loeb 2002a , Comerford, Haiman & Schaye (2002)). At , these quasars are located at the bright end of the quasar luminosity function. Gott et al. (1984) first pointed out that in a fluxed-limited sample, the lensing probability of the brightest observed objects is boosted by magnification bias. Pei (1995) discussed the effect of magnification bias on a flux-limited sample of high-redshift quasars. In this section, we first present the HST and -band Keck imaging of our quasars to search for multiply-imaged quasars in our sample, and use the non-detection of lensed quasars to put a constraint on the amount of magnification bias and the slope of the quasar luminosity function at .
5.1 High-resolution Imaging of Quasars
In HST Cycle 11, we carry out a snapshot survey of SDSS quasars at to search for multiply-imaged quasars using the High Resolution Channel (HRC) of the Advanced Camera for Surveys (ACS) 333Based on observations made with the NASA/ESA Hubble Space Telescope, obtained at the Space Telescope Science Institute, which is operated by the Association of Universities for Research in Astronomy, Inc., under NASA contract NAS 5-26555. These observations are associated with proposal 9472.. Details of this snapshot survey are described in Richards et al. (2003). At the time of this writing (Nov 2002), two of the quasars, SDSS J0836+0054 () and SDSS J1030+0524 (), have been observed. The exposure time is 40 minutes for each quasar in the -band, resulting in a limiting magnitude of at 10- level. At the HST resolution (0.1′′), both quasars are consistent with being unresolved point sources.
The Keck -band image of SDSS J1044–0125 () is described in Fan et al. (2000). Keck images of the three other quasars, SDSS J1030+0524 (), SDSS J1048+4637 () and SDSS J1148+5251 (), were obtained in two runs in May and June 2002, using the Near Infrared Camera (NIRC) on the Keck I telescope. All observations were carried out under photometric skies and good seeing, with total exposure time of 900 second for each objects. The data were flattened, sky-subtracted, shifted, and stacked using the DIMSUM package in IRAF. The seeing of these observations is . The -band magnitudes for SDSS J1030+0524, SDSS J1048+4637, and SDSS J1148+5251, are 17.64, 16.99 and 16.91, respectively. The images show all quasars to be unresolved point sources. We also look for close companions, and none was found with within 10′′ from the quasars.
For the other two known quasars at , SDSS J1306+0356 () and SDSS J1630+4012 (), the best images we have are from the ARC 3.5m under seeing of . On these images, the quasar also appear to be an unresolved point sources. Note that SDSS J1630+4012 is more than 30′ away from the center of the two galaxy clusters Abell 2197 and Abell 2199 and is not likely to be lensed by them.
None of the quasars appear to be multiply-imaged under image resolution of . Note that in our -dropout object search, we do not exclude objects classified as extended sources. In fact, a few objects in our search was indeed classified as “galaxy” in SDSS processing, apparently due to low S/N in the band images. Therefore, our survey is not biased against lensed quasars.
Recently, Shioya et al. (2002) report the detection of a faint galaxy away from the quasar SDSS J1044–0125. Based on the presence of this galaxy and the non-detection of a second image under the current resolution, they conclude that SDSS J1044–0125 could be magnified by a factor of two, with a second image too faint to detect. This observation is consistent with the non-detection of the secondary image in our Keck imaging.
5.2 Constraint on the the Slope of Quasar Luminosity Function from the Magnification Bias
Wyithe & Loeb (2002a) and Comerford et al. (2002) calculate the lensing probability of SDSS quasars. They assume that the quasar luminosity function is a double power law:
| (6) |
where is the characteristic luminosity, and and are the faint-end and bright-end slope of the quasar luminosity function, respectively. Assuming and , Wyithe & Loeb (2002) found that the probability that a quasar in the flux-limited sample of Paper I is lensed could be as high as 30%. These papers discussed the dependence of the lensing probability on the assumed slopes, characteristic luminosity, and minimum image separation. Comerford et al. (2002) emphasized that the lensing probability is a strong function of this slope, and that it can approach 100% for a slope . Wyithe & Loeb (2002c) found a similar dependence on the quasar luminosity function. Either HST imaging or high-resolution ground-based imaging of a sample of luminous high-redshift quasars can be used to place a constraint on this slope.
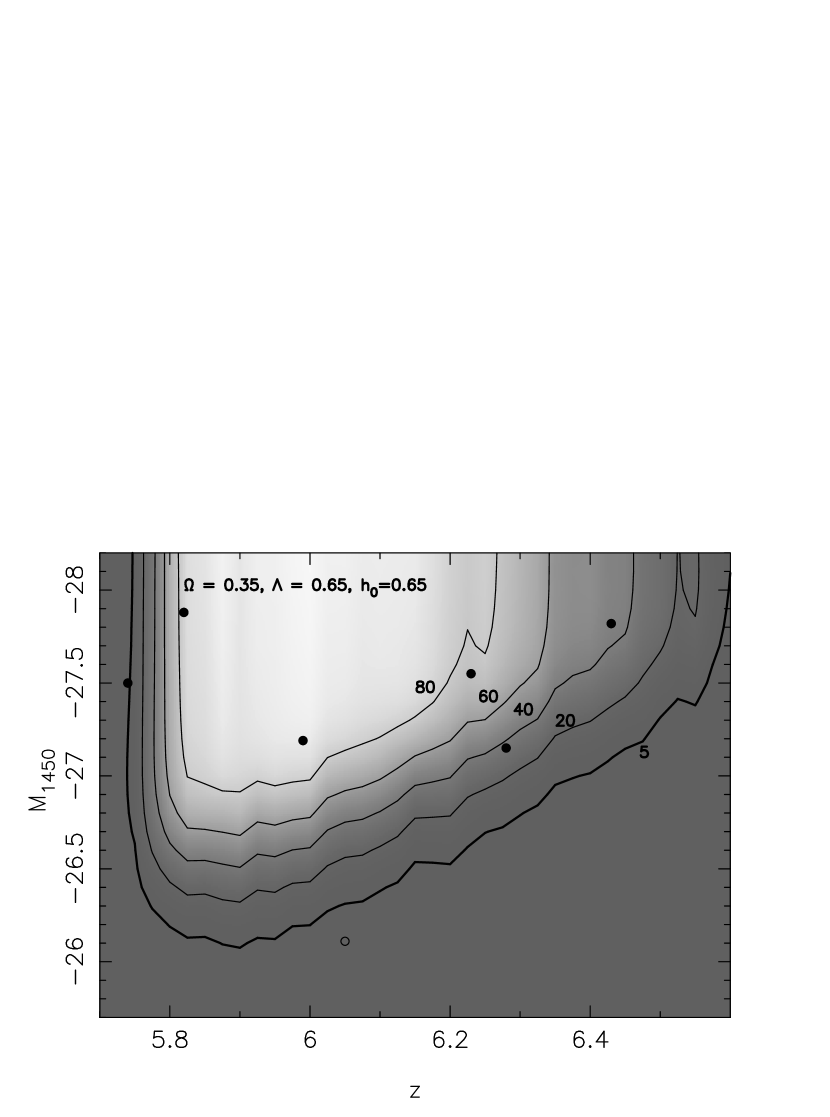
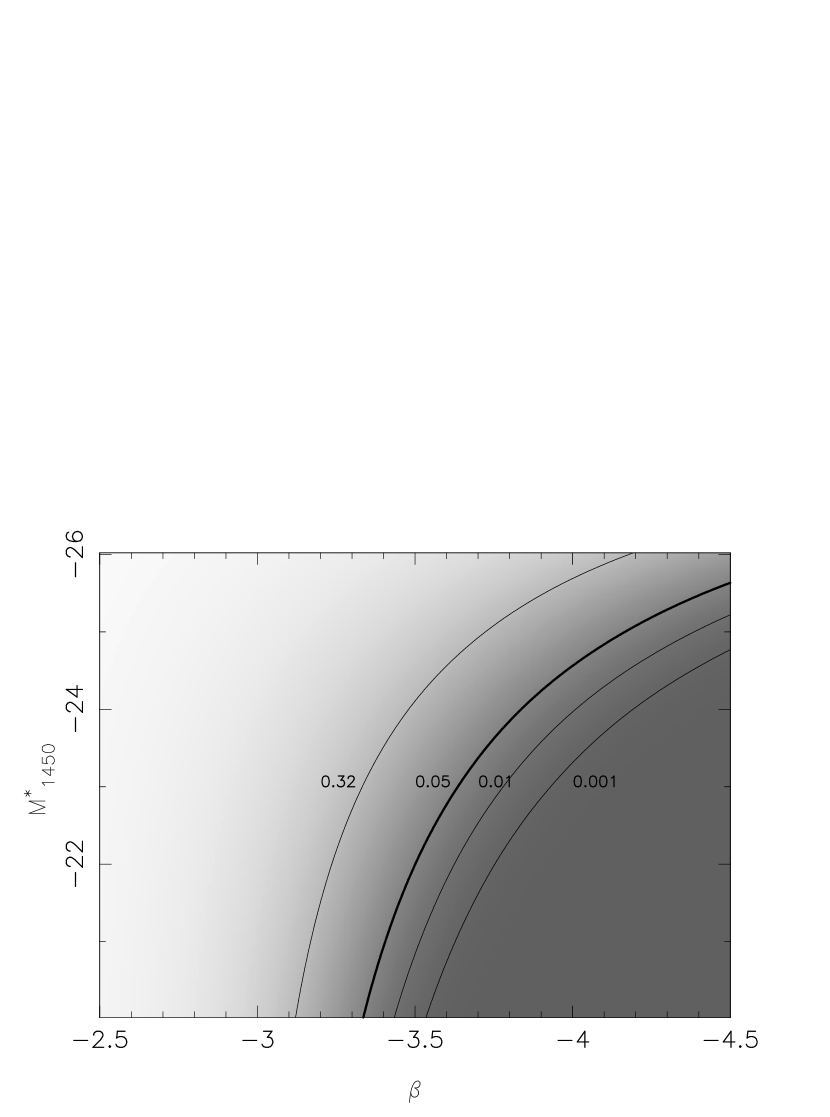
We carry out the calculations described in Comerford et al. (2002) to derive the probability of detecting a multiply-imaged quasar in the high-resolution imaging for each of the SDSS quasars. We assume that in order to detect a second image from lensing, the minimum image separation is 0.1, 0.5 and 0.8 for the HST, Keck and ARC observations, respectively. The minimum ratio of the primary and second images is assumed to be the ratio of the quasar and the 10- detection limit of the image. Figure 9 shows a contour plot of the probability that no lensed quasar is detected in high-resolution imaging as a function of the bright-end slope of quasar luminosity function and the characteristic absolute magnitude of the luminosity function (-model). The lines show the 0.32, 0.05, 0.01 and 0.001 probability contours. As discussed in Comerford et al. (2002) and in Wyithe & Loeb (2002b), the probability depends weakly on the faint-end slope. From Figure 9, the fact that no quasar was detected as lensed in the high-resolution images places a 2- limit on the bright-end slope of the quasar luminosity at at , depending on the characteristic luminosity assumed. This constraint is general agreement with the result from directly fitting the luminosity function (§4.2) where we found at 2- level. This calculation depends on a number of assumptions made in the lensing model, such as the population and density profiles of the lensing galaxy, although these dependences are weak. The constraints based on the luminosity distribution of our sample and on the absence of lensed quasars are completely independent. They both indicate that the bright-end slope of the quasar luminosity function is not very steep and are consistent with the shallow slope found in Fan et al. (2001c) for quasars.
The observation of Shioya et al. (2002) and the possibility of modest magnification of SDSS J1044–0125 can be used to put an additional constraint on the lensing probability and the shape of the quasar luminosity function. We calculate the expected a-posteriori probability of SDSS J1044–0125 being magnified by a factor of two or more, regardless of splitting angles, for different luminosity function shapes. For , this probability is 0.74, and it drops to 0.17 and 0.025 for and , respectively. These probabilities are consistent with the limit on we derived above. They show that even without detectable second image under high image resolution, the possibility that the luminous are modestly magnified by foreground galaxies is still quite high. Note that our calculations include all splitting angles between the two images and all brightnesses of the secondary image. By combining deep imaging of quasar environment such as Shioya et al. with HST high resolution imaging, we could put a stronger constraint on the shape of the quasar luminosity function. The complete modeling is beyond the scope of the current paper and will be addressed in detail in the analysis of our full HST sample.
Assuming that these luminous quasars are radiating at Eddington limit and they are magnified by gravitational lensing, if the relation between black hole mass and bulge mass observed at (Magorrian et al. 1998, Gebhardt et al. 2000, Ferrarese & Merritt 2000), these quasars are likely to reside in dark matter halos with , represent - peaks in the density field (Paper I) and are located on the tail of the mass function at early epochs. The comparison between the slope of the quasar luminosity function and mass function at will put strong constraints on models of quasar formation at early epochs. Models associating quasars with dark matter halos, such as the ones by Haiman & Loeb (1998), predict a steep halo mass function for these quasars ( between –5 and –6 for the mass function). Wyithe & Loeb (2002c) developed a semi-analytic model of quasar evolution using new observations of the relationship between black hole mass and host galaxy velocity dispersions; they were able to reproduce the shallow luminosity function slope at , but the predicted slope at is shallower than that observed in low-redshift quasars.
The shape of the quasar luminosity function is also crucial in understanding the contribution of the quasar population to the UV ionizing background at high redshift. In Paper I, we calculated the total emissivity per unit volume of ionizing photons from the quasar population and compared it with what is required to keep the universe ionized. Figure 10 of Paper I indicates that with and a range of assumptions about the characteristic luminosity and faint-end slope, quasars are not likely to produce enough photons to ionize the universe or to keep it ionized at , unless the luminosity function rises sharply at lower luminosities.
The current SDSS survey can only detect and select the most luminous quasars with . A deep quasar survey at is needed to understand the complete picture of high-redshift quasar evolution and its relation to the reionization history. The SDSS Southern Survey covers a 200 deg2 region about 1.5 – 2 mag deeper than the SDSS main sample. Assuming a quasar luminosity function of , and the density of quasars for is 6 objects per 3000 deg2, we expect to find 16 quasars at and in this 200 deg2. By comparison, we expect to find quasars at and in the 10,000 deg2 of main SDSS survey area.
Funding for the creation and distribution of the SDSS Archive has been provided by the Alfred P. Sloan Foundation, the Participating Institutions, the National Aeronautics and Space Administration, the National Science Foundation, the U.S. Department of Energy, the Japanese Monbukagakusho, and the Max Planck Society. The SDSS Web site is http://www.sdss.org/. The SDSS is managed by the Astrophysical Research Consortium (ARC) for the Participating Institutions. The Participating Institutions are The University of Chicago, Fermilab, the Institute for Advanced Study, the Japan Participation Group, The Johns Hopkins University, Los Alamos National Laboratory, the Max-Planck-Institute for Astronomy (MPIA), the Max-Planck-Institute for Astrophysics (MPA), New Mexico State University, University of Pittsburgh, Princeton University, the United States Naval Observatory, and the University of Washington. We thank the staff at APO, HET, Calar Alto and Keck for their expert help. We acknowledge support from NSF grant PHY 00-70928, a Frank and Peggy Taplin Fellowship and the University of Arizona (X.F.), NSF grant AST 00-71091 (M.A.S.) and NSF grant AST 99-00703 (D. P. S.).
References
- Barkana (2002) Barkana, R. 2002, New Astronomy, 7, 85
- Becker et al. (2001) Becker, R. H. et al. 2001, AJ, 122, 2850
- Boyle et al. (2000) Boyle, B.J., Shanks, T., Croom, S. M., Smith, R . J., Miller, L., Loaring, B., & Heymans, C. 2000, MNRAS, 317, 1014
- Brandt et al. (2001) Brandt, W.N., Guianazzi, M., Kaspi, S., Fan, X., Schneider, D.P., Strauss, M.A., Clavel, J., & Gunn, J.E. 2001, AJ, 121, 591
- Cen & McDonald (2002) Cen, R. & McDonald, P. 2002, ApJ, 570, 457
- Comerford, Haiman & Schaye (2002) Comerford, J., Haiman, Z., & Schaye, J. 2002, ApJ, in press (astro-ph/0206441)
- Djorgovski et al. (2001) Djorgovski, S. G., Castro, S., Stern, D., & Mahabal, A. A. 2001, ApJ, 560, L5
- Epps & Miller (1998) Epps, H.W., & Miller, J.S. 1998, Proc. SPIE, 3355, 48
- Fan et al. (1999) Fan, X. et al., 1999a, ApJ, 526, L57
- Fan et al. (2000) ——, 1999b, AJ, 120, 1167
- (11) ——, 2001a, AJ, 121, 31
- (12) ——, 2001b, AJ, 121, 54
- (13) ——, 2001c, AJ, 122, 2833
- Fan et al. (2002) ——, 2002, AJ, 123, 1247
- Fan et al. (2003) ——, 2003, AJ, to be submitted
- Ferrarese & Merritt (2000) Ferrarese, L., & Merritt, D. 2000, ApJ, 539, L9
- Fukugita et al. (1996) Fukugita, M., Ichikawa, T., Gunn, J.E., Doi, M., Shimasaku, K., & Schneider, D.P. 1996, AJ, 111, 1748
- Gebhardt et al. (2000) Gebhardt, K., et al. 2000, ApJ, 539, L13
- Goodrich et al. (2001) Goodrich, R. W. et al. 2001, ApJ, 561, L23
- Grebel (2001) Grebel, E. K. 2001, Reviews in Modern Astronomy 14, 223
- Gunn & Peterson (1965) Gunn, J. E., & Peterson, B. A. 1965, ApJ, 142, 1633
- Gunn et al. (1998) Gunn, J.E., et al. 1998, AJ, 116, 3040
- Haiman & Loeb (1998) Haiman, Z., & Loeb, A. 1998, ApJ, 503, 505
- Hill et al. (1998) Hill, G. J., et al. 1998, Proc. SPIE, 3355, 433
- Hogg et al. (2001) Hogg, D., et al. 2001, AJ, 122, 2129
- Knapp et al. (2003) Knapp, G. R. et al. 2003, in preparation
- Kraft, Burrows, & Nousek (1991) Kraft, R.P., Burrows, D.N., & Nousek, J.A. 1991, ApJ, 374, 344
- Lupton, Gunn & Szalay (1999) Lupton, R.H., Gunn, J.E., & Szalay, A. 1999, AJ, 118, 1406
- Lupton et al. (2001) Lupton, R. H., Gunn, J. E., Ivezic, Z., Knapp, G. R., Kent, S. M., & Yasuda, N., 2001, ASP Conf. Ser. 238: Astronomical Data Analysis Software and Systems X, 10, 269
- Madau, Haardt, & Rees (1999) Madau, P., Haardt, F., & Rees, M. J., 1999, ApJ, 514, 648
- Magorrian et al. (1998) Magorrian, J. et al. 1998, AJ, 115, 2285
- Maiolino et al. (2001) Maiolino, R., Mannucci, F., Baffa, C., Gennari, S., & Oliva, E. 2001, A&A 372, L5
- Marshall (1985) Marshall, H. L. 1985, ApJ, 299, 109
- Ostriker & Steinhardt (1995) Ostriker, J. P., & Steinhardt, P. 1995, Nature, 377, 600
- Pei (1995) Pei, Y. C. 1995, ApJ, 440, 485
- Pentericci et al. (2002) Pentericci, L., et al. 2002, AJ, 123, 2151
- Pier et al. (2002) Pier, J. et al. 2002, AJ, in press (astro-ph/0211375)
- Richards et al. (2002) Richards, G. T., Vanden Berk, D. E., Reichard, T. A., Hall, P. B., Schneider, D. P., SubbaRao, M., Thakar, A. R., & York, D. G. 2002, AJ, 124, 1
- Richards et al. (2003) Richards, G. T., et al. 2003, in preparation
- Schlegel, Finkbeiner & Davis (1998) Schlegel, D.J, Finkbeiner, D.P., & Davis, M. 1998, ApJ, 500, 525
- Schmidt et al. (1995) Schmidt, M., Schneider, D. P., & Gunn, J.E., 1995, AJ, 110, 68 (SSG)
- Shioya et al. (2002) Shioya, Y., et al. 2002, PASJ, in press (astro-ph/0211388)
- Skrutskie et al. (1997) Skrutskie, M. F., et al., 1997, The Impact of Large-Scale Near-IR Sky Surveys, ed. F. Garzón, N. Epchtein, A. Omont, B,. Burton, & P. Persei (Dordrecht: Kluwer), 25
- Smith et al. (2002) Smith, J., et al. 2002, AJ, 123, 2121
- Stoughton et al. (2002) Stoughton, C. et al. 2002, AJ, 123, 485
- Turner, Ostriker, & Gott (1984) Turner, E. L., Ostriker, J. P., & Gott, R. 1984, ApJ, 284, 1
- Vignali et al. (2003) Vignali, C., Brandt, W.N., Schneider, D.P., Garmire, G.P., & Kaspi, S. 2003, ApJ, in press (astro-ph/0210475)
- (48) Wyithe, J. S. B., & Loeb, A., 2002a, Nature, 417, 923
- Wyithe & Loeb (2002c) Wyithe, J. S. B., & Loeb, A., ApJ, 577, 57
- Wyithe & Loeb (2002b) Wyithe, J. S. B., & Loeb, A., ApJ, submitted (astro-ph/0206154)
- York et al. (2000) York, D. G., et al. 2000, AJ, 120, 1579
| number of objects | percentage | |
|---|---|---|
| quasars | 2 | 2.0% |
| T dwarfs | 9 | 9.2% |
| M/L dwarfs | 67 | 68.4% |
| false detections | 20 | 20.4% |
| TOTAL | 98 | 100% |
| object | redshift | SDSS run | |||
|---|---|---|---|---|---|
| J104845.05+463718.3 | 6.23 0.05 | 22.38 0.19 | 19.86 0.09 | 18.40 0.05 | 2964 |
| J114816.64+525150.2 | 6.43 0.05 | 23.30 0.30 | 20.01 0.09 | 18.25 0.05 | 2883 |
| 23.86 0.77 | 20.12 0.09 | 18.25 0.05 | 2830 | ||
| J163033.90+401209.6 | 6.05 0.03 | 23.38 0.35 | 20.42 0.12 | 19.38 0.10 | 2328 |
| object | redshift | |||||
|---|---|---|---|---|---|---|
| (-model) | (-model) | (Galactic) | ||||
| J104845.05+463718.3 | 6.23 | 19.32 | 19.25 | –27.28 | –27.55 | 0.018 |
| J114816.64+525150.2 | 6.43 | 19.10 | 19.03 | –27.55 | –27.82 | 0.023 |
| J163033.90+401209.6 | 6.05 | 20.71 | 20.64 | –25.85 | –26.11 | 0.011 |