-Ray Lines From Asymmetric Supernovae
Abstract
We present 3-dimensional SPH simulations of supernova explosions from 100 seconds to 1 year after core-bounce. By extending our modelling efforts to a 3-dimensional hydrodynamics treatment, we are able to investigate the effects of explosion asymmetries on mixing and -ray line emergence in supernovae. A series of initial explosion conditions are implemented, including jet-like and equatorial asymmetries of varying degree. For comparison, symmetric explosion models are also calculated. A series of time slices from the explosion evolution are further analyzed using a 3-dimensional Monte Carlo -ray transport code. The emergent hard X- and -ray spectra are calculated as a function of both viewing angle and time, including trends in the -ray line profiles. We find significant differences in the velocity distribution of radioactive nickel between the symmetric and asymmetric explosion models. The effects of this spatial distribution change are reflected in the overall high energy spectrum, as well as in the individual -ray line profiles.
1 Introduction
Among the many surprises that supernova (SN) 1987A brought astronomers was the early emission of X-rays and -rays (X-rays: e.g. Dotani et al. 1987; Sunyaev et al. 1987; -rays: e.g. Cook et al. 1988; Mahoney et al. 1988; Matz et al. 1988). This high energy emission, arising from the decay of 56Co, appeared nearly 6 months earlier than was predicted by theoretical models (e.g. Pinto & Woosley 1988a, Arnett et al. 1989) and led theorists to conclude that the 56Ni, produced deep in the core of this exploding star, had mixed into the outer layers of the supernova ejecta (e.g. Pinto & Woosley 1988b, Arnett et al. 1989 and references therein). Additional evidence all seems to support the mixing of SN 1987A’s ejecta: models of the supernova light curves (Arnett 1988; Shigeyama, Nomoto, & Hashimoto 1988; Woosley 1988; Shigeyama & Nomoto 1990) and explanations of spectral line widths (Haas et al. 1990; Spyromilio, Meikle, & Allen 1990; Tueller et al. 1990). SN 1987A is not peculiar in this mixing. Many supernovae show evidence of mixing in their spectra (e.g. Spyromilio 1994, Fassia et al. 1998) and the light curves and spectra of Type Ib SN seem to be best fit by mixed models (Shigeyama et al. 1990; Woosley & Eastman 1997). It appears that mixing is a generic process in core-collapse supernovae.
These results have stimulated a series of multi-dimensional hydrodynamical simulations trying to produce the observed mixing (Arnett, Fryxell, & Müller 1989; Hachisu et al. 1990, Fryxell, Arnett & Müller 1991; Müller, Fryxell & Arnett 1991; Herant & Benz 1991; Herant & Benz 1992; Herant & Woosley 1994; Kifonidis et al. 2000; Kifonidis et al. 2003). Although these simulations seem to be able to explain the mixing in Type Ib supernovae (Kifonidis et al. 2000), none of these results are able to explain the extensive mixing observed in SN 1987A. Possible solutions to this shortcoming have been proposed: (1) perhaps the decay of 56Ni injects enough energy to force additional mixing (Herant & Benz 1992) or (2) convection in the pre-collapse core provides enough seeds to enhance mixing (Herant & Benz 1992). A third possibility is that the supernova explosion itself is asymmetric (Nagataki et al. 1997; Nagataki et al. 1998; Nagataki 2000 and references therein). Nagataki et al. (1998) found that not only could slight asymmetries in the supernova explosion produce the required mixing to explain 1987A, but they could also explain anomalies in the nucleosynthetic yields produced by several supernovae.
The evidence for such global asymmetries in supernova explosions has been growing steadily. One piece of evidence arises from attempts to understand the high space velocities of neutron stars. The high observed velocities of pulsars, along with evidence of neutron star/remnant associations, and the formation scenarios of neutron star binaries all suggest that neutron stars are given strong kicks at birth. These kicks are most easily explained by some asymmetry in the supernova explosion (see Fryer, Burrows, & Benz 1996 for a review). In addition, the most straightforward explanation of the large polarization seen in core-collapse supernovae (see Wang et al. 2001; Leonard & Filippenko 2001 and references therein) is that the explosion driving these supernovae is inherently asymmetric (Höflich 1991).
The asymmetries are believed to have their origin in the explosion mechanism itself. For instance, even if the collapsing star is initially spherically symmetric, some asymmetry can be produced due to convection taking place in, and above, the proto-neutron star (Herant et al. 1994; Burrows, Hayes, & Fryxell 1995; Janka & Müller 1996). To date, these asymmetries are not extreme enough in the theoretical models to explain the mixing. Large asymmetries may occur if the collapsing star is asymmetric due to nuclear burning (Burrows & Hayes 1996; Lai 2000), however, sufficiently large departures from spherical symmetry have only been produced by assuming extremely asymmetric collapsing cores (Burrows & Hayes 1996). Alternatively, rotation can produce strong asymmetries in the supernova explosion (Mönchmeyer & Müller 1989; Janka & Mönchmeyer 1989; Fryer & Heger 2000, Khokhlov et al. 1999). The nature of these asymmetries depends upon the angular momentum profile of the collapsing star and, although most calculations predict jet-like explosions along the rotation axis, some calculations imply that an equatorial explosion could occur (Mönchmeyer & Müller 1989).
In this paper, we follow supernova explosions in 3-dimensions from 100 seconds to 1 year after core-bounce. We model a series of initial explosion conditions with both jet-like “axial” and equatorial asymmetries of varying degree. In §2, we describe these simulations and their results with comparisons to past work. In §3, we discuss the -ray emission from these explosions and present calculations of -ray spectra as a function of time and viewing angle. We conclude with a disscussion of the observational prospects of these results, highlighting upcoming gamma-ray missions.
2 Explosion Simulations
For our hydrodynamic simulations, we have used the 15 M⊙progenitor (s15s7b) by Weaver & Woosley (1993). This star has been evolved with a piston-driven explosion to 100 s after bounce, producing 0.24 M⊙of 56Ni. The total energy of this model is roughly erg with roughly erg in kinetic energy. As this explosion moves through the star, the shock hits composition boundaries where strong entropy gradients exist. When the shock hits these boundaries, Rayleigh-Taylor instabilities develop, which can grow and cause the star to mix (Chevalier & Klein 1978; Weaver & Woosley 1980). Our simulations model this mixing and concentrate on the effects that asymmetries have on it.
2.1 Numerical Schemes
We model a series of explosions from 100 s to 1 year after the launch of the supernova shock (Table 1) using a 3-dimensional smooth particle hydrodynamics code (see Warren et al. 2002 for details) based on the parallel oct-tree algorithm developed by Warren & Salmon (1993). This lagrangian code tracks the composition exactly. For 2 of our simulations, we included the energy injection from 56Ni and 56Co decay (and hence also trace the abundances of 56Co and 56Fe). For these 2 models, we assume that all of the decay energy is injected into the gas. At late times, this will overestimate the total energy deposited, as a fraction of this energy will escape, but since we would like an upper limit on the effects of 56Ni decay, and because the injection of energy is less important to the explosion dynamics at late times, this assumption is adequate. For decay energy, we assume that the total energy from decay is erg g-1 with 33% being released from 56Ni decay with a 6.1 d half-life and the other 67% being released from 56Co decay with a 77 d half-life (Colgate, Petschek, & Kriese 1980). This is similar to what Herant & Benz (1992) and Herant & Woosley (1994) used for their models. For an equation of state, we use the same “low-density” equation of state developed by Blinnikov, Dunina-Barkovskaya, & Nadyozhin (1996) that is used in our progenitor model.
We mapped the Weaver & Woosley (1993) model with its 100 s long, spherically symmetric explosion into our 3D SPH code with 2.2 million variably-massed particles. We model the entire sphere, so there are no axis boundaries in this simulation and the neutron star mass at the center is added through an external gravitational force. Asymmetries are added artificially to the velocities only and, for most of the explosions, are added in such a way to insure that the total kinetic energy of the explosion is conserved. The two asymmetries we model are jet explosions:
| (1) |
and equatorial explosions:
| (2) |
where is the velocity from the one dimensional calculation, is the radial velocity for the asymmetric setup, and , , are the x-position, z-position, and radius of the particle. The values of and for each model are given in Table 1, along with the initial kinetic energy of each model. The magnitude of the asymmetries are guided by the results of Fryer & Heger (2000), who found that their rotating core-collapse simulations in 2-dimensions had velocities that were a factor of 2 higher in the pole than in the equator 1.5 s after bounce. We do not use the extreme asymmetric explosions of Khokhlov et al. (1999) which concentrate the explosion energy into a narrow jet. As we shall show (and as Nagataki 2000 argued), such extreme asymmetries are not required to explain outward mixing of nickel in supernovae. Although at the end of their simulation, the asymmetry in polar vs. equatorial velocities is growing, the trend as the shock moves outward will be to spherize the shock. So at this point, it is not clear whether the shock at 100 s will be more or less asymmetric than what Fryer & Heger (2000) found at the end of their simulation.
After mapping these models into our 3-dimensional SPH code, we then run the explosion out to 1 year. When the shock reaches the edge of the star, we assume it is moving through a vacuum. In reality, such a star will have a stellar wind atmosphere surrounding it, but the density of a 15 M⊙wind is so low, that for the purposes of our simulation, zero density material is appropriate. In addition, photon transport is not modeled in our calculations. However, prior to shock breakout, the photons are essentially trapped in the shock. By the time the shock breaks out, most of the internal energy has already been converted to kinetic energy, so although including photon transport will change the ionization state of the exploding stellar material, it does not affect the kinematics significantly.
The smooth particle hydrodynamic technique automatically adds a level of perturbation in the code. With our initial conditions, these perturbations are random with a maximum deviation in a shell of 5-7%. Such large deviations only occur at composition boundaries, specifically the silicon and oxygen shells, and match well the deviations arising from explosive oxygen and silicon flashes prior to collapse (e.g. Bazan & Arnett 1998).
2.2 Explosion and Nickel Distribution
Although we use the same 15 M⊙progenitor that was used by Herant & Woosley (1994), it has a higher explosion energy and we map this model onto our 3-dimensional grid 200 s earlier than Herant & Woosley (1994) mapped their spherically-symmetric explosion simulation onto a 2-dimensional grid. Therefore, although their study has the closest similarities with our work, it is difficult to make direct comparisons to their simulations. Nevertheless, it is interesting to compare the velocity distribution of each chemical element from our 3-dimensional simulations with the 2-dimensional simulations of Herant & Woosley (1994) at 90 days (compare the lower right panel in Fig. 1 of Herant & Woosley 1994 with Fig. 1 in this paper). In Fig.1, the material labelled “hydrogen” includes all material in the hydrogen envelope (as did Herant & Woosley 1994). Similarly, by “nickel” we refer to both the distribution of nickel as well as its decay products (most notably ). Although the distribution of elements is similar in both the 2 and 3 dimensional simulations, the stronger 3-dimensional explosion causes all of the ejecta to be moving slightly faster than that of the 2-dimensional simulation and it is difficult to compare mixing instabilities.
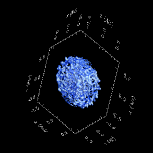
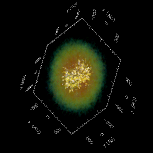
Comparing the convective instabilities themselves is also difficult. In 3-dimensions, the “mushroom”-like structures formed by Rayleigh-Taylor instabilities are not so well defined, and don’t lie along any one plane. However, 4.3 hours into the explosion, it is clear that instabilities have developed (Fig. 2) and these instabilities ultimately mix nickel knots far out into the star (Fig. 3). At the start of the explosion, 56Ni is found only in the inner 1.6 M⊙of the star (1.3 M⊙becomes the neutron star, so the nickel is limited to the inner 0.3 M⊙of ejecta). By the end of the simulation, 56Ni has mixed out nearly to 5 M⊙, beyond the 4.5 M⊙boundary that marked the edge of the helium layer (Fig. 4). Unfortunately, this mixing is, if anything, less than the amount of mixing found in the 2-dimensional simulations of Herant & Woosley (1994). The fact that the mixing is less in 3-dimensions vs. 2-dimensions could be due to the lower effective resolution (we only have 2.2 million particles in 3-dimensions vs. 25,000 particles in the 2-dimensional simulations)111Note that the 2-dimensional simulations of Herant & Woosley (1994) have poor mass resolution and low resolution could be a problem in the 2-dimensional simulations as well as the 3-dimensional simulations. However, bear in mind that the turbulent inverse cascade behaves differently in 2 and 3 dimensions (2-dimensional inverse cascades drive energy to large scales whereas 3-dimensional simulations suggest the energy is driven to small scales and dissipated). It is likely that these differences cause the 2-dimensional simulations to produce more extended instabilities. In any event, it appears that neither our spherical 3-dimensional simulations nor the 2-dimensional simulations seem to give enough mixing to explain the observations of supernovae like 1987A.
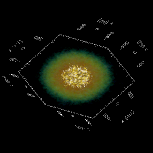
Nagataki et al. (1998) and Nagataki (2000) found that they required mild asymmetries () to explain SN 1987A. Since we model a 15 M⊙star, not a SN 1987A progenitor, it is difficult to both compare with this past work as well as constrain our results with observations of SN 1987A. But we can discuss the basic trends caused by asymmetries. Fig. 5 shows model Jet2 1 year after explosion. Note that although the density distribution has spherized as the shock propogates through the shallow density gradients of the red supergiant envelope (Chevalier & Soker 1989), the distribution of 56Co (the decay product of 56Ni) retains a large asymmetry. We discuss the effects of these asymmetries on the ray emission in §3.
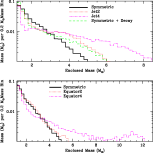
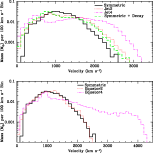
Like Nagataki et al. (1998) and Nagataki (2000), we find that the asymmetries broaden the velocity profile of 56Ni (Fig. 6). However, in our simulations, mild asymmetries () led to only a small increase in th maximum nickel velocity from 2500 km s-1 to 2900 km s-1. For Nagataki et al. (1998), such mild asymmetries increase the maximum nickel velocity from 2200 km s-1 to 3200 km s-1! This difference could be progenitor dependent, an effect of 3-dimensional vs. 2-dimensional convection, or the lack of resolution in our 3-dimensional models. Extracting the true cause of this difference awaits future calculations with similar initial conditions.
However, increasing the amount of asymmetry by another factor of 2 (Models Jet4, Eq4) causes some nickel to be ejected at very high velocities. The amount of mixing in these cases reaches extremes with the nickel well into the hydrogen envelope. Such mixing has decided signatures in both the emergence of the -ray line flux and the shape of the -ray lines (§3). Note that the energy released from the decay of nickel also helps to mix out the nickel (on par with the effects of mild asymmetries). Clearly, the energy released from the decay of nickel cannot be neglected in any accurate mixing calculation.
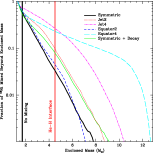
This mixing also has important repercussions for nucleosynthetic yields and the mass-cut for the remnant mass. Most black holes are formed in stars which produce supernova explosions that are too weak to throw off all of the stellar envelope and the subsequent fallback produces a black hole (Fryer & Kalogera 2001). In our models (Jet2, Sym+Decay, etc.), more than 10% of the nickel produced is ejected well beyond the helium core (Fig. 7). If this trend holds for more massive stars such as the progenitor of SN 1997D (Turatto et al. 1998), then the entire helium core of such a star (8 M⊙) could fall back and still enough nickel would escape to power the observed light curve! Bear in mind, however, that weaker explosions may well produce less mixing, so adapting the results of our simulations to supernovae like 1997D must be taken with some caution.
| ModelaaThe models include ones with symmetric initial conditions (Sym), explosions along the polar axis (Jet), and explosions along the equator (Eq). Those models which include the effects of Nickel and Cobalt decay are denoted with a “D” suffix. | bbThe input models include the Symmetric explosion model (Sym), the Jet2 explosion model for the polar (Jet2-P) and equator (Jet2-E) viewing angles | K.E.Initial | T.E.Initial | K.E.final | MixingccFor the polar explosions, the radial velocity () is given by: and for equatorial explosions: where is the velocity from the one dimensional calculation, , , are the x-position, z-position, and radius of the particle. | |
|---|---|---|---|---|---|---|
| (ergs) | (ergs) | (M⊙) | ||||
| Sym | 1.0 | 1,0 | 1.0 | 0.51 | 1.3 | 4.6 |
| Sym D | 1.0 | 1,0 | 1.0 | 0.51 | 1.3 | 5.5 |
| Jet2 | 2.0 | 1.0 | 0.51 | 1.3 | 5.6 | |
| Jet2 D | 2.0 | 1.0 | 0.51 | 1.3 | 5.7 | |
| Jet4 | 4.0 | 1.0 | 0.51 | 1.3 | 8.0 | |
| Eq2 | 0.5 | 1.0 | 0.51 | 1.3 | 5.0 | |
| Eq4 | 0.25 | 1.2ddNote that the initial energy for the extreme asymmetric model was larger than the other models. In part, this explains the extended mixing of this model. | 0.51 | 1.6 | 11.3 |
3 High Energy Spectral Calculations
For our spectral calculations, we have used data from the 3-dimensional explosion simulation discussed in the previous section. We input ejecta material properties from five different snapshots in time at 150, 200, 250, 300 and 365 days after explosion. Spectral calculations were carried out for both the Jet2 and Symmetric explosion models. Our analysis of these model spectra concentrates on the differences in total luminosity and line profile shape with the introduction of realistic explosion asymmetries. Since the progenitor star used as input to our simulations was a 15 M⊙red supergiant, we are unable to directly compare our calculated spectra with the observed high energy spectra of SN 1987A. However, we discuss how our models compare to various spectral trends observed from SN 1987A.
3.1 Numerical Schemes
We used a Monte Carlo technique, similar to that described in Ambwani & Sutherland 1988, for modelling -ray transport in 3-dimensions. Input models of the supernova ejecta (element abundances, density and velocities) were taken from the “Jet2” and “Symmetric” SPH explosion simulations and mapped onto a 140 140 140 cartesian grid. Escaping photons were tallied into 250 coarse energy bins, with finer binning at the decay line energies to provide line profile information. The emergent photons were also tallied into 11 angular bins ( = 10∘) along the polar axis (the models investigated in this work are axisymmetric, alleviating the need to tally in azimuthal angle as well.)
The decay of the radioactive species (predominantly 56Ni and its decay product: 56Co) in the supernova ejecta gives rise to the -ray line emission. As in Ambwani & Sutherland 1988, we assign the energy of the emitted photon packets according to the decay probabilities (Lederer & Shirley 1978) for the various radioactive species (56Ni, 56Co, 57Co, 44Ti, 44Sc, and 22Na). We include a total of 56 decay lines from these species, but for the explosion times considered, the packets fall predominantly into 15 decay lines. Roughly Monte Carlo photon bundles were generated for each input model in proportion to the mass of radioactive material distributed throughout the ejecta. The material properties of the ejecta were not evolved with photon flight time. However, we found that 99 % of the photons contributing to the observed model spectra have escape times of less than 2 days. This is sufficiently shorter than the timescales for change in the hydrodynamic models that our assumption of a fixed material background should be valid for the time slices considered here. The luminosity weight of each photon packet and the opacities seen by the packet were calculated in the comoving frame of the fluid, but all photon properties were boosted to the observer’s frame before being tallied into spectral observables.
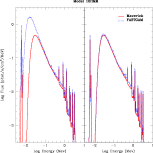
In all models, photoelectric and pair production opacities were calculated for the elements H, He, C, N, O, Ne, Mg, Si, S, Ar, Ca, Ti, Cr, Fe, Co, and Ni which correspond to the elements used in the nucleosynthesis calculations for the progenitor star from Weaver & Woosley (1993). The cross section data for these elements were taken from the LLNL Evaluated Nuclear Data Library (Plechaty, Cullen, and Howerton 1981, revised 1987). The angle- and energy-dependent Compton scattering opacities were calculated assuming that all electrons, bound and free, contribute to the total cross section. Daughter products from the absorption processes were not followed (e.g. positron annihilation photons from pair production and K-shell fluorescence photons from photoelectric absorption.) In order to test the validity of this last approximation, we compared the results of our 3-dimensional Monte Carlo transport code (Maverick) with the 1-dimensional code FASTGAM (Pinto & Woosley 1988a). Good agreement was found between the model spectra whether the daughter products of absorption were included in FASTGAM or not. This justified the decision to disregard the fluorescence and annihilation photons in Maverick.
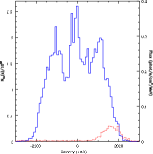
Figure 8, shows comparison spectra with the 1-dimensional FASTGAM code for model 10HMM (Pinto & Woosley 1988b). This is a logarithmic plot of photon flux (photons/second/MeV/cm2, assuming a distance of 60 kpc) across the energy range 0.3 keV - 4 MeV. The input model (10HMM) is an artificially mixed version of the Woosley 1988 10H model progenitor for SN 1987A. The first comparisons between FASTGAM and Maverick (left panel of Figure 8) showed significant differences in the location of the hard X-ray fall off. This was due to an invalid assumption in FASTGAM of constant electron fraction for all species which contribute to photoelectric and pair production opacities. This assumption is not valid for hydrogen, and results in a lower calculated opacity for the lower energy X-rays. The right panel of Figure 8 shows the hard X- and -ray spectra calculated from the two different codes after the absorption opacity correction was made. There is good agreement across the spectrum to within the uncertainties of the Monte Carlo calculation.
3.2 Hard X-ray and -ray Spectrum
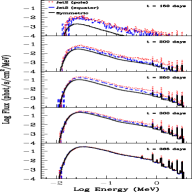
Figure 9 is a logarithmic plot of photon flux in units of photons/second/MeV/cm2 across the energy range investigated with these simulations (0.3 keV - 4 MeV). We have placed this object at the distance of the Large Magellanic Cloud (60 kpc) for easy comparison with flux data from SN 1987A observations. The 5 panels are spectra from the different time slices; in each panel, we plot the spectrum for the Symmetric model, along with polar and equatorial views of the Jet2 model. It can be seen immediately that the hard X-rays emerge earlier from the ejecta with a global explosion asymmetry (Jet2 model). This holds regardless of viewing angle (pole versus equator) towards the explosion.
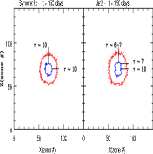
The fact that the hard X-ray flux in the aspherical explosion model is larger than the symmetric explosion, regardless of line of sight, can be understood in principle from optical depth arguments. In Figure 10, we show a contour plot of density (outer contour) and 56Co number density (inner contour) for the Jet2 and Symmetric models at t = 150 days. Decay of 56Co is the major source of -ray photons, so the inner contour essentially traces the surface of the emission region. The horizontal and vertical lines in Figure 10 represent lines of sight from the ejecta surface to the emission source and are labeled with the optical depth along that line of sight. The dominant opacity for the hard X- and -rays is Compton scattering off electrons and, since the density contours remain roughly spherical in both models, the optical depth from a given point to the ejecta surface is roughly constant. In the Jet2 model, the 56Ni was mixed out to larger radii in the polar direction, so it makes perfect sense that we see enhanced emission over the Symmetric model spectrum for that viewing angle (the optical depth that the high energy photons must pass through is 10 in the symmetric model versus along the polar line-of-sight in the Jet2 model).
At a first glance, one might expect that, in the Jet2 explosion along the equatorial line-of-sight, the total flux should also be low (the optical depth from the nickel in the equator is also roughly 10). However, this material does not dominate the high energy emission seen along the equatorial line-of-sight. The material ejected along the poles has been mixed far enough out in the ejecta that the optical depth these high energy photons must travel through, even along the equatorial line-of-sight, is quite low (). It is this nickel which dominates the hard X-ray emission at all viewing angles. In fact, the optical depth from the “ends” of the 56Co distribution does not differ very much between the polar view and the equator view ( = 6 & 7 respectively), which explains why the overall hard X-ray flux depends only mildly on viewing angle.
For the later time slices, this mismatch in escaping emission from the “ends” versus the equatorial plane ejecta is less pronounced, and the equator view spectrum has comparable contributions from both regions.
| ModelbbThe input models include the Symmetric explosion model (Sym), the Jet2 explosion model for the polar (Jet2-P) and equator (Jet2-E) viewing angles | Time | 3-30 keVccWe limit the extent of mixing by the furthest position (in mass coordinates) beyond which more than 3% of the nickel produced near the core is mixed out. | 30-100 keVccUnits are erg s-1 | 100-500 keVccUnits are erg s-1 | 500-1000 keVccUnits are erg s-1 | 1000-3800 keVccUnits are erg s-1 | 847 keV LineddUnits are s-1 | 1238 keV LineddUnits are s-1 |
|---|---|---|---|---|---|---|---|---|
| (day) | ||||||||
| Sym | ||||||||
| 150 | 3.715(0.138)1035 | 2.008(0.162)1036 | 6.537(0.930)1036 | 9.281(2.135)1036 | 3.973(1.448)1037 | 6.828(1.593)1041 | 4.687(1.588)1041 | |
| 200 | 5.172(0.044)1036 | 3.183(0.055)1037 | 1.058(0.032)1038 | 1.440(0.075)1038 | 5.685(0.498)1038 | 1.156(0.061)1043 | 9.622(0.632)1042 | |
| 250 | 1.844(0.006)1037 | 1.272(0.009)1038 | 4.302(0.052)1038 | 5.727(0.119)1038 | 2.015(0.074)1039 | 5.008(0.103)1043 | 4.476(0.106)1043 | |
| 300 | 3.714(0.007)1037 | 2.996(0.011)1038 | 1.043(0.007)1039 | 1.367(0.015)1039 | 4.257(0.085)1039 | 1.362(0.014)1044 | 1.280(0.014)1044 | |
| 365 | 4.529(0.010)1037 | 4.910(0.018)1038 | 1.855(0.011)1039 | 2.446(0.025)1039 | 6.650(0.131)1039 | 3.016(0.027)1044 | 2.886(0.026)1044 | |
| Jet2-E | ||||||||
| 150 | 1.503(0.585)1036 | 9.891(4.221)1036 | 2.812(1.573)1037 | 3.877(2.897)1037 | 1.200(1.089)1038 | 2.748(2.547)1042 | 3.041(2.813)1042 | |
| 200 | 8.262(1.177)1036 | 5.565(1.103)1037 | 1.779(0.543)1038 | 2.066(1.004)1038 | 6.171(4.649)1038 | 2.150(1.188)1043 | 1.244(0.942)1043 | |
| 250 | 2.783(0.164)1037 | 2.290(0.249)1038 | 7.969(1.379)1038 | 8.943(2.822)1038 | 2.700(1.366)1039 | 8.641(2.862)1043 | 7.455(2.908)1043 | |
| 300 | 4.260(0.279)1037 | 3.996(0.460)1038 | 1.475(0.262)1039 | 1.774(0.553)1039 | 5.049(2.500)1039 | 1.937(0.612)1044 | 1.712(0.572)1044 | |
| 365 | 4.576(0.218)1037 | 5.667(0.435)1038 | 2.285(0.268)1039 | 2.933(0.613)1039 | 7.678(2.686)1039 | 3.864(0.674)1044 | 3.624(0.634)1044 | |
| Jet2-P | ||||||||
| 150 | 2.136(0.710)1036 | 1.447(0.516)1037 | 4.529(2.289)1037 | 7.679(4.313)1037 | 3.592(2.866)1038 | 5.486(3.883)1042 | 3.041(2.820)1042 | |
| 200 | 1.160(0.139)1037 | 8.387(1.527)1037 | 2.887(0.783)1038 | 4.747(2.002)1038 | 1.904(1.098)1039 | 4.442(1.973)1043 | 4.628(2.118)1043 | |
| 250 | 3.461(0.181)1037 | 3.191(0.301)1038 | 1.186(0.181)1039 | 1.824(0.441)1039 | 5.588(2.098)1039 | 2.244(0.439)1044 | 2.334(0.448)1044 | |
| 300 | 4.556(0.286)1037 | 5.015(0.520)1038 | 1.995(0.319)1039 | 2.987(0.782)1039 | 8.274(3.336)1039 | 4.357(0.884)1044 | 4.210(0.821)1044 | |
| 365 | 4.151(0.208)1037 | 6.217(0.464)1038 | 2.746(0.300)1039 | 4.048(0.722)1039 | 1.010(0.312)1040 | 7.200(0.899)1044 | 6.383(0.832)1044 |
3.3 -ray Line Profiles
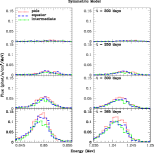
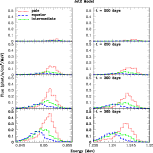
Although the overall hard X-ray emission shows little variation between pole and equator views, a detailed look at the -ray line profile shapes and strengths, for the 1.238 and 0.847 MeV 56Co lines, does reveal trends with viewing angle. Figures 11 and 12 show line profiles of these two 56Co lines for both the Symmetric and Jet2 explosion models. The broadening of the line is caused by Doppler velocity shifts resulting from the spatial distribution of radioactive nickel in the homologously expanding ejecta. The 4 panels shown are for days 200, 250, 300, and 365 after explosion. The three lines in the Jet2 spectra represent different viewing angles through the ejecta (along the pole, the equator and an intermediate angle .) For the Symmetric spectra, we have plotted these same viewing angles.
3.3.1 Global Asymmetry
Both explosion scenarios (Symmetric and Jet2) show blue-shifted line profiles and this effect is most enhanced in the Jet2 model. These differences can be best understood by examining the physical effects which dictate the formation of the line profile edges. The blue edge to the lines is set by the maximum observed line-of-sight velocity of the 56Co in the ejecta. Because the nickel was mixed further out (and achieves higher velocities) for the asymmetric explosions, the -ray line profiles viewed along the line-of-sight of the jet are much more blueshifted for the Jet2 model than the Symmetric model
Note, however, that the line profiles in the asymmetric explosion model (Jet2) depend upon viewing angle. off the jet axis, the nickel producing the line profiles arises from both fast-moving jet ejecta and the ejecta along the equator. Because the fast-moving ejecta is moving perpendicular to the line of sight, the -rays from this material are not blueshifted significantly, and the slow moving equatorial material also produces only a modest blueshift. Hence, the line profiles viewed along the equatorial line-of-sight are blueshifted much less than those viewed along the polar line-of-sight.
The red edge of the lines is determined by the escaping emission from 56Co with the smallest line-of-sight velocity in the ejecta. In a Symmetric model, this should be an indication of how deep into the ejecta we can see along a given viewing angle. However, there is a more pronounced effect at play in the asymmetric explosion models. As we mentioned in the previous section, much of the -ray emission for the equatorial view arises from the “ends” of the 56Co distribution. This material has a very low line-of-sight velocity for an equatorial observer, since it is being ejected predominantly in the polar direction. This allows for a significantly lower velocity red edge of the equator view lines, even though the optical depth profiles do not vary much between polar and equator viewing angles.
Also note that the line centroids become less blue-shifted with time. As the supernova expands, the opacity in the ejecta drops and emission from material located deeper into the ejecta (and thus at smaller radial velocities) becomes visible. This results in an overall broadening of the line, as well as a redward shift of the line centroid.
3.3.2 Clumping Asymmetry
This basic understanding of the line profile edges addresses only global features of the emitted decay lines. To understand the range of possibilities that the line shape may take between those edges, we must concentrate on the spatial distribution of the radioactive elements in the supernova ejecta.
Because the expansion is basically homologous after 100 days, the line-of-sight velocity of a fluid element in the ejecta is proportional to its distance above the mid-plane of the explosion. Each spectral energy bin in the line profile can be mapped to a unique line-of-sight velocity in the ejecta, which can in turn be mapped to a specific height above the mid-plane. So, given the distribution of cobalt as a function of x, y and z-coordinates ( , where z is along the line-of-sight to the observer), the line profile shape should be proportional to
| (3) |
Optical depth effects, as discussed above, will alter the line shape from this basic picture, but it is important to realize that the clumping, which occurs as the inner material is mixed outward, can cause sizeable irregularities in the profiles. Figure 13 shows a plot of versus line-of-sight velocity for the polar view of model Jet2 at 250 days with higher spatial resolution than the previous run. The emergent -ray line flux is plotted with a dotted line and can be seen to peak at velocities of around 1800 km/s. This corresponds to the location in the ejecta at which the exponential attenuation from the optical depth surpasses the flux enhancement from increasing cobalt mass: . As the ejecta expand and optical depth drops, the -ray line profiles will take on the irregular shape seen in the cobalt distribution.
4 Conclusions
In our simulations, we found that asymmetric explosions lead to extensive mixing of the supernova ejecta, placing the products of explosive burning well into the helium layer of the star. Even mild 2:1 asymmetries can mix 10% of the nickel out to the inner edge of the hydrogen layer. If such mixing occurred in weak explosions, as well as the strong explosions presented in this paper, these mildly asymmetric supernova explosions could explain the extensive mixing required in population III stars (Umeda & Nomoto 2002) and black hole binary systems such as Nova Scorpii (Podsiadlowski et al. 2002).
From the Monte Carlo transport simulations, we find that the high energy fluxes at early times (150 days) for the asymmetric explosion model is roughly 4-5 times larger than for the corresponding symmetric explosion model. This suggests that emission from an explosion with mixing and global asymmetry would be observed roughly 50-100 days earlier than a symmetric explosion model with mixing alone. In addition, the line profiles for the asymmetric explosion vary with viewing angle and are brightest for the polar view. Along this viewing angle, the integrated line flux is enhanced by a factor of 2-3 over the symmetric explosion, and the lines peak at roughly 3-5 times brighter than the symmetric explosion line profiles. The integrated flux enhancement for the equator view of the Jet2 model is of order 30 % over the symmetric model. The line centroids observed for the asymmetric explosion are shifted relative to those from the symmetric model (more to the blue for the polar view and slightly more to the red for the equator view.) At later epochs in the SN explosion, the line profiles should reflect the irregular shapes seen in the underlying cobalt distribution, which result from the clumpy nature of the outward mixing of nickel in the ejecta. Table 2. summarizes the calculated luminosities of the different models for various continuum energy bands and the 1.238 and 0.847 MeV 56Co lines.
With the recent launch of the International Gamma-Ray Astrophysics Laboratory (INTEGRAL), it is particularly interesting to analyze our results in terms of the instrumental resolution and sensitivities this satellite can provide across these energy bands. It is important to keep in mind that the nickel mass synthesized in this 15 M⊙ model is roughly 3 times larger than the typically observed value (0.08 M⊙) for core-collapse SN explosions. Since the high energy emission should scale linearly with nickel mass, the fluxes observed for this model will be roughly 3 times brighter than we would expect for a more typical core-collapse event. In fact, the high energy continuum for our Symmetric model explosion is of order 3 times brighter than was observed towards SN 1987A. Since 1987A’s nickel yield was fairly typical, this comparison seems to validate the linear scaling of flux with nickel mass.
Our models suggest that -ray line observations will be most useful for diagnosing the departure of a core-collapse explosion from spherical symmetry. At energies around 1 MeV, INTEGRAL will have a spectral resolution of 2 keV and a narrow line sensitivity ( in 106 seconds) of 510-6 phot s-1 cm-2 (Hermsen & Winkler 2002). Our model lines are about 5 times broader than this resolution element, so the sensitivity for detecting them is worse by roughly . Using these specifications, INTEGRAL would be able to detect the 56Co lines from the polar view of the Jet2 model at a distance of 650 kpc.
References
- Ambwani & Sutherland (1988) Ambwani, K. & Sutherland, P. 1988, ApJ, 325, 820
- Arnett (1988) Arnett, W. D. 1988, ApJ, 331, 377
- Arnett, Fryxell, & Müller (1989) Arnett, D., Fryxell, B., & Müller, E. 1989, ApJ, 341, L63
- Arnett et al. (1989) Arnett, W. D., Bahcall, J. N., Kirshner, R. P., & Woosley, S. E. 1989, ARA&A, 27, 629
- Bazan & Arnett (1998) Bazan, G.,& Arnett, D 1998, ApJ, 496, 316
- (6) Blinnikov, S. I., Dunina-Barkovskaya, N. V., & Nadyozhin, D. K. 1996, ApJS, 106, 171
- Burrows & Hayes (1995) Burrows, A., Hayes, J., & Fryxell, B. A. 1995, ApJ, 450, 830
- Burrows & Hayes (1996) Burrows, A., & Hayes, J. 1996, PRL, 76, 352
- Chevalier & Klein (1978) Chevalier, R. A., & Klein, R. I. 1978, ApJ, 269, 281
- Chevalier & Soker (1989) Chevalier, R. A., & Soker, N. 1989, ApJ, 341, 867
- Colgate, Petschek & Kriese (1980) Colgate, S. A., Petschek, A. G., Kriese, J. T. 1980, ApJ, 237, L81
- Cook et al. (1988) Cook, W. R., Palmer, D. M., Prince, T. A., Schindler, S. M., Starr, C. H., & Stone, E. C. 1988, ApJ, 334, L87
- Dotani et al. (1987) Dotani, T., Hayashida, K., Inoue, H., Itoh, M., & Koyama, K. 1987, Nature, 330, 230
- Fassia et al. (1998) Fassia, A., Meikle, W. P. S., Geballe, T. R., Walton, N. A., Pollacco, D. L., Rutten, R. G. M., Tinney, C. 1998, MNRAS, 299, 150
- Fryer, Burrows, & Benz (1996) Fryer, C.L., Burrows, A., & Benz, W. 1996, ApJ, 496, 333
- Fryer & Heger (2000) Fryer, C. L., & Heger, A. 2000, ApJ, 541, 1033
- Fryer & Kalogera (2001) Fryer, C. L., & Kalogera, V. 2001, ApJ, 554, 548
- Fryxell, Arnett, & Müller (1991) Fryxell, B., Arnett, D., & Müller, E. 1991, ApJ, 367, 619
- Haas et al. (1990) Haas, M. R., Erickson, E. F., Lord, S. D., Hollenbach, D. J., Colgan, S. W. J., & Burton, M. G. 1990, ApJ, 360, 257
- Hachisu et al. (1990) Hachisu, I., Matsuda, T., Nomoto, K., & Shigeyama, T. 1990, ApJ, 358, L57
- Herant & Benz (1991) Herant, M., & Benz, W. 1991, ApJ, 370, L81
- Herant & Benz (1992) Herant, M., & Benz, W. 1992, ApJ, 387, 294
- Herant & Woosley (1994) Herant, M., & Woosley, S.E. 1994, ApJ, 425, 814
- Herant et al. (1994) Herant, M., Benz, W., Hix, W.R., Fryer, C.L. & Colgate, S.A. 1994, ApJ, 435, 339
- Hermsen & Winkler (2002) Hermsen, W. & Winkler, C. 2002 Proceedings of the 22nd Moriond Astrophysics Meeting
- Höflich (1991) Höflich, P., 1991, A&A, 246, 481
- Janka & Mönchmeyer (1989) Janka, H.-T. & Mönchmeyer, R., 1989, A&A, 209, L5
- Janka & Müller (1996) Janka, H.-Th., & Müller, E. 1996, A&A, 306, 167
- Kifonidis et al. (2000) Kifonidis, K., Plewa, T., Janka, H.-Th., Müller, E. 2000, ApJ, 531, L123
- Kifonidis et al. (2003) Kifonidis, K., Plewa, T., Janka, H.-Th., Müller, E. 2003, astro-ph/0302239
- (31) Khokhlov, A.M., Höflich, P.A., Oran, E.S., Wheeler, J.C., Wang, L., Chtchelkanova, A. Yu. 1999, ApJ, 524, L107
- Lai (2000) Lai, D. 2000, ApJ, 540, 946
- Lederer & Shirley (1978) Lederer, C. M., & Shirley, V. S. 1978, Table of the Isotopes (7th ed., New York; Wiley)
- Leonard & Filippenko (2001) Leonard, D. C., & Filippenko, A. V. 2001, PASP, 113, 920
- (35) Mahoney, W. A., Varnell, L. S., Jacobson, A. S., Ling, J. C., Radocinski, R. G., & Wheaton, Wm. A. 1988, ApJ, 334, L81
- Matz et al. (1988) Matz, S. M., Share, G. H., Leising, M. D., Chupp, E. L., & Vestrand, W. T. 1988, Nature, 331, 416
- Mönchmeyer & Müller (1989) Mönchmeyer, R. & Müller, E., 1989, in NATO ASI series, Timing Neutron Stars, ed. H. Ögelman & E.P.J. van den Heuvel (New York: ASI)
- Müller, Fryxell, & Arnett (1991) Müller, E., Fryxell, B., & Arnett, D. 1991, A&A, 251, 505
- Nagataki et al. (1997) Nagataki, S., Hashimoto, M., Sato, K., & Yamada, S. 1997, ApJ, 486, 1026
- Nagataki et al. (1998) Nagataki, S., Shimizu, T.M., & Sato, K. 1998, ApJ, 495, 413
- Nagataki (2000) Nagataki, S. 2000, ApJS, 127, 141
- (42) Pinto, P. A., & Woosley, S. E. 1988a, ApJ, 329, 820
- (43) Pinto, P. A., & Woosley, S. E. 1988b, Nature, 333, 534
- Podsiadlowski et al. (2002) Podsiadlowski, P., Nomoto, K., Maeda, K., Nakamura, T., Mazzali, P., & Schmidt, B. 2002, ApJ, 567, 491
- Shigeyama, Nomoto, & Hashimoto (1988) Shigeyama, T., Nomoto, K., & Hashimoto, M. 1988, A&A, 196, 141
- Shigeyama & Nomoto (1990) Shigeyama, T. & Nomoto, K. 1990, ApJ, 360, 242
- Shigeyama et al. (1990) Shigeyama, T., Nomoto, K., Tsujimoto, T., & Hashimoto, M. 1990, ApJ, 361, L23
- Spyromilio, Meikle, & Allen (1990) Spyromilio, J., Meikle, W. P. S., & Allen, D. A. 1990, MNRAS, 242, 669
- Spyromilio (1994) Spyromilio, J. 1994, MNRAS, 266, L61
- Sunyaev et al. (1987) Sunyaev, R., Kaniovskii, A., Efremov, V., Gilfanov, M., & Churazov, E. 1987, Nature, 330, 227
- Tueller et al. (1990) Tueller, J., Barthelmy, S., Gehrels, N., Teegarden, B. J., Leventhal, M., & MacCallum, C. J. 1990, ApJ, 351, L41
- Turatto et al. (1998) Turatto, M., Mazzali, P. A., Young, T. R., Nomoto, K., Iwamoto, K., Benetti, S., Cappallaro, E., Danziger, I. J., de Mello, D. F., Phillips, M. M., Suntzeff, N. B., Clocchiatti, A., Piemonte, A., Leibundgut, B., Covarrubias, R., Maza, J., Sollerman, J. 1998, ApJ, 498, L129
- Umeda & Nomoto (2002) Umeda, H. & Nomoto, K. 2002, ApJ, 565, 385
- Wang et al. (2001) Wang, L., Howell, D. A., Höflich, P., Wheeler, J. C. 2001, ApJ, 556, 302
- Warren & Salmon (1993) Warren, M. S. & Salmon, J. K. 1993, Supercomputing ’93, IEEE Comp. Soc, pg. 12
- Weaver & Woosley (1980) Weaver, T. A., & Woosley, S. E. 1980, in AIP Conf. Proc. 63, Supernovae Spectra, ed. R. Meyerott & G. H. Gillespie (New York: AIP), 15
- Weaver & Woosley (1993) Weaver, T. A., & Woosley, S. E. 1993, Phys. Rep., 227, 65
- Woosley (1988) Woosley, S. E. 1988, ApJ, 330, 218
- Woosley & Eastman (1997) Woosley, S. E., & Eastman, R. G., 1997, in Thermonuclear Supernovae, Proceedings of the NATO Advanced Study Institute, Begur, Girona, Spain, June 20-30, 1995, Dordrecht: Kluwer Academic Publishers, 1997, edited by P. Ruiz-Lapuente, R. Canal, and J. Isern. NATO Advanced Science Institutes (ASI) Series C, Volume 486, p.821