Integral Field Spectroscopy of SN 2002er with PMAS
We present observations of the Type Ia supernova SN 2002er during the brightening phase. The observations were performed with the Potsdam Multi Aperture Spectrophotometer (PMAS) integral field instrument. Due to the 8″8″ field of view of the spectrograph an accurate background subtraction was possible. Results from analyses of the evolution of absorption features in comparisons with other SNe show that SN 2002er is a fairly bright Type Ia supernova with a peak brightness of M.
Key Words.:
supernova: individual – SN 2002er, Type Ia – spectroscopy: integral field1 Introduction
Type Ia SNe have been shown not to be the exact standard candles they were taken for 15 years ago (Branch et al. 1988). It is now known that there are several subtypes having slightly different energetics, peak intensities, light curves, colours, velocities of the outflow, and synthesized nickel masses. Remarkably, the SNe in elliptical galaxies are found to have smaller expansion velocities than the SNe in spirals (Hamuy et al. 1996). This is not due to differences in the circumstellar environments of the SNe, but appears to be intrinsic for the progenitors (Leibundgut 2000). Correlations between observable properties have been found, e.g. the light curves of the intrinsically brighter Type Ia SNe rise and decay more slowly than the faint ones (Phillips 1993).
SN 2002er (17h11m2988 +7∘59′448, J2000.0 ) in the galaxy UGC 10743 was discovered on Aug 23 and reported in IAUC 7959 (Wood-Vasey et al. 2002). The SN was reported to be a Type Ia and expected to show optical peak brightness around Sep 6 (Smartt et al. 2002). The date of maximum depends on the filter. E.g. Contardo et al. (2000) found that the band peak for 22 SN Ia occurred from 1 to 3 days after the band peak. Typically, the time from the explosion until the peak in the band light curve is 20 days (Kirshner et al. 1993; Leibundgut 2000). The host galaxy has a redshift of 2568 km s-1 (Falco et al. 1999), which corresponds to a distance of 40 Mpc when assuming H0= 65 km s-1 Mpc-1. The total reddening towards the SN was estimated to be = 0.3 (Smartt et al. 2002) including a Galactic reddening of = 0.16 (Schlegel et al. 1998).
We observed the supernova with the Potsdam Multi Aperture Spectrophotometer (PMAS) as a target of opportunity on 5 nights in the brightening phase, with the last observations around the time of peak intensity. Here we present an analysis of the evolution of some of the absorption features in the spectra and compare them to other Type Ia SN.
2 Observations and data reduction
Observing with PMAS at the Calar Alto 3.5m telescope, we obtained spectra of the SN during several dates starting on Aug 31, 2002 and ending Sep 7. The PMAS instrument has two cameras: A cryogenic acquisition and guiding camera (A&G camera) that can be used for imaging in addition to the integral field spectrograph (IFS) (Roth et al. 2000).
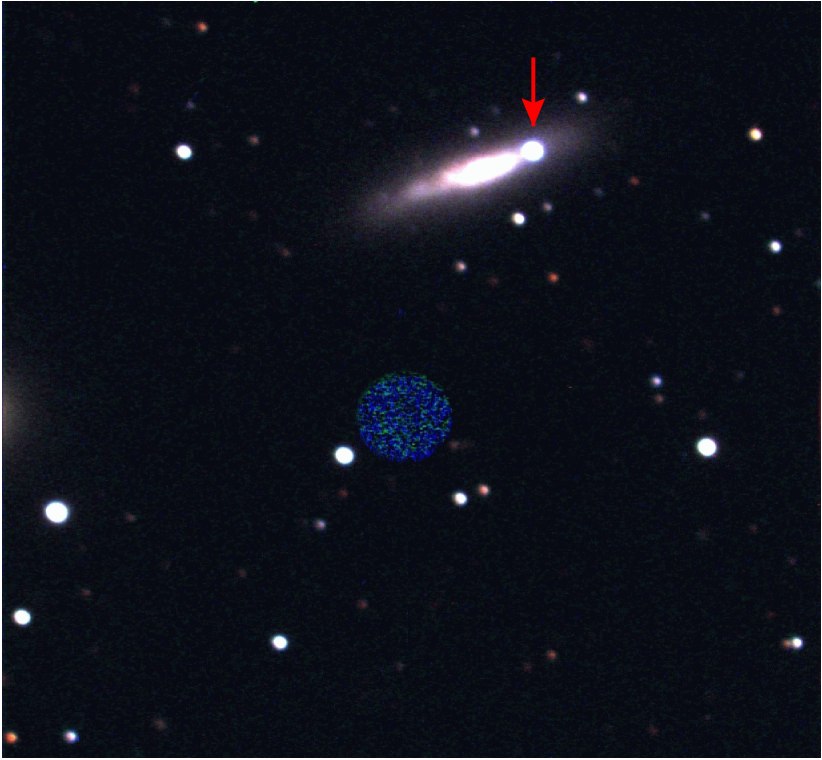
The A&G camera has a SITe TK1024 chip with 1k1k pixels, and a scale of 02 per pixel. The A&G camera is equipped with optical filters allowing guiding and imaging in different wavelength regions. An A&G image of SN~2002er can be seen in Fig 1 with a field of view of 3434. The images were reduced with standard procedures, by subtracting a bias frame and applying flat field correction.
The PMAS spectrograph is equipped with 256 fibers coupled to a 1616 lens array. Each fiber has a spatial sampling of 0505 on the sky resulting in a field of view of 8″8″. The spectrograph has a SITe ST002A 2k4k CCD. The 256 spectra have a FWHM of 4 pixels and are aligned on the CCD with 12 pixels between adjacent spectra making cross-contamination negligible.
The observations were performed with the gratings used for the primary science targets during these nights, i.e. a 600 and a 300 gr/mm grating. The spectral resolution obtained with these gratings is 3 and 6 Å, respectively. Calibration images were obtained following the science exposures for each night. The calibrations consist of spectra of emission line lamps (HgNe), and spectra of a continuum lamp necessary to locate the 256 individual spectra on the CCD, whose precise positions are shifting as a function of instrument flexure and grating angle. Observations of the spectrophotometric standard stars BD~+28$^∘$4211, HD~192281, and BD~+25$^∘$3941 were obtained during the nights, and used for flux calibrations. In addition to the SN spectra we have obtained spectra of the central region of the host galaxy. A summary of the observations is given in Table 1.
| Date | UT | Exptime | Grating | Spec. range |
| (start) | (s) | (Å) | ||
| SN 2002er | ||||
| Aug 31. | 21:08 | 1320 | U600 | 3470 – 5070 |
| 600 | U600 | 5140 – 6650 | ||
| Sep 1. | 21:38 | 1920 | U600 | 3470 – 5070 |
| Sep 3. | 21:04 | 1500 | V300 | 3925 – 7260 |
| Sep 5. | 20:00 | 900 | V300 | 3925 – 7260 |
| Sep 7. | 20:56 | 900 | V300 | 3925 – 7260 |
| UGC 10743 | ||||
| Sep 3. | 20:23 | 1200 | V300 | 3925 – 7260 |
2.1 Reduction of spectra
The data extraction and reduction of the spectra was done with P3D_online111Further information can be found at the PMAS webpages http://www.aip.de/groups/opti/pmas/OptI_pmas.html, an IDL based software package created for reduction of PMAS data (Becker 2001). The raw CCD frames were bias subtracted, and the extracted spectra are flat-fielded correcting for throughput variations of individual fibers using twilight sky exposures. The flux calibration was performed with standard procedures in IRAF by comparing the extracted spectra of the standard star with table values, and using table values from Calar Alto in order to correct for the atmospheric extinction. With exposures of Hg and Ne lamps obtained right after the science exposures, the spectra were wavelength calibrated.
The reduced spectra were contained in a 16161024 pixels data cube (with 22 binning). The average background was estimated from the 60 spectra at the edges of the field of view. We first took an average of all 256 spectra and subtracted the average background. This produces a noisy spectrum of the supernova, but no flux is lost due to any chosen aperture. A higher S/N spectrum of the supernova was obtained by co-adding the spectra within a radius of 15 of the center of the SN, and then scaling to the level of the low S/N “wide aperture” spectrum.
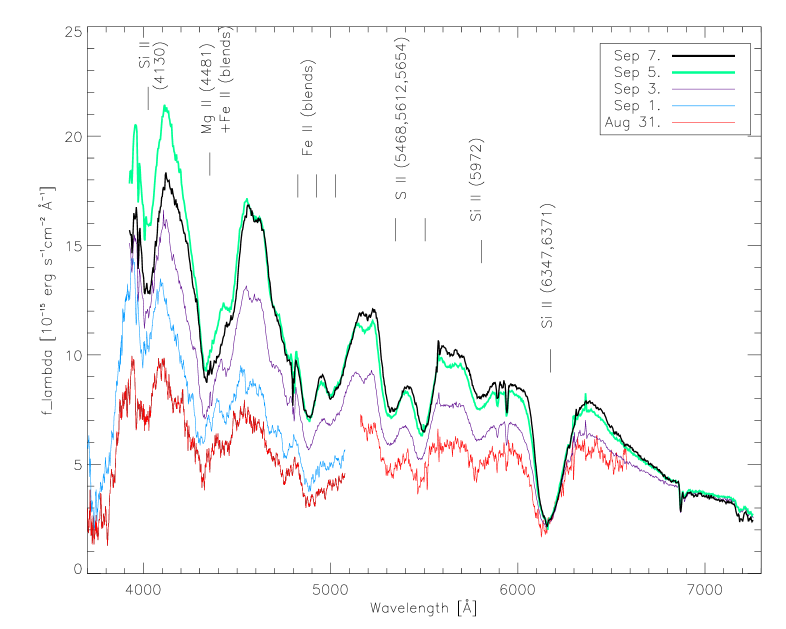
We did not have reliable spectrophotometric standard star observations on Aug 31 and Sep 1. In order to perform accurate flux calibration we analysed the band A&G images from all dates. A model of the host was subtracted from the images and the uncontaminated flux from the SN was found. With relative photometry between the SN and field stars we are able to rescale the flux of the red part of the spectrum on Aug 31, similar to the technique described in Barwig et al. (1987). We did not have appropriate A&G data to re-calibrate the blue part of the spectra using a similar method. We estimate that the flux-levels for the blue spectra on Aug 31 is uncertain by 20% estimated from comparison with the flux for the red spectrum. The flux of the blue spectrum at Sep 1 should lie between the Aug 31 and Sep 3 spectral flux, so we estimate that this flux is uncertain by 15%. The calibrated spectra are shown in Fig. 2.
3 Spectral evolution
We have identified several absorption lines which clearly confirm the supernova as a Type Ia. During the observations the supernova increased its brightness, and the spectrum from Sep 5 is the brightest one in the blue region, while the red end is brightest at Sep 7 in accordance with the change of peak intensity with wavelength in Contardo et al. (2000).
Of particular interest is the prominent Si II 6347, 6371 Å (with a average of 6355 Å) absorption feature near the maximum of a Type Ia SN. The P Cygni profile of this line indicates large expansion velocities, which can be estimated from position of the blue edge of the absorption profile. As the photosphere expands, the absorption feature moves towards redder wavelengths as can be seen in Table 2. Correcting for the redshift of the host galaxy, the velocity evolution determined from the center of the Si II line changes from 12300 km s-1 on Aug 31 to 11200 km s-1 on Sep 7. Considering the very large range of expansion velocities of other Type Ia SNe of 10000–15000 km s-1 near the maximum (Branch et al. 1988), the expansion velocity of SN 2002er is normal for a bright SN. The blue shift of the Si II line could, however, also be caused by increasing metallicities of the progenitor (Lentz et al. 2000).
Different lines do not have identical velocities. We see for example that the Mg II line has larger velocities than Si II by roughly 2000 km s-1, which suggests a layered structure of the explosion products (Patat et al. 1996).
We have estimated the band magnitude by convolving the spectra with a transmission curve of the Bessell filter. The peak intensity in the band occurred between our last two spectra, i.e. on Sep 6, confirming the prediction of Smartt et al. (2002). At redder wavelengths the peak occurred later, see Table 2.
| date | min. | expansion | |||
|---|---|---|---|---|---|
| (Å) | (Å) | (km s-1) | |||
| Aug 31. | 6148 | 110 | 12300 | – | 15.52 |
| Sep 3. | 6159 | 118 | 11800 | 15.05 | 14.83 |
| Sep 5. | 6166 | 122 | 11500 | 14.76 | 14.61 |
| Sep 7. | 6172 | 122 | 11200 | 14.82 | 14.57 |
The three “notches” at 4550, 4650 and 5150 Å are visible in several Type Ia SNe spectra (Filippenko 1997). In Fig. 2 these features become more pronounced with time as transitions in Fe become more important. The two S II lines at 5300 and 5500 Å are almost of equal strength, which indicates that this SN was a bright event such as SN 1981B, however not as bright at the very luminous SN~1991T. In the fainter SNe the red line is much stronger than the blue (Nugent et al. 1995).
The ratio of the Si II absorption at 5972 Å to the 6355 Å feature increases with decreasing luminosity (Nugent et al. 1995). This ratio gives (Si II) for SN~2002er, a value typical for the most luminous Type Ia events. We do not see a significant evolution of this ratio with time.
The two narrow absorption features at 5900 Å have been identified as interstellar Na 5890 Å in the Milky Way and the host galaxy respectively.
3.1 UGC 10743: The host galaxy
The very flat spectrum of the host clearly shows H, H, [O III] 5007 Å, [S II] 6717, 6731 Å and [N II] 6583 Å emission lines redshifted by 256020 km s-1, see Fig. 3. These lines and the [O I] sky emission lines are subtracted from the spectra of the supernova. We have analysed the surface brightness distribution of the host on the A&G images, and detected no significant contribution from a bulge classifying the galaxy as an Sc type. This is in agreement with a flat spectrum, characteristic for late type galaxies, supporting that luminous SNe Ia are found in these galaxies (Hamuy et al. 1996).

4 Discussion and outlook
We estimate the absolute magnitude in the band M at the peak of the light curve taking into account the Galactic extinction of = 0.16 and using the Milky Way extinction curve from Seaton (1979). Including the extinction in the host the peak is at M. The average brightness of SNe Ia is M (Hillebrandt & Niemeyer 2000; Leibundgut 2001). The dispersion at maximum is (Hamuy et al. 1996). Thus SN 2002er was a fairly bright SN.
Together with the measurements of the outflow velocity, the absorption line strengths and the (Si II) ratio suggest that SN 2002er was a typical bright Type Ia SN, similar to other intrinsically bright SNe such as SN 1981B. This is also in agreement with the indication that brighter SNe are preferably found in late type galaxies, suggesting a range in progenitor properties (Hamuy et al. 1996). Further modeling is needed to determine abundances and late time spectra are necessary for calculating the bolometric luminosity as well as the explosively synthesized Ni mass.
With an integral field spectrograph one can get an accurate background estimate for later subtraction from the object spectrum. Specifically, removal of the contaminating host galaxy is better performed than with classical slit spectroscopy. The present observations make SN 2002er the second SN ever observed with an integral field unit. The first was the serendipitous discovery of SN~1998cf in NGC 3504 as reported by Emsellem (1998) and Garnavich (1998).
The standard candle nature of Type Ia SNe has been used to infer a non-zero cosmological constant (Riess et al. 1998; Perlmutter et al. 1999). Determining accurate spectrophotometric evolution of several subtypes of SNe Ia is essential for calculating the absolute peak magnitude, and thereby the distance to the cosmological SNe. One of the key problems is the correction of the flux by absorption of dust in the host galaxy. Detailed observations of nearby SNe with a dedicated integral field instrument, SNIFS (Aldering et al. 2002), will allow to disentangle the dust contents in the host from the intrinsic colour of the SNe, and then calibrate the more distant SNe. The future SNAP satellite (Deustua et al. 2000), will by means of detecting distant Type Ia SNe, determine cosmological parameters with a small uncertainty. Both projects will include IFSs in order to make use of the possibility for spatially resolved and simultaneous spectroscopy of the supernovae and their environments.
Our observations showed that PMAS is an efficient instrument for doing spectrophotometry of a point source especially with a high background contamination, and without slit losses. It was also demonstrated that the A&G camera can be used to perform differential photometry with field stars to increase the absolute spectrophotometric calibration under non-photometric conditions.
Acknowledgements.
L. Christensen acknowledges support by the German Verbundforschung associated with the ULTROS project, grant no. 05AE2BAA/4. S.F. Sánchez acknowledges the support from the Euro3D Research Training Network, grant no. HPRN-CT2002-00305. K. Jahnke and L. Wisotzki acknowledge a DFG travel grant under Wi 1369/12-1.References
- Aldering et al. (2002) Aldering, G., Adam, G., Antilogus, P., et al. 2002, SPIE, in press
- Barwig et al. (1987) Barwig, H., Schoembs, R., & Buckenmayer, C. 1987, A&A, 175, 327
- Becker (2001) Becker, T. 2001, PhD thesis, Astrophysikalisches Institut Potsdam, Germany
- Branch et al. (1988) Branch, D., Drucker, W., & Jeffery, D. J. 1988, ApJ, 330, L117
- Contardo et al. (2000) Contardo, G., Leibundgut, B., & Vacca, W. D. 2000, A&A, 359, 876
- Deustua et al. (2000) Deustua, S., Curtis, D., Goldhaber, G., et al. 2000, American Astronomical Society Meeting, 196
- Emsellem (1998) Emsellem, E. 1998, IAU Circ., 6914
- Falco et al. (1999) Falco, E. E., Kurtz, M. J., Geller, M. J., et al. 1999, VizieR Online Data Catalog, 611, 10438
- Filippenko (1997) Filippenko, A. V. 1997, ARA&A, 35, 309
- Garnavich (1998) Garnavich, P. 1998, IAU Circ., 6914, 1
- Hamuy et al. (1996) Hamuy, M., Phillips, M. M., Suntzeff, N. B., et al. 1996, AJ, 112, 2391
- Hillebrandt & Niemeyer (2000) Hillebrandt, W. & Niemeyer, J. C. 2000, ARA&A, 38, 191
- Kirshner et al. (1993) Kirshner, R. P., Jeffery, D. J., Leibundgut, B., et al. 1993, ApJ, 415, 589
- Leibundgut (2000) Leibundgut, B. 2000, A&ARv, 10, 179
- Leibundgut (2001) —. 2001, ARA&A, 39, 67
- Lentz et al. (2000) Lentz, E. J., Baron, E., Branch, D., Hauschildt, P. H., & Nugent, P. E. 2000, ApJ, 530, 966
- Nugent et al. (1995) Nugent, P., Phillips, M., Baron, E., Branch, D., & Hauschildt, P. 1995, ApJ, 455, L147
- Patat et al. (1996) Patat, F., Benetti, S., Cappellaro, E., et al. 1996, MNRAS, 278, 111
- Perlmutter et al. (1999) Perlmutter, S., Aldering, G., Goldhaber, G., et al. 1999, ApJ, 517, 565
- Phillips (1993) Phillips, M. M. 1993, ApJ, 413, L105
- Riess et al. (1998) Riess, A. G., Filippenko, A. V., Challis, P., et al. 1998, AJ, 116, 1009
- Roth et al. (2000) Roth, M. M., Bauer, S., Dionies, F., et al. 2000, in Proc. SPIE, Vol. 4008, 277–288
- Schlegel et al. (1998) Schlegel, D. J., Finkbeiner, D. P., & Davis, M. 1998, ApJ, 500, 525
- Seaton (1979) Seaton, M. J. 1979, MNRAS, 187, 73P
- Smartt et al. (2002) Smartt, S. J., Patat, F., Meikle, P., & Araujo, S. 2002, IAU Circ., 7961, 2
- Wood-Vasey et al. (2002) Wood-Vasey, W. M., Li, W. D., Swift, B., & Ganeshalingam, M. 2002, IAU Circ., 7959, 1