A SAURON view of galaxies
A SAURON view of galaxies
Abstract
We have measured the two-dimensional kinematics and line-strength distributions of 72 representative nearby early-type galaxies, out to approximately one effective radius, with our panoramic integral-field spectrograph SAURON. The resulting maps reveal a rich variety in kinematical structures and linestrength distributions, indicating that early-type galaxies are more complex systems than often assumed. We are building detailed dynamical models for these galaxies, to derive their intrinsic shape and dynamical structure, and to determine the mass of the supermassive central black hole. Here we focus on two examples, the compact elliptical M32 and the E3 galaxy NGC4365. These objects represent two extreme cases: M32 has very regular kinematics which can be represented accurately by an axisymmetric model in which all stars rotate around the short axis, while NGC4365 is a triaxial galaxy with a prominent kinematically decoupled core, with an inner core that rotates about an axis that is nearly perpendicular to the rotation axis of the main body of the galaxy. Our dynamical models for these objects demonstrate that two-dimensional observations are essential for deriving the intrinsic orbital structure and dark matter content of galaxies.
1 The SAURON project
The formation and evolution of galaxies is one of the most fundamental research topics in astrophysics. A key question in this field is whether early-type galaxies form very early in the history of the universe or are gradually built up by mergers and the infall of smaller objects. The answer to this problem is closely tied to the distribution of intrinsic shapes, the internal dynamics and linestrength distributions, and the demography of supermassive central black holes.
In the few past decades, it has become clear that ellipticals, lenticulars, and spiral bulges display a variety of velocity fields and linestrength distributions. Two-dimensional spectroscopy of stars and gas is essential when attempting to derive information on the intrinsic structure. For this reason, we have built a panoramic integral-field spectrograph, SAURON (bac+01 ), which provides large-scale two-dimensional kinematic and linestrength maps in a single observation.
We commissioned SAURON on the 4.2m William Herschel Telescope on La Palma in 1999. In low-resolution mode, the spectrograph combines a large field-of-view (3341′′) with a pixel size of 094. When the seeing conditions are good, the high-resolution mode, with a pixel size of 028, allows zooming in on galactic nuclei. SAURON observes in the spectral range of 4810–5340 Å, which contains the gaseous emission lines H and [OIII] and [NI], as well as a number of stellar absorption features (Mgb, Fe, H). The instrumental dispersion is 100 km/s. Between 1999 and 2002, we have used SAURON to observe a carefully-selected representative sample of 72 ellipticals, lenticulars and Sa bulges, distributed over a range of magnitudes, ellipticities, morphologies and environments (zbe+02 ).
We have finalized the data reduction, have accurately separated the emission- and absorption lines, have calibrated the line-strength measurements, and have in hand maps of the stellar and gaseous kinematics and linestrengths for all 48 E and S0 objects, with those for the spirals to follow soon. The maps reveal many examples of minor axis rotation, decoupled cores, central stellar disks, non-axisymmetric and counter-rotating gaseous disks, and unusual line-strength distributions (bcc+02 ; zbe+02 ). We have also developed new methods to spatially bin the data cubes to a given signal-to-noise (cc03 ), and to quantify the maps with Fourier methods (cbb+01 ; sfz97 ). This allows accurate measurements of, e.g., the opening angle of the isovelocity contours and of the angle between the direction of the zero-velocity contour and the minor axis of the surface brightness distribution (cbb+01 ), enabling various statistical investigations of the entire sample of objects.
2 Dynamical Models
We are constructing detailed dynamical models which fit all kinematics and eventually even observations of the stellar line-strengths of the galaxies in the SAURON survey. We do this by means of Schwarzschild’s (sch79 ) orbit superposition method, which was originally developed to reproduce theoretical density distributions (e.g., mf96 ; pm02 ; sch79 ; sch93 ; sk00 ), and was subsequently adapted to incorporate observed kinematic data in spherical and axisymmetric geometry (czm+99 ; grt+03 ; mcz+98 ; rzc+97 ). We have implemented a number of further extensions including the ability to deal with a Multi-Gaussian Expansion of the surface brightness distribution (cvm+02 ; emb94 ; mbe92 ). We have also shown that the large data sets that are provided by instruments such as SAURON can be modelled without any problems (vcc+02 ).
Recently, we completed the non-trivial extension to the software that allows inclusion of kinematic measurements in triaxial geometry (vcz03 ). As in the axisymmetric case, observational effects such as pixel binning and point-spread-function convolution are taken into account. The chaotic orbits are dealt with in the ‘standard’ way (see thz01 ), and the line-of-sight velocity profile is used to constrain the models. In the next two sections, we describe two applications in more detail, one in axisymmetry and the other for a triaxial intrinsic shape.
3 Axisymmetric models for M32
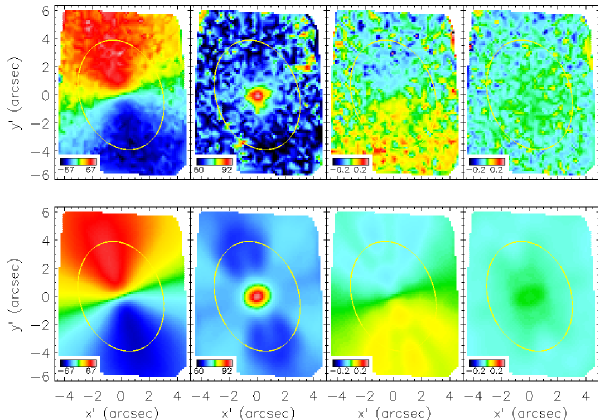
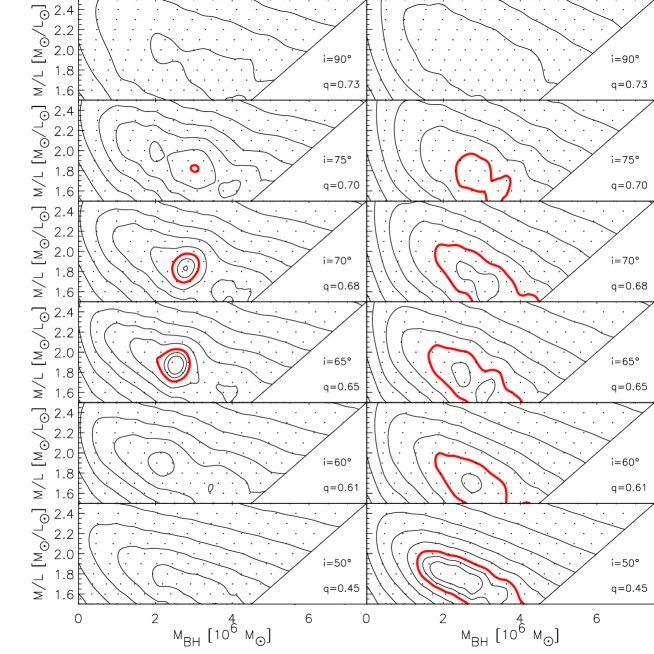
We applied our axisymmetric modeling software to the nearby compact E3 galaxy M32 (vcc+02 ). By complementing the SAURON maps (Figure 1) with high-resolution major axis stellar kinematics taken with STIS (jmo+01 ), the models are constrained at both small and large radii, which allows us to measure an accurate central black hole mass , stellar mass-to-light ratio , and inclination . The left panels of Figure 2 show the dependence of , which is a measure of the discrepancy between model and data, on , (in solar units, for the -band) and . The inner three contours show the formal 1, 2 and 3-confidence levels for a distribution with three degrees of freedom. The black hole mass and mass-to-light ratio are constrained tightly at and , and the inclination is constrained to a value near . The right panels of the same figure show similar contours, but now for a data-set consisting of the STIS-kinematics together with four slits extracted from the SAURON-data. In this case the constraints on all three parameters, but most notably on the inclination, are much less stringent. This demonstrates that two-dimensional observations are essential to gain insight into the intrinsic structure of galaxies.
4 The triaxial galaxy NGC 4365
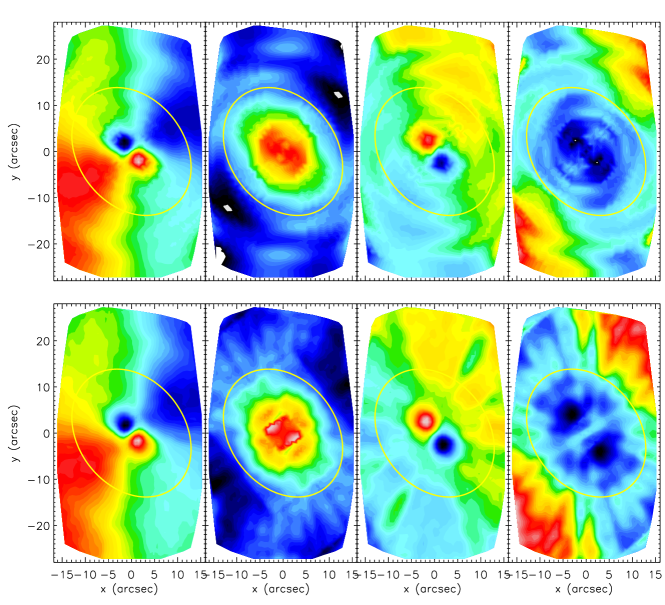
The upper panels of Figure 3 show the stellar kinematics in the central of the giant elliptical galaxy NGC4365, derived from two SAURON pointings (dke+01 ). The velocity field clearly shows a prominent decoupled core in the inner (cf. sb95 ). It has a rotation axis which lies away from that of the body of the galaxy, which rotates around its long axis. Such a structure is possible when the shape is intrinsically triaxial because of the presence of orbits that have net mean streaming around either the long or the short axis.
The globular cluster system of NGC 4365 shows evidence for an intermediate age population (pzk+02 ). The SAURON linestrength maps, however, indicate a predominantly old stellar population (dke+01 ), suggesting that the observed kinematic structure may have been in place for over 12 Gyr and the galaxy is in stable triaxial equilibrium. We therefore applied our developed modeling software to this case, to investigate whether it is possible to reproduce all the kinematic data in detail, and to constrain and the intrinsic shape and orbital structure.
We represented the observed surface brightness distribution of NGC 4365 by a Multi-Gaussian Expansion which accurately fits the observed radial variation of ellipticity, the boxyness of the isophotes, and the modest isophotal twisting. We derived the deprojected density by assuming that each of the constituent Gaussian components is stratified on similar concentric triaxial ellipsoids. The three Euler angles that specify the orientation of the ellipsoids can be chosen freely. For each choice, we computed a library of 4000 orbits, obtained from 20 energy shells with 200 orbits each, covering the four major orbit families, and including orbits from minor families and chaotic orbits. As the spatial resolution of the SAURON measurements is modest, we did not consider the effect of a central black hole. The preliminary results indicate that the quality-of-fit parameter varies quite significantly with and the parameters defining the intrinsic shape. The lower panels of Figure 3 show the predictions of one model that fits the data well. This illustrates that the software works, and shows that NGC 4365 is indeed consistent with a triaxial equilibrium shape.
In principle, best-fit values of the shape parameters, the direction of observation, and the mass-to-light ratio can be determined by a systematic investigation of the parameter space, just as was done for M32. For triaxial systems this is a very time-consuming effort, but a first-order guess of the galaxy parameters can be obtained by using other, simpler, schemes (see, e.g., sta94a ; sta94b ; vhv+03 ). Our detailed dynamical modeling software can then be used to explore this more restricted parameter range. Work along these lines is in progress, and will make it possible to deduce, e.g., the intrinsic properties of the kinematically decoupled cores seen in many of these systems. Inclusion of higher spatial resolution data will allow accurate measurement of the mass of the central black hole.
5 Concluding remarks
We have presented two examples of recent results from our program to construct detailed axisymmetric and triaxial dynamical models for galaxies in the SAURON representative survey of nearby ellipticals, lenticulars and Sa bulges. The panoramic SAURON observations tighten the constraints on the possible orientation of a galaxy considerably. The extension of the modeling software to triaxial shapes including kinematic constraints works, and that it will help us gain significant insight into the structure of early-type galaxies.
References
- (1) Bacon R., et al., 2001, MNRAS, 326, 23
- (2) Bureau M., et al., 2002, in ASP Conf. Ser., 273, 53
- (3) Cappellari M., et al., 2002, ApJ, 578, 787
- (4) Cappellari M. & Copin Y., 2003, MNRAS, in press
- (5) Copin Y. et al., 2001, EDPS Conf. Ser. in Astron. & Astrophys., eds F. Combes, D. Barret, F. Thévenin, 289 (astro-ph/0109085)
- (6) Cretton N., de Zeeuw P.T., van der Marel R.P., Rix H.–W., 1999, ApJS, 124, 383
- (7) Davies R.L., et al., 2001, ApJ, 548, L33
- (8) Emsellem E., Monnet G., Bacon R., 1994, A&A, 285, 739
- (9) Gebhardt K., et al., 2003, ApJ, in press (astro-ph/0209483)
- (10) Joseph C.L., et al., 2001, ApJ, 550, 668
- (11) van der Marel R.P., Cretton N., de Zeeuw P.T. & Rix H.-W., 1998, ApJ, 493, 613
- (12) Merritt D., Fridman T., 1996, ApJ, 460, 136
- (13) Monnet G., Bacon R., Emsellem E., 1992, A&A, 253, 366
- (14) Poon M.Y., Merritt D., 2002, ApJ, 568, 89
- (15) Puzia T., Zepf S.E., Kissler–Patig M., Hilker M., Minniti D., Goudfrooij P., 2002, A&A, 391, 453
- (16) Rix H., de Zeeuw P.T., Cretton N., van der Marel R.P., Carollo C.M., 1997, ApJ, 488, 702
- (17) Schoenmakers R.H.M., Franx M., de Zeeuw P.T., 1997, MNRAS, 292, 349
- (18) Schwarzschild M., 1979,, ApJ, 232, 236
- (19) Schwarzschild M., 1993, ApJ, 409, 563
- (20) Siopis C., Kandrup H. E., 2000, MNRAS, 319, 43
- (21) Statler T.S., 1994a, ApJ, 425, 458
- (22) Statler T.S., 1994b, ApJ, 425, 481
- (23) Surma P. & Bender R., 1995, A&A, 298, 405
- (24) Terzic B., Hunter C., de Zeeuw P.T., 2001, in Stellar Dynamics: from Classic to Modern, eds L.P. Osipkov & I.I. Nikiforov, (St. Petersburg State University, Russia), 303
- (25) van de Ven G., Hunter C., Verolme E.K., de Zeeuw P.T., 2003, MNRAS, submitted
- (26) Verolme et al., 2002, MNRAS, 335, 517
- (27) Verolme E.K., Cappellari M., van de Ven, G., de Zeeuw P.T., 2003, MNRAS, submitted
- (28) Verolme E.K., et al. 2003, in prep.
- (29) de Zeeuw et al., 2002, MNRAS, 329, 513