One Ring to Encompass them All:
A giant stellar structure that surrounds the Galaxy
Abstract
We present evidence that the curious stellar population found by the Sloan Digital Sky Survey in the Galactic anticentre direction extends to other distant fields that skirt the plane of the Milky Way. New data, taken with the INT Wide Field Camera show a similar population, narrowly aligned along the line of sight, but with a Galactocentric distance that changes from to (over on the sky). Despite being narrowly concentrated along the line of sight, the structure is fairly extended vertically out of the plane of the Disk, with a vertical scale height of . This finding suggests that the outer rim of the Galaxy ends in a low-surface brightness stellar ring. Presently available data do not allow us to ascertain the origin of the structure. One possibility is that it is the wraith of a satellite galaxy devoured long-ago by the Milky Way, though our favoured interpretation is that it is a perturbation of the disk, possibly the result of ancient warps. Assuming that the Ring is smooth and axisymmetric, the total stellar mass in the structure may amount to up to .
keywords:
Galaxy: structure – Galaxy: disk – galaxies: interactions1 Introduction
Due to our location within the disk of the Milky Way, studies of the global structure of this galactic component are hampered by projection problems, crowding, dust, and the presence of intervening populations (such as the Bulge). Nowhere is this so problematic as in the study of the very outer edge of the disk. The advent of the recent wide-area infra-red surveys (e.g. 2MASS and DENIS) have alleviated the extinction problem, but the other problems remain, with the distance ambiguity being particularly limiting. Even the future astrometric mission GAIA (Perryman et al., 2001) is unlikely to give us a full picture of the Galactic disk, due to telemetry limits in regions of high stellar density.
Yet the outer regions of galactic disks are important regions to study, as they provide important clues to our understanding of the global structure and formation of galaxies (see, e.g., van der Kruit, 2001). These are the least self-gravitating regions of galactic disks, and the presence of the dark matter halo can begin to be felt at these radii. The flaring of the outer disk constrains the dark matter fraction in these regions (Olling & Merrifield, 2000, and references therein). Perhaps the most interesting aspect of the very outermost edge of the disk is that it is expected to be young. In galaxy formation simulations that contain a gas component as well as Cold Dark Matter, galaxy disks tend to grow from the inside out, with the most recently accreted gas settling down onto the end of the disk (Navarro & Steinmetz, 1997). Ensuing star-formation in regions of sufficient density produces young stars, leading to a primarily young, metal-poor stellar population in these galactic extremities, though radial mixing in the disk may smear this information out (Sellwood & Binney, 2002). However, recent simulations (Sommer-Larsen, Gotz & Portinari, 2002) show that some disks form outside-in as well as inside-out, in agreement with tantalising new evidence that indicates that the outer disk of the Andromeda galaxy may well be old (Ferguson & Johnson, 2001). Determining the age of disk populations at large radius will provide a good test of current disk formation models.
An interesting recent development in the study of the stellar populations of the outer disk has been presented by Newberg et al. (2002), based on Sloan Digital Sky Survey photometry of fields towards the Galactic anticentre direction. Newberg et al. (2002) find an overdensity of F-colored stars close to the Galactic plane in the constellation “Monoceros”, with a narrow colour-magnitude sequence that belies a stellar population from the Sun and from the Galactic centre. The narrow magnitude spread implies a distance spread of about , despite the fact that the structure is seen over a wide range above and below the Galactic plane stretching from to (i.e. ).
The analysis of Newberg et al. (2002) suggested that this stellar population was a very nearby orbiting Galactic satellite. Here we present evidence of similar color-magnitude features in fields taken as part of a survey of the Andromeda galaxy with the Isaac Newton Telescope (INT), and as part of a public survey observed with the same telescope entitled the INT Wide Field Survey (WFS).
2 The Isaac Newton Telescope Wide Field Camera Surveys
The INT WFS is an initiative by the UK and Dutch communities to devote a large fraction of the INT to deep and wide-field surveys. Many fields have now been observed since 1998. However, the resulting coverage at the present time is patchy, with most time having been spent in large extragalactic surveys towards the Galactic polar caps. Table 1 is a listing of suitable WFS or WFC observations below . In Figure 1 we display an example of one of these fields, the Elais field N1, located at , , which shows the normal Galactic stellar population sequences. In contrast, Newberg et al. (2002) have shown that the anticentre (“Monoceros”) region shows an additional feature in colour-magnitude space (their Figure 12), with shape similar to a main sequence that has a turnoff at , (in the AB system).

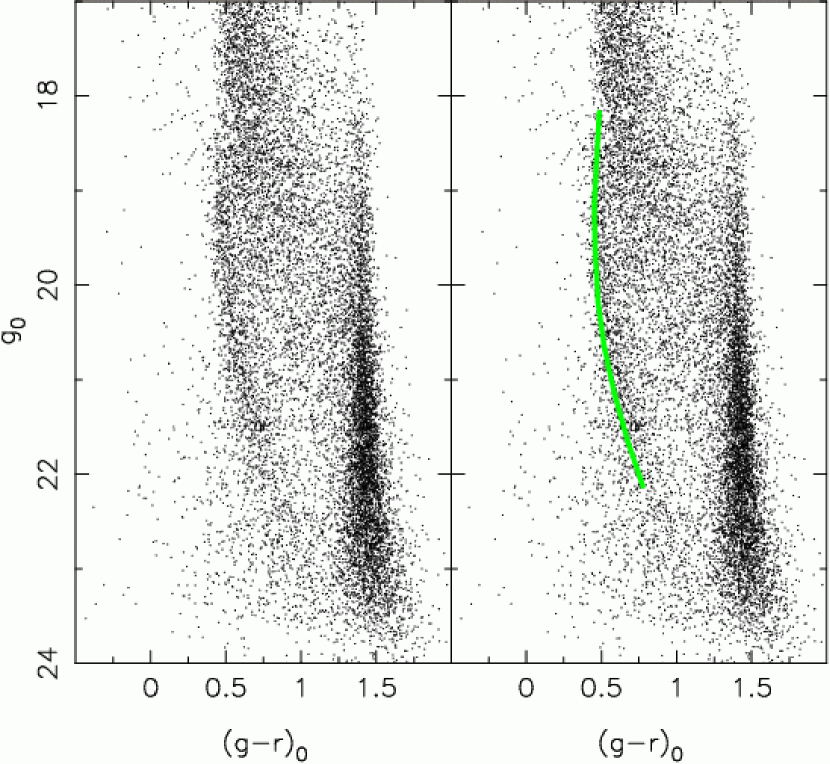
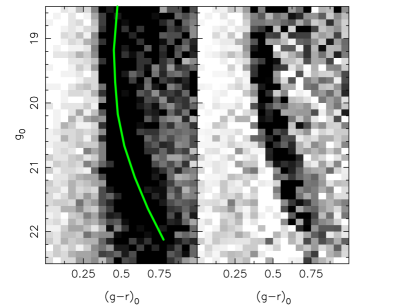
In examining INT WFC survey fields, we have detected the presence of this unexpected feature in other distant fields. Figure 2 displays the colour-magnitude diagram of the INT WFC field “Mono-N” (located at , ); a population that follows a track similar to a narrow-main sequence is seen in addition to the usual Galactic components. This sequence is shown more clearly in the right-hand panel of Figure 3, in which we have used the Elais-N1 field as a “background” to subtract off the normal Galactic components. Due to the difference in Galactic latitude between the target and control fields, the thick disk is not subtracted cleanly: this poor subtraction of the thick disk is seen as a smear to brighter magnitudes and redder colours than the narrow sequence that delineates the abrupt faint end of the right hand panel of Figure 3. Another INT WFS field that displays this excess population is the field named WFS-0801 (, ), the colour-magnitude diagram of which is displayed in Figure 4. Subtracting a background estimated from the Elias-N1 field gives the Hess diagram displayed on the right-hand panel of Figure 5. As the “background” field is closer in Galactic latitude to the WFS-0801 field, this statistical subtraction is much cleaner, allowing us to show the unexpected excess population relatively free of contamination from the expected Galactic components.


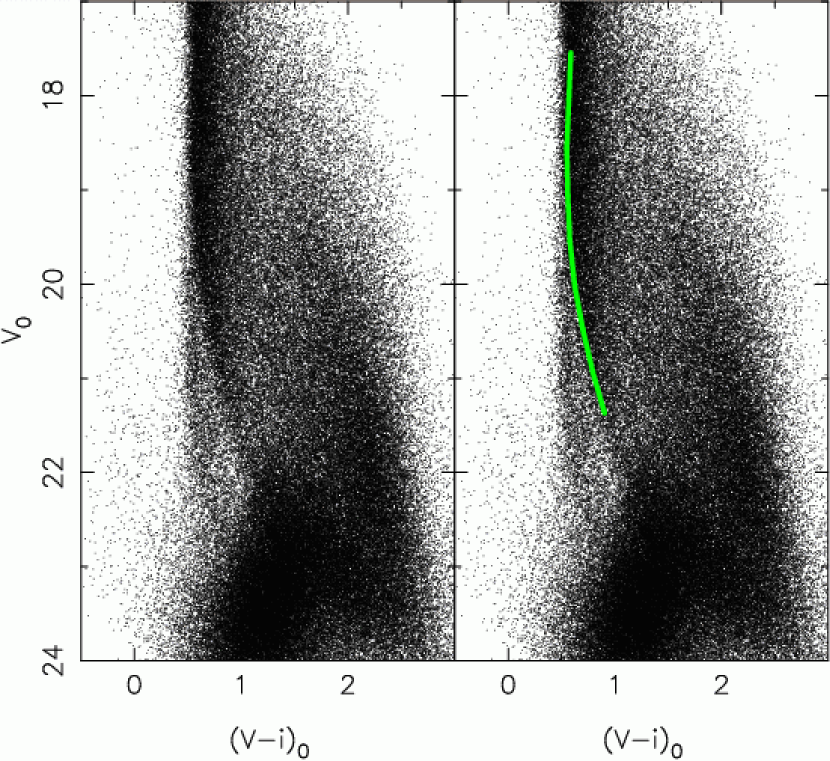
The other two proprietary large surveys (Ibata et al., 2001; Ferguson et al., 2002, 2003) were conducted by our group to reveal the structure and stellar populations in the halo of the Andromeda galaxy (, ) and M33 (, ). A further two fields were observed for use as comparison regions for these surveys. Table 1 also lists these fields. In Figures 6 and 8 we display the , , colour-magnitude diagram in our M31 survey, where we have plotted separately the northern (lower ) and southern quadrants of the survey. The CMD structure seen in the SDSS “Monoceros” field is also observed in our 30 square-degree field around M31. The left-hand panel of Figure 7 shows the Hess diagram of the northern M31 field (note that this is a zoomed-in view of Figure 6). Lacking an appropriate background field in and pass-bands, we have been forced to use the southern M31 field as a comparison region. The result of subtracting the southern M31 field from the northern M31 field is displayed in the right-hand panel of Figure 7; the excess population is again clearly seen as a narrow sequence.


The high statistical significance of the detection of the excess population in the different fields is demonstrated in Figure 9, where we show the distribution of stars as a function of their displacement in colour from the ridge-lines. Due to the lack of a suitable background field, we are unable to provide a similar estimate of the significance of the detection in the southern M31 field, though the population is clearly present in that field, as we show in Figure 10.

3 Results and Conclusions
The detection of a stellar population almost identical to that seen in the SDSS Monoceros fields shows that this structure is immense. The M31 field is away in longitude from the S223+20 field, towards the diametrically opposite side of the Galaxy. The structure is also seen both below the Galactic plane (in the M31 field and in S200-24) and above it (in fields Mono-N, WFS-0801, S183+22, S218+22, and S223+20), covering a vertical range of more than . The fields at higher Galactic latitude than did not show up a similar CMD feature, and neither was the feature detected in the lower latitude () M33 field. The structure appears to be confined close to the Galactic plane.
To investigate the difference in Heliocentric distance between the fields, we compared the colour-magnitude sequence detected by Newberg et al. (2002) in the S223+20 field to the three INT fields Mono-N, WFS-0801, and M31. Due to the difference in the photometric systems between the surveys, conversions need to be made to shift measurements in the SDSS (g’,r’) system to Vega-normalized (g,r) and (V,i). For the (g,r) fields we used an South Galactic Pole region where there are overlapping INT and SDSS data (the latter from the Early Data Release, Stoughton et al., 2002); we find and . The resulting transformed track of the S223+20 field requires an offset of to match the Mono-N and WFS-0801 fields (i.e. stars in the Mono-N and WFS-0801 features are brighter). To convert to (V,i) we took (Windhorst et al., 1991), and used the WFS photometry in the WFS-2240 field to find the following necessary transformation: . The offset of the S223+20 ridge-line was found to be for the northern M31 field (the feature in the southern M31 field has too low S/N to fit). Assuming that the S223+20 feature is distant (Newberg et al., 2002), and interpreting these magnitude offsets as due to distance variations, puts the structure in the Mono-N, WFS-0801 and M31 fields at a distance of , and respectively. The corresponding Galactocentric distances, in order of increasing Galactic longitude 111Please note that the photometric conversions, especially the extrapolation from (g’,r’) on the AB system to (V,i) on the Vega system, may have significant systematic errors. The estimated distances are therefore only indicative., are: in M31 (at ), in Mono-N (at ), in WFS-0801 (at ), and in S223+20 (at ).
The substantial area of our M31 field allows a first estimation of the scale-height of this unexpected population. To this end we selected stars in a banana-shaped region between and . The density of these sources is displayed as filled circles in Figure 10, and shows a rapid rise towards the Galactic plane. After subtracting a “background” level measured from the same colour-magnitude region in the M33 field (), we performed a straight-line fit to the logarithm (base-ten) of the counts per square degree, which yields a slope of per degree of Galactic latitude. Taking the distance of derived above, this implies a scale height of . The open circles in Figure 10 show a similar selection, just slightly bluer, which picks out Galactic halo stars. In contrast, this second selection gives an almost flat distribution, consistent with our preconceptions of the Halo as an almost spherically-distributed component.

The nature of this structure remains a puzzle. It is clear that it cannot be related to the normal thin disk, as it lies several magnitudes below the expected thin disk sequence. The rapid decline in the density of the feature away from the Galactic plane also rules out a direct connection to the halo. This leaves the thick disk as the only normal Galactic option. We used the Galaxy starcounts model of Ibata (1994) to predict the , V colour-magnitude diagram of the thick disk in all of the fields investigated ( colours are close to ). For the thick disk, we find that the spread in V magnitude at constant colour has a FWHM exceeding 3 magnitudes in all of our fields (we chose to sample 0.05 magnitudes about which gives the minimum spread in magnitude). The detected feature therefore cannot be the standard thin disk, halo or even thick disk, in agreement with Newberg et al. (2002). Several possibilities present themselves:
-
i.
One option is that the various surveys probe small areas of a gigantic ring that encompasses the disk. The ring has a radius of –, a radial thickness of , and a vertical scale height of . Due to the presence of the Magellanic Clouds and the Sagittarius dwarf galaxy, the ring is warped and non-circular, explaining the variation in Galactocentric radius between some of the survey fields. The stellar mass of the structure can be estimated by taking the surface density in the M31 field as representative of the whole ring, and assuming axisymmetry and some vertical profile. If the vertical profile is exponential, as is suggested by the data displayed in Figure 10, we find that the total stellar mass of the structure is , whereas if the surface density remains constant below , the mass is (for these estimates we have taken the luminosity function of Jahreis & Wielen 1997 and the mass-luminosity relation of Henry & McCarthy 1993). A possible mechanism to form such a ring may be repeated warpings of the outer disk. In the Andromeda Galaxy (seen almost edge-on), the outer stellar disk has a complicated non-axisymmetric shape (Ferguson et al., 2002), with large vertical deviations suggestive of ancient warps which now no longer follow the warp seen in the gas. The possible Ring seen in the outer disk of the Milky Way may be of similar origin. One would expect such structures to eventually mix entirely, leaving a flared outer disk, rather than a radially thin ring. Either there is another factor at play, such as, for instance, a strong interaction with the Sagittarius dwarf galaxy (Ibata & Razoumov, 1998) or the Magellanic Clouds (e.g., Tsuchiya, 2002), or the ring is a recent phenomenon (note however, that the stellar constituents could be older than the structure). If the structure is a perturbation, the wave may have been amplified to the current large vertical extent (in the manner of a whip) in passing outwards through the disk to regions of progressively lower density.
The low-latitude HVC field (Lewis et al., 2002), located at (, ), is not in contradiction with the interpretation of the structure as a Galactic ring. Assuming that the ring has a radius of , implies a distance of in this direction, more than twice the distance to the fields in which the “Monoceros”-like CMD structure has been detected. The HVC field may simply lie too far below the Galactic plane (in that direction) to detect the Ring (the field also covers a relatively small solid angle of sky).
The reason the Ring may not have been discovered before is due to its low surface density. Very large areas need to be surveyed to detect it. It would also be difficult to detect with, for instance, the poorer photometry available from photographic plates.
-
ii.
Another possibility is that the surveys probe different regions of the disrupted tidal stream of an accreted satellite galaxy. Halo satellites are expected to have high eccentricity orbits, with apocentre to pericentre ratio of (van den Bosch et al., 1999). For sufficiently massive satellites (), the continual braking effect of dynamical friction with the Galactic halo and disk can eventually lead to the decay of the orbit. However, simulations show that satellite orbits are not readily circularized by dynamical friction (van den Bosch et al., 1999; Colpi, Mayer & Governato, 1999), so it is hard to explain the near circular orbit required by this scenario. A second problem relates to the small distance spread along the line of sight. As the orbit of the satellite decays, constituent stars will be lost by tidal disruption. Over time, the tidally removed stars become phased-mixed, spreading out over the orbit, and occupying the region between the orbit pericentre and apocentre. The fact that the “Monoceros”-like population is seen confined in a narrow distance interval along the line of sight therefore also argues against this scenario. The problem may be alleviated if the progenitor satellite disrupted only recently. A further concern with this scenario comes from the disruptive effect of the satellite on the Milky Way. Current cosmological simulations suggest that galaxy satellites have their own massive dark matter mini-haloes (Stoehr et al., 2002), a possibility that is supported by the high mass to light ratios inferred from small Galactic dwarf spheroidals (Mateo, 1998), and from the survival requirement of the Sgr dwarf galaxy (Ibata et al., 1997; Ibata & Lewis, 1998). Including the dark matter halo of a satellite that has a stellar mass in the range to increases significantly the potential damage to the disk of the Milky Way, and raises the question of whether the thin disk would survive such an encounter (see, e.g., Tóth & Ostriker, 1992; Velazquez & White, 1999).
-
iii.
Another possibility is that we are seeing part of an outer spiral arm, or various arm fragments. Davies (1972) has identified a variety of spiral features in the outer Galaxy via 21cm emission, extending out to a radius of . Many of these structures lie in directions where we have also detected an anomalous stellar component, leading one to speculate if these could be associated stellar arms. Indeed, if an underlying global mode were responsible for driving the spiral structure, it would not be unexpected to find an older stellar population tracing out the same pattern as the gas (e.g. Rix & Rieke, 1993; Thornley & Mundy, 1997). The narrow line-of-sight thickness of the structures stands in favour of this hypothesis. The thickness of the stellar component may be problematic for the spiral arm hypothesis however, although one might be able to appeal to warping to bring the bulk of the stars out of the plane.
-
iv.
The beating motion of an asymmetric Galactic component (such as the bar) induces resonances in the disk component. However, these resonances occur very close to the plane of the disk, and stars with significant vertical motions are unlikely to partake in a strong resonance. It seems implausible, therefore, that a resonance is the cause of the detected structure.
The photometric information presented here is not sufficient to discriminate between the first three scenarios. Further photometry, especially at low Galactic latitude will be invaluable if we are to be able to properly follow the structure, and ascertain whether it is a Galactic Ring, an inhomogeneous mess due to ancient warps and disturbances, or part of a disrupted satellite stream. If this manifestly old population turns out to be the outer stellar disk, it will pose a very interesting challenge to galaxy formation models that predict inside-out assembly. Alternatively, if it transpires that the structure is due to a disrupted satellite whose orbit has been circularised and accreted along with its cargo of dark matter onto the Disk, it will provide a unique first-hand opportunity to understand the effect of massive accretions on to the inner regions of galaxies.
References
- van den Bosch et al. (1999) van den Bosch, F., Lewis, G., Lake, G., Stadel, J. 1999, ApJ 515, 50
- Colpi, Mayer & Governato (1999) Colpi, M., Mayer, L., Governato, F. 1999, ApJ 525, 720
- Davies (1972) Davies, R. 1972, MNRAS 160, 381
- Ferguson & Johnson (2001) Ferguson, A., Johnson, R. 2001, ApJ 559L, 13
- Ferguson et al. (2002) Ferguson, A., Irwin, M., Ibata, R., Lewis, G., Tanvir, N. 2002, AJ 124, 1452
- Ferguson et al. (2003) Ferguson, A., Irwin, M., Ibata, R., Lewis, G., Tanvir, N. 2003, in preparation
- Henry & McCarthy (1993) Henry, T., McCarthy, D., 1993, AJ 106, 773
- Ibata (1994) Ibata, R. 1994, PhD Cambridge
- Ibata et al. (1997) Ibata, R., Wyse, R., Gilmore, G., Irwin, M. & Suntzeff, N. 1997, AJ 113, 634
- Ibata & Lewis (1998) Ibata, R., Lewis, G. 1998, ApJ 500, 575
- Ibata & Razoumov (1998) Ibata, R. & Razoumov, A. 1998, A&A 336, 130
- Ibata et al. (2001) Ibata, R., Irwin, M., Lewis, G., Ferguson, A., Tanvir, N. 2001, Nature 412, 49
- Jahreis & Wielen (1997) Jahreis, H. & Wielen, R. 1997, in: B. Battrick, M.A.C. Perryman and P.L. Bernacca (eds.): HIPPARCOS ’97. Presentation of the Hipparcos and Tycho catalogues and first astrophysical results of the Hipparcos space astrometry mission, Venice, Italy, 13-16 May(1997); ESA SP-402, Noordwijk, p.675-680
- van der Kruit (2001) van der Kruit, P. C. 2001, ASP Conf. Ser. 230: Galaxy Disks and Disk Galaxies, 119
- Lewis et al. (2002) Lewis, G., Irwin, M., Ibata, R., Gibson, B. 2002, PASA 19, 257
- Mateo (1998) Mateo, M. 1998, ARA&A, 36, 435
- Navarro & Steinmetz (1997) Navarro, J., Steinmetz, M. 1997, ApJ 478, 1328
- Newberg et al. (2002) Newberg, H., et al. 2002, ApJ
- Olling & Merrifield (2000) Olling, R., Merrifield, M. 2000, MNRAS 311, 361
- Perryman et al. (2001) Perryman, M., de Boer, K., Gilmore, G., Høg, E., Lattanzi, M., Lindegren, L., Luri, X., Mignard, F., Pace, O., de Zeeuw, P. 2001, A&A 369, 339
- Rix & Rieke (1993) Rix, H.-W., Rieke, M. J. 1993, ApJ 418, 123
- Sellwood & Binney (2002) Sellwood, J., Binney, J. 2002, MNRAS 336, 785
- Schlegel et al. (1998) Schlegel, D., Finkbeiner, D., Davis, M. 1998, ApJ 500, 525
- Sommer-Larsen, Gotz & Portinari (2002) Sommer-Larsen, J., Gotz, M., Portinari, L. 2002, astro-ph/0204366
- Stoehr et al. (2002) Stoehr, F., White, S., Tormen, G., Springel, V. 2002, MNRAS 335, L84
- Stoughton et al. (2002) Stoughton, C. et al. 2002, AJ 123, 485
- Tóth & Ostriker (1992) Tóth, G., Ostriker, J. 1992, ApJ 389, 5
- Thornley & Mundy (1997) Thornley, M. D., Mundy, L. G. 1997, ApJ 490, 682
- Tsuchiya (2002) Tsuchiya, T. 2002, New A. 7, 293
- Velazquez & White (1999) Velazquez, H., White, S. 1999, MNRAS 304, 254
- Windhorst et al. (1991) Windhorst, R., Burstein, D., Mathis, D., Neuschaefer, L., Bertola, F., Buson, L., Koo, D., Matthews, K., Barthel, P., Chambers, K. 1991, ApJ 380, 362
| Field | RA (J2000) | Dec (J2000) | b | Area (sq. deg.) | Bands | Detection? | |
|---|---|---|---|---|---|---|---|
| Equatorial survey | 22 to 3 | 0:00 | 60 to 180 | -40 to -60 | g,r | NO | |
| WFS-2240 | 22:40 | +0:00 | 69 | -48 | 9.0 | g,r | NO |
| Elais-N1 | 16:13 | +55:16 | 85 | +44 | 9.0 | g,r | NO |
| Elais-N2 | 16:36 | +41:01 | 64 | +41 | 9.0 | g,r | NO |
| M33 | 1:34 | +30:40 | 134 | -31 | 4.8 | V,i | NO |
| WFS-0801 | 08:02 | +40:19 | 180 | +30 | 7.0 | g,r | |
| M31 comparison 2 | 23:50 | +35 | 109 | -26 | 1.2 | V,i | NO |
| S200-24 222SDSS field, Newberg et al. (2002) | 5:00 | +0:00 | 199 | -25 | g’,r’ | YES | |
| M31-S | 0:43 | +38:45 | 122 | -24 | 8.25 | V,i | YES |
| S183+22 a | 7:22 | +35 | 183 | +22 | g’,r’ | YES | |
| S218+22 a | 8:16 | +6 | 218 | +22 | g’,r’ | YES | |
| M31 comparison 1 | 22:27 | +31 | 90 | -21 | 1.2 | V,i | PERHAPS |
| M31-N | 0:47 | +43:22 | 123 | -19 | 6.5 | V,i | |
| Mono-N | 6:03 | +64:43 | 149 | +20 | 1.2 | g,r | |
| S223+20 a | 8:00 | +0:00 | 221 | +15 | g’,r’ | YES | |
| HVC 333Based on AAT WFI data, Lewis et al. (2002) | 17:13 | -64:38 | 327 | -15 | 0.25 | g,r | NO |