Hubble Space Telescope and Ground-Based Optical and Ultraviolet Observations of GRB 010222
Abstract
We report on Hubble Space Telescope WFPC2 optical and STIS near ultraviolet MAMA observations, and ground-based optical observations of GRB 010222, spanning 15 hrs to 71 days. The observations are well-described by a relativistic blast-wave model with a hard electron-energy distribution, , and a jet transition at days. These values are slightly larger than previously found as a result of a correction for the contribution from the host galaxy to the late-time ground-based observations and the larger temporal baseline provided by the Hubble Space Telescope observations. The host galaxy is found to contain a very compact core (size ) which coincides with the position of the optical transient. The STIS near ultraviolet MAMA observations allow for an investigation of the extinction properties along the line of sight to GRB 010222. We find that the far ultraviolet curvature component is rather large. In combination with the low optical extinction mag, when compared to the Hydrogen column inferred from X-ray observations, we suggest that this is evidence for dust destruction.
1 Introduction
1.1 GRB 010222
On February 22, at 7:23:30 UT (2001) the bright GRB 010222, was observed by the BeppoSAX Wide Field Camera #1 (WFC; Piro 2001a). Within the 25 error radius an optical transient counterpart was identified at 14h52m1255, +43∘01062 (J2000; with an uncertainty of 02) (Henden, 2001a; Henden & Vrba, 2001; McDowell et al., 2001). Soon this was followed by detections at X-ray (Piro, 2001b), mm (Fich et al., 2001) and radio (Berger & Frail, 2001) wavelengths.
Absorption lines yielded a redshift of (Garnavich et al., 2001; Jha et al., 2001; Bloom et al., 2001; Castro et al., 2001; Masetti et al., 2001) for the highest redshift absorber. This system shows kinematic substructure, with two distinct systems at and , corresponding to a restframe velocity separation of 106 km s-1, typical for internal motions in galaxies (Castro et al., 2001). The equivalent widths of the lines are unusually strong in comparison to metallic line absorbers seen in the spectra of quasars, indicating a high column density of gas, either suggesting a star-forming region environment or that the GRB occurred in the disk of the galaxy (or both). The highest redshift absorber is therefore likely the host galaxy of the GRB itself (Jha et al., 2001). In addition two foreground absorbing systems are detected (Bloom et al., 2001; Castro et al., 2001). These systems are typical for the metallic line absorbers at comparable redshifts. Further analysis of the two foreground absorbing systems is reported in Mirabal et al. (2002) and Salamanca et al. (2002). Frail et al. (2002) detected excess submillimeter emission toward GRB 010222 which they interpret as originating from a starburst host galaxy with SFR500 M⊙ yr-1, much of which is obscured at optical wavelengths.
Optical observations have been presented by Cowsik et al. (2001), Lee et al. (2001), Masetti et al. (2001), Sagar et al. (2001), and Stanek et al. (2001). Although there is good agreement among these authors that the optical light curves exhibit an achromatic break about 0.5 days after the burst, no consensus has been reached regarding the origin of this steepening. Several authors have interpreted the optical afterglow in terms of the standard relativistic blast wave model (Sari et al., 1998). In this case the break results from a collimated (jetted) outflow (Sari et al., 1999; Rhoads, 1999); the synchrotron cooling frequency is below the optical passband and the index of the electron energy distribution is unusually hard, (Cowsik et al., 2001; Sagar et al., 2001; Stanek et al., 2001; Panaitescu & Kumar, 2002). Other authors prefer to interpret the break as a dynamical transition to non-relativistic expansion (In ’t Zand et al., 2001; Masetti et al., 2001), requiring a very energetic burst ( erg) expanding into a dense ( cm-3) circumburst medium. More recently, Björnsson et al. (2002) have argued in favor of the jet model but invoke continuous energy injection to explain why the standard model may erroneously be deriving a hard electron energy index.
Here we report on Hubble Space Telescope WFPC2 and STIS near-UV MAMA observations, and ground-based optical observations. We interpret the resulting lightcurves in the context of a relativistic blast-wave model with a hard electron-energy distribution. The relatively large spectral baseline provided by the STIS NUV MAMA observations allows an investigation of the extinction properties along the line of sight to GRB 010222. In §2 we present the observations and the data analysis. In §3 we present the optical lightcurves, model fits to the data and investigate the extinction properties along the line of sight. In §4 we discuss the results and conclude.
2 Observations and Data Reduction
2.1 HST STIS near-UV MAMA Observations
On 2001 Feb 26.15 UT, the optical transient (OT) was imaged with the Space Telescope Imaging Spectrograph (STIS) using the near-UV MAMA and the F25QTZ filter. This filter spans 1450–3500 Å (thus excluding terrestrial airglow lines of Ly and O I), but little source flux is expected below the redshifted Lyman limit of the OT (2253 Å). We obtained six exposures spanning 2.42 – 4.64 hours UT, with exposure times of 800–866 sec. The OT was placed near the center of the detector in each exposure, but dithering of 5–16 pixels placed the OT at a different location in each frame, to smooth over small-scale variations in sensitivity.
The raw STIS exposures were reduced using the CALSTIS package of the STIS Instrument Definition Team (Lindler, 1999). Using IDL, we performed aperture photometry on each frame, assuming a source aperture of 10 pixel radius (0.25") and a sky annulus spanning radii 30–50 pixels. The OT is well detected in each frame, at a signal-to-noise ratio 10. Summing the net counts in each frame and dividing by the total exposure time yields a mean count rate of cts s-1. There is no evidence for variability over the two hours of STIS exposures; the count rate measured in each frame scatters within 1 around the mean rate. The encircled energy within the source aperture is 0.856 for near-UV MAMA imaging at these wavelengths (Robinson, 1997); with an aperture correction, the measured countrate in the STIS bandpass is thus cts s-1. To convert the STIS countrate to flux at a given wavelength requires the assumption of a spectral energy distribution, a discussion of which we present in §3.2.
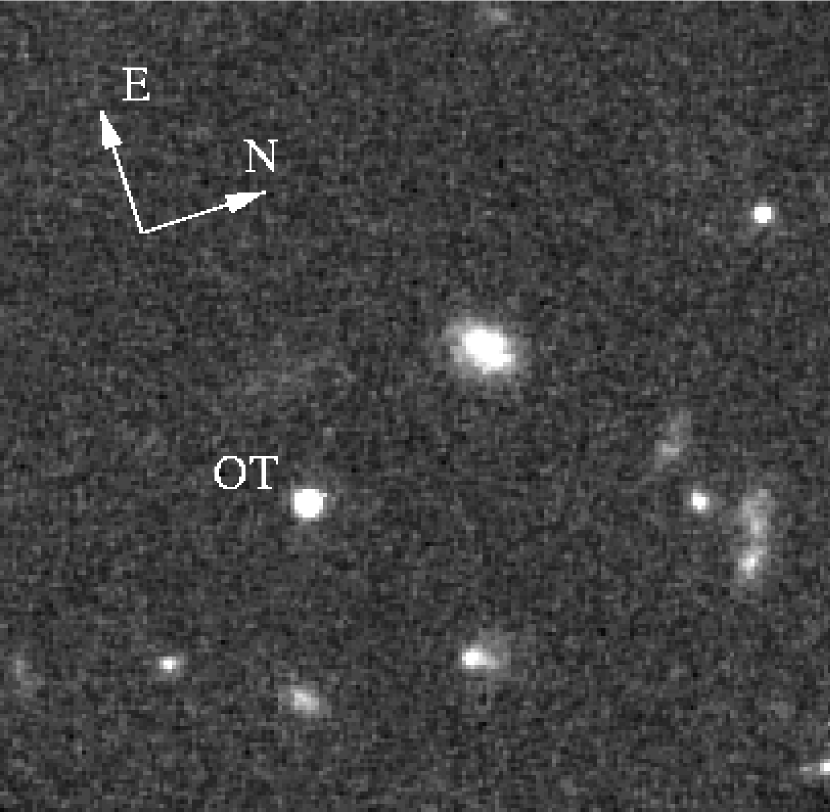
We co-added the individual exposures using the drizzle package (Fruchter & Hook, 2002) to determine if other faint objects are visible in the STIS image. The coaddition was done with a mask for hot and bad pixels, and included a correction for the geometric distortion in the STIS camera. Three extended objects lie near the OT; these objects are also well-detected in the WFPC2 images (see Figure 1). We performed aperture photometry on these objects assuming a source aperture radius of 50 pixels and a sky annulus spanning 50–70 pixels. The objects are non-circular in shape, but this source aperture encloses the detectable flux from each. The first source lies 77 S of the OT, and has a count-rate of cts sec-1; the second source lies 76 SE of the OT, with a count-rate of cts sec-1; the third source lies 42 NNE of the OT, with a count-rate of cts sec-1. Without any knowledge about the SEDs, these count rates cannot be converted to fluxes accurately, but it is worth noting that in the STIS bandpass, these objects are of a brightness comparable to that of the OT.
2.2 HST WFPC2 Observations
We obtained Wide Field Planetary Camera 2 (WFPC2) HST observations in the F450W, F606W and F814W passbands at four epochs as part of an HST cycle 9 program. These observations took place between 2001 February 28.66 UT and May 4.73 UT (6.35–71.42 days after the GRB). The transient was positioned at the WFALL position on WFPC2 CCD #3. A log of the observations is provided in Table 1.
The F450W images were combined using the STSDAS task crrej. The F606W and F814W images at each epoch were observed at two offsets, offset by +2.5, +2.5 pixels in x and y. These images were combined and cosmic-ray rejected using the drizzle technique (Fruchter & Hook, 2002). The drizzled images have pixels half the area of the original WFPC2 data. We determined the mag of the optical transient (OT) in a 2 pixel aperture radius (2.83 pixels for the drizzled images) and determined the aperture correction from 2 to 5 pixels (7.1 pixels for the drizzled images) to obtain the corresponding 5 pixel radius magnitude. We corrected the magnitudes for geometric distortion of the images (Holtzman et al. (1995); a correction of 0.024 magnitudes) and for non-optimal Charge Transfer Efficiency (CTE; less than 0.023 magnitudes). Next, we calibrated the WFPC2 data using the zeropoints and color transformations to the Johnson Coussins system in Table 10 of Holtzman et al. (1995). These magnitudes are given in Table 1 and 2. The quoted errors are statistical only; we estimate the uncertainty in the absolute calibration to be about 0.05 in , , and .
The F606W drizzled image of a region around the OT of Feb 28.75 UT can be seen in Fig. 1. The three objects visible in the STIS NUV-MAMA images are also identified in the WFPC2 images although one of the objects falls on the edge of the CCD. The galaxy 3.96 arcsec North East of the OT is the only one of those three that is displayed. In addition several other galaxies are seen.
We obtain curves of growth to measure the magnitudes of the host in the WFPC2 images; correcting for the contribution of the OT and the contribution of the galaxy in a 2 pixel radius (see §3.2), we find = mag, = mag, = mag, and = mag.
In the final epoch HST images the flux measured at the OT position is dominated by the host galaxy emission. Figure 2 shows the WFPC2 F606W fluxes extracted with increasing apertures, and normalized to unity at 10, for the host emission (diamonds) compared to a reference star (triangles). The figure shows evidence for a very compact emission component, 30–50 % of which can be attributed to the optical transient, and an additional low-level extended emission component.
A cross-correlation of epoch 1 and epoch 6 F606W imaging data allows for us to place the OT position, measured using IRAF/CENTER/OFILTER in epoch 1, atop the apparent host galaxy in epoch 6 (see Bloom et al. 2002a for details). The host center was determined using a centroid algorithm assuming that the light in epoch 6 is dominated by the host. We determine the offset of the optical transient from the host galaxy to be 42.9 5.6 mas East and 7.8 5.8 mas South, i.e., a total offset of 43.6 5.6 mas. This amounts to an offset of 390 51 pc in projection at the redshift of GRB 010222 and places the offset of GRB 010222 in the 20% percentile of observed GRB offsets to-date (Bloom et al., 2002a). Note, that since the offset is smaller than the resolution of final images, if the OT contributes some of the light to the core of the host in epoch 6, probably not more than 30%, then the true offset could be larger by not more than a factor of 1.3.
2.3 Ground-Based Optical Observations
Following the identification of the optical afterglow, we commenced multi-colour observations with the Wise Observatory 1-m telescope. The Wise observations were made with the SITe 2k x 4k CCD, using on-chip 2x2 binning, resulting in a pixel scale of 0.8"/pixel. The observations lasted until about 3 days after the burst. Observations from the Palomar Observatory were hampered by poor weather, but we obtained observations 4.2 hours after the event in a Sloan filter with the 200-inch Hale telescope using the Large Format Camera (LFC) and in B, V, R and I on 2.468 March 2001 UT using the Jacobs Camera (JCAM). The LFC consists of six 2k4k SITe, thinned, backside illuminated CCDs, placed in a symmetric cross shaped pattern, providing a roughly 24 arcmin diameter field of view (FOV). JCAM is a dual-CCD imager with a 3.2 arcmin diameter FOV (Bloom et al., 2002). The observations were reduced in the standard manner, and photometered relative to several field stars calibrated by Henden (2001b). The errors in the table reflect the statistical and systematic uncertainties, the latter of which were sizable for the JCAM and LFC observations because of the lack of suitable secondary standards which did not allow us to fit reliable colour terms. We therefore photometered the afterglow relative to field stars with colours similar to the OT, without applying any colour correction. A log of the observations is presented in Table 3.
3 Afterglow Model
3.1 The Optical Lightcurves
We suplement the HST WFPC2 and ground-based optical observations from Tables 2 and 3 with optical and infrared observations from Cowsik et al. (2001), Lee et al. (2001), Masetti et al. (2001), Sagar et al. (2001), Stanek et al. (2001), Watanabe et al. (2001), and with those reported in several GRB Coordinate Network (GCN) circulars (Orosz, 2001; Massi et al., 2001; Oksanen et al., 2001; Veillet, 2001a, b; Holland et al., 2001). We restricted the dataset to observations for which magnitudes were reported relative to field stars and converted those to the calibration of Henden (2001b) and corrected for a small foreground Galactic extinction ( mag from Schlegel et al. 1998). The infrared measurements of the OT by Masetti et al. (2001) were taken in poor seeing (3–4), and the authors therefore used an aperture of 5 in radius. Keck K-band observations presented in Frail et al. (2002) show that there are several other (relatively bright) NIR sources nearby. Within this aperture we measure ; very comparable to what is measured by Masetti et al. (2001). We conclude that the NIR measurements of Masetti et al. (2001) are severely contaminated (thus explaining the flat NIR light curve) and we do not include these measurements in our dataset. Because the late-time ground-based optical data is also significantly contaminated by the host galaxy we have not included two R-band data points 10 days after GRB 010222. We converted the Sloan Digital Sky Survey u, g, i, r, z observations (Lee et al., 2001) to U, B, V, R, I using the transformations of Fukugita et al. (1996), assuming no fading over the course of the 2.5m observations (predicted fading is 0.005 mag, which is negligible), and a constant colour for the 1.5-m observations of (g-r) = 0.28 0.03 mag. An additional 3% transformation error was added in quadrature to the statistical error for these measurements.
In Figure 3 we display the optical light curves. We have added an additional 0.042 mag error in quadrature, the so-called slop parameter (see §3.2), to reflect uncertainties in the calibration between different instruments. The magnitudes have been converted to flux densities using the transformations of Bessell (1979) and Bessell & Brett (1988). The late-time HST (WFPC2) observations show that the optical light curves, after a shallow break around 0.7 days, continue roughly at the same decay rate as previously found by ground-based observations (Cowsik et al., 2001; Masetti et al., 2001; Stanek et al., 2001; Sagar et al., 2001), and show a leveling off to a constant value in the B, V, R and I band around 25 days (we cannot establish the presence of a host component in the U and infrared passbands due to a lack of late-time observations in those bands). The former has been interpreted as the result of a jet break transition with a very hard electron energy distribution (Masetti et al., 2001; Sagar et al., 2001). The latter is simply interpreted as due to emission from the host galaxy of GRB 010222 in the 2 pixel radius aperture in which we determined the mag of the OT (WFPC2). This is consistent with the fact that the source is extended in the WFPC2 images in the later epochs. Therefore we also have to correct the ground-based data for the contribution of the host outside the 2-pixel radius aperture we used for the WFPC2 images. We determine the difference between a 2 pixel and a large aperture from the HST WFPC2 observations and corrected the ground-based data accordingly.
3.2 Fits to the Broadband GRB 010222 Lightcurves
We now model the optical/NIR photometry and STIS count rate, and constrain model parameters. We model the spectrum with a power law that is extinguished by dust in the host galaxy and our galaxy, and absorbed by hydrogen in the host galaxy and Ly forest, and we model the light curve with a smooth achromatic, broken power law added to a constant, presumably host galaxy, component:
| (1) |
where is the Galactic extinction curve model of Cardelli et al. (1989), is the Ly forest absorption model of Reichart (2001), is the host galaxy extinction curve and Lyman limit absorption model of Reichart (2001), is a normalization parameter, is the effective frequency of the R band, is the spectral slope, is the light curve break time, is the break smoothness parameter, is the limiting temporal slope before , is the limiting temporal slope after , and is the spectral flux of the host galaxy at frequency . The STIS bandpass samples 912–1400 Å in the rest-frame, and so H and H2 absorption lines are expected to be present in the actual flux distribution; however, a smooth power-law suffices to describe the flux in the broad STIS bandpass. We use the full extinction/absorption model of Reichart (2001), because Lee et al. (2001) find a non-standard extinction curve in the source-frame Far UltraViolet (FUV; see below), and the STIS NUV MAMA transmission function spans the source-frame FUV, Ly forest, and Lyman limit.
Since the source-frame UV extinction curve model has features that are narrower than most photometric bands, we convolve Equation (1) with a boxcar approximation to the appropriate filter function before fitting it to the optical/NIR photometry. We have found that failure to do this can cause one to erroneously identify LMC- and SMC-like extinction curves when an extinction curve with a large FUV excess component, possibly related to the fragmentation of grains by the burst (see below), is actually favored by the data. In the case of the STIS measurement, we fit
| (2) |
to the measured count rate, where is the collecting area of the mirror, and is the transmission function of the mirror and instrument.
Following previous efforts (Cowsik et al., 2001; Sagar et al., 2001; Stanek et al., 2001; Panaitescu & Kumar, 2002) we chose to fit the data in terms of the standard afterglow model (e.g., Sari, Piran & Narayan 1998; Sari, Piran & Halpern 1999). We do not favor an interpretation in which the break is due to a transition of the blastwave to the non-relativistic phase (In ’t Zand et al., 2001; Masetti et al., 2001). The same claim has been made for GRB 000926 (Piro et al., 2001) but the high ambient density causes the self-absorption frequency to lie far above the radio passband (Harrison et al., 2001) resulting in an undetectable radio afterglow, contrary to observations. The jet model with continuous energy injection (Björnsson et al., 2002) is an interesting alternative but adequate testing of this model will require a full broadband dataset.
A significant difference between our model fit and others is that and are not independent but are in fact directly related to each other by the index of the electron energy distribution. Previous fits to the GRB 010222 light curves have treated these two parameters as independent (e.g., Stanek et al. 2001). We take , , and (where is the power law index of the electron energy distribution), a relation which applies in the standard jet model when the optical band lies above the synchrotron cooling frequency (Sari et al., 1999). This relation may not be obeyed when (Bhattacharya, 2001; Panaitescu, 2001; Dai & Cheng, 2001). In order to avoid divergence of the shock energy, an additional cutoff in the electron energy distribution must be introduced. In general this will modify the temporal dependence of the decay indices compared to the case. However, Bhattacharya (2001) has shown that the behavior is identical when varies in direct proportion to the bulk Lorentz factor of the shock. Although this is a reasonable assumption, we note that other solutions are possible depending on what is adopted for the evolution of .
We fit the standard model to the optical/NIR photometry and STIS NUV MAMA count rate using Bayesian inference (e.g., Reichart 2001): The posterior probability distribution is equal to the product of the prior probability distribution and the likelihood function. The likelihood function is given by
| (3) |
where is the number of measurements, is the above described convolution of Equation (1) evaluated at the effective frequency and time of the th measurement if , and (Equation 2) if , is the th measurement in units of log spectral flux if , and log count rate if , is the uncertainty in the th measurement in the same units, and is a parameter, sometimes called the “slop parameter”, that models the small systematic errors that are unavoidably introduced when data are collected from a wide variety of sources, and other small sources of error (Reichart, 2001).
Many of the parameters of the host galaxy extinction curve model, and all of the parameters of the Ly forest absorption model and Galactic extinction curve model can be constrained a priori. The host galaxy extinction curve model of Reichart (2001) is a function of eight parameters: the source-frame V-band extinction magnitude , , the intercept and slope of the linear component of the source-frame UV extinction curve, the strength , width , and center of the UV bump component of the extinction curve, and the strength of the FUV excess component of the extinction curve. The Ly forest model of Reichart (2001) is a function of a single parameter , the flux deficit. Reichart (2001) finds prior probability distributions for , , , , and , which means that the values of these parameters can be weighted by fairly narrow distributions, the parameterization of which sometimes depends on other parameters (in particular and ), a priori. We adopt these priors here, which can be thought of as increasing the degrees of freedom by five. Also, the Galactic extinction curve model of Cardelli, Clayton & Mathis (1989) is a function of a single parameter . We adopt a prior for this parameter that is log-normally distributed with mean and width 0.1, which closely approximates the distribution of values of this parameter along random lines of sight through the Galaxy (e.g., Reichart 2001).
The best fit is found by maximizing the posterior. We find that Jy, , day, , Jy, Jy, Jy, , mag, , , , and mag. We plot the best fit UBVRI light curves in Figure 3, and the best fit spectral flux distribution, convolved with a canonical filter function, for two epochs in Figure 4. In Figure 4, we plot the effective spectral flux Jy and frequency Hz of the STIS measurement for our best-fit spectrum. However, the uncertainty in our fitted spectrum is not reflected in these values and uncertainties, and consequently they should not be used in modeling efforts. Rather, the measured count rate should be fitted to using Equation (2).
These results are consistent with the results of Lee et al. (2001) for their assumed spectral slope of : Lee et al. (2001) find that mag at the 1 confidence level, and mag at the 2 confidence level, but mag at the 4.3 confidence level. We find that mag at the 5.4 confidence level. Furthermore, Lee et al. (2001) find that , and that at the 2.5 confidence level, and – the largest value previously observed – at the 2.1 confidence level. We find that at the 5.3 confidence level, and that at the 2.8 confidence level. A canonical value for is about 0.5, and ranges between 0 to 1 in the Milky Way, the LMC and the SMC (Reichart, 2001). Lee et al. (2001) suggest that this stronger than expected FUV excess component of the extinction curve might be due to sublimation and fragmentation of circumburst dust (e.g, Waxman & Draine 2000; Galama & Wijers 2001): If small (radius ) graphite grains, which are probably responsible for the FUV excess component of the extinction curve (e.g., Draine & Lee 1984) survive in greater numbers than other grains, this value of would not be unexpected. This result is seemingly at odds with the recent work of Perna, Lazzati, & Fiore (2003) who have modeled the temporal evolution of the dust properties subject to an strong X-ray/UV radiation field. They find that the dust destruction preferentially occurs through sublimation of smaller grains leading to a flat extinction curve.
Predehl & Schmitt (1995) have measured the relation between optical extinction and hydrogen column for the Milky Way. Assuming a Galactic relation between and , our measurement of mag corresponds to a Hydrogen column of cm-2. The hydrogen column density is found to be cm-2 (In ’t Zand et al., 2001), corresponding to a restframe column density of cm-2 i.e. 78 17 times larger than expected on the basis of the Galactic relation. If the value of derived from Chandra observations by Björnsson et al. (2002) this ratio is about a factor of two lower.
4 Discussion and Conclusions
The late-time optical observations with WFPC2 on HST flatten after days, indicating the presence of a host galaxy; we derive from the WFPC2 images = mag, = mag, = mag, and = mag. We find that the host galaxy emission is dominated by a very compact core, similar to, for example, the host of GRB 970508 (Fruchter et al., 2000). Similar conclusions about the host galaxy properties were also reached by Fruchter et al. (2001) from an independent analysis of these same data.
These late-time optical observations also show that the optical light curves continued their decay slightly faster; we find a significantly larger value of the electron-energy index , and a later jet-break time day than previous work (Cowsik et al., 2001; Masetti et al., 2001; Sagar et al., 2001; Stanek et al., 2001) has reported ( and days). At the same time the quality of the fit is good (requiring a modest value for the “slop” parameter, ), and indicates that a single value of suffices to describe the observations. We are not required by the observations to resort to a more complicated model with, e.g., an index, , that increases with time (reflected in an increase in decay rate with time). Our finding of a steeper decay rate may be caused by: (i) our detection of and fitting for a host galaxy contributing to the late-time emission, which suggests that previous work requires a small correction for its contribution, and (ii) the jet transition may not have been fully developed yet in the early-time observations presented by previous workers (resulting in their finding a lower ). For accurate determination of the physical parameters of the afterglow late-time sensitive observations with HST are of great importance. Our determination of therefore supersedes that of previous work.
Our STIS NUV measurement indicates that the spectral flux distribution falls off rapidly toward the ultraviolet; the Far UltraViolet (FUV) curvature component (Reichart, 2001) is rather large. This may be due to dust destruction, where larger grains are preferentially destroyed. This provides further support for the idea that the early, hard radiation from the GRB and its afterglow should destroy dust in the circumburst environment, carving a path out of the molecular cloud through which later afterglow light can travel relatively unobstructed (Waxman & Draine, 2000; Fruchter et al., 2001).
Additional observational support for dust destruction comes from the fact that the hydrogen column density is found to be 40-80 times larger than expected from the observed . This appears to be a trend in GRB afterglows: the column densities are high and found to be typical of Galactic giant molecular clouds (Galama & Wijers, 2001; Reichart & Price, 2002), but the optical extinction is found to be small (factors of 10-100 times smaller). Galama & Wijers (2001) have interpreted this as evidence that GRBs occur in dense star-forming regions and that the dust is indeed being destroyed.
Also from the possible connection of GRBs with supernovae (Galama et al., 1998; Kulkarni et al., 1998; Bloom et al., 1999; Reichart, 1999; Galama et al., 2000; Castro-Tirado et al., 2001; Björnsson et al., 2001; Bloom et al., 2002b), we would expect that GRBs occur in dense star-forming regions; large amounts of optical extinction are then naturally expected but only small amounts are observed (Galama & Wijers, 2001).
On the other hand, early-time Keck spectroscopic observations of GRB 010222 (Mirabal et al., 2002) show a two-component system similar to that of GRB 000926 (Castro et al., 2002). In GRB 000926 the two absorption systems have a velocity separation of 168 km s-1, which is interpreted as being due to two individual clouds in the host galaxy. Dust destruction by the GRB and the afterglow is effective only to pc (Waxman & Draine, 2000; Fruchter et al., 2001) from the GRB, and it is therefore unlikely that the dust in both clouds would be destroyed. Further, the two clouds appear to have similar relative metal abundance and dust to gas ratio. Castro et al. (2002) argue that one of the clouds is probably associated with the GRB site, and consequently that the burst was ineffective at sublimating dust, in contradiction to theoretical expectations (e.g., Waxman & Draine 2000). In other words, the explanation for the observed low optical extinctions could also be that GRB host galaxies typically have low dust to gas ratios (cf., Pettini et al. 1997). This is a simple and attractive explanation, based only on the assumption that the dust to gas ratio was the same for both clouds before the burst occurred. However, in higher redshift galaxies, such as this one, the dust to gas ratio might only be high in those clouds that are actively producing stars, which is presumably the case at the GRB site (i.e., dust has not had sufficient time to mix with gas elsewhere in the galaxy). The burst would sublimate this dust, returning the metals to the gas phase, and consequently, similar relative metalicities and dust to gas ratios might also be interpreted as evidence in favor of sublimation.
References
- Berger & Frail (2001) Berger, E. and Frail, D. 2001, GCN notice 968
- Bessell (1979) Bessell, M. S. 1979, PASP, 91, 589
- Bessell & Brett (1988) Bessell, M. S. and Brett, J. M. 1988, PASP, 100, 1134
- Bhattacharya (2001) Bhattacharya, D. 2001, Bulletin of the Astronomical Society of India, 29, 107
- Björnsson et al. (2002) Björnsson, G., Hjorth, J., Pedersen, K., and Fynbo, J. U. 2002, ApJ, 579, L59
- Björnsson et al. (2001) Björnsson, G., Hjorth, J., Jakobsson, P., Christensen, L., and Holland, S. 2001, ApJ, 552, L121
- Bloom et al. (2001) Bloom, J. et al. . 2001, GCN notice 989
- Bloom et al. (2002) —. 2002, in preparation
- Bloom et al. (2002a) Bloom, J. S., Kulkarni, S. R., and Djorgovski, S. G. 2002a, AJ, 123, 1111
- Bloom et al. (2002b) Bloom, J. S. et al. . 2002b, ApJ, 572, L45
- Bloom et al. (1999) Bloom, J. S. et al. . 1999, Nature, 401, 453
- Cardelli et al. (1989) Cardelli, J. A., Clayton, G. C., and Mathis, J. S. 1989, ApJ, 345, 245
- Castro et al. (2001) Castro, S. et al. . 2001, GCN notice 999
- Castro et al. (2002) —. 2002, ApJ in press; astro-ph/0110566
- Castro-Tirado et al. (2001) Castro-Tirado, A. J. et al. . 2001, A&A, 370, 398
- Cowsik et al. (2001) Cowsik, R., Prabhu, T. P., Anupama, G. C., Bhatt, B. C., Sahu, D. K., Ambika, S., Padmakar, and Bhargavi, S. G. 2001, Bulletin of the Astronomical Society of India, 29, 157
- Dai & Cheng (2001) Dai, Z. G. and Cheng, K. S. 2001, ApJ, 558, L109
- Draine & Lee (1984) Draine, B. T. and Lee, H. M. 1984, ApJ, 285, 89
- Fich et al. (2001) Fich, M. et al. . 2001, GCN notice 971
- Frail et al. (2002) Frail, D. A. et al. . 2002, ApJ, 565, 829
- Fruchter et al. (2001) Fruchter et al. . 2001, GCN notice 1087
- Fruchter et al. (2001) Fruchter, A., Krolik, J. H., and Rhoads, J. E. 2001, ApJ, 563, 597
- Fruchter & Hook (2002) Fruchter, A. S. and Hook, R. N. 2002, PASP, 114, 144
- Fruchter et al. (2000) Fruchter, A. S. et al. . 2000, ApJ, 545, 664
- Fukugita et al. (1996) Fukugita, M., Ichikawa, T., Gunn, J. E., Doi, M., Shimasaku, K., and Schneider, D. P. 1996, AJ, 111, 1748
- Galama et al. (2000) Galama, T. J. et al. . 2000, ApJ, 536, 185
- Galama et al. (1998) —. 1998, Nature, 395, 670
- Galama & Wijers (2001) Galama, T. J. and Wijers, R. A. M. J. 2001, ApJ, 549, L209
- Garnavich et al. (2001) Garnavich, P. M. et al. . 2001, GCN notice 965
- Harrison et al. (2001) Harrison, F. A. et al. . 2001, ApJ, 559, 123
- Henden (2001a) Henden, A. 2001a, GCN notice 962
- Henden (2001b) —. 2001b, GCN notice 987
- Henden & Vrba (2001) Henden, A. and Vrba, F. 2001, GCN notice 967
- Holland et al. (2001) Holland, S. et al. . 2001, GCN notice 1002
- Holtzman et al. (1995) Holtzman, J. A., Burrows, C. J., Casertano, S., Hester, J. J., Trauger, J. T., Watson, A. M., and Worthey, G. 1995, PASP, 107, 1065
- In ’t Zand et al. (2001) In ’t Zand, J. J. M. i. et al. . 2001, ApJ, 559, 710
- Jha et al. (2001) Jha, S. et al. . 2001, ApJ, 554, L155
- Kulkarni et al. (1998) Kulkarni, S. R. et al. . 1998, Nature, 395, 663
- Lee et al. (2001) Lee, B. C. et al. . 2001, ApJ, 561, 183
- Lindler (1999) Lindler, D. 1999, http://hires.gsfc.nasa.gov/stis/docs/calstis/
- Masetti et al. (2001) Masetti, N. et al. . 2001, A&A, 374, 382
- Massi et al. (2001) Massi, F., Dolci, M., and Carlo, E. D. 2001, GCN notice 980
- McDowell et al. (2001) McDowell, J. et al. . 2001, GCN notice 963
- Mirabal et al. (2002) Mirabal, N. et al. . 2002, ApJ, 578, 818
- Oksanen et al. (2001) Oksanen, A. et al. . 2001, GCN notice 990
- Orosz (2001) Orosz, J. 2001, GCN notice 976
- Panaitescu (2001) Panaitescu, A. 2001, ApJ, 556, 1002
- Panaitescu & Kumar (2002) Panaitescu, A. and Kumar, P. 2002, ApJ, 571, 779
- Perna et al. (2003) Perna, R., Lazzati, D., and Fiore, F. 2003, ApJ in press; astro-ph/0211235
- Pettini et al. (1997) Pettini, M., Smith, L. J., King, D. L., and Hunstead, R. W. 1997, ApJ, 486, 665
- Piro (2001a) Piro, L. 2001a, GCN notice 960
- Piro (2001b) —. 2001b, GCN notice 966
- Piro et al. (2001) Piro, L. et al. . 2001, ApJ, 558, 442
- Predehl & Schmitt (1995) Predehl, P. and Schmitt, J. H. M. M. 1995, A&A, 293, 889
- Reichart (1999) Reichart, D. E. 1999, ApJ, 521, L111
- Reichart (2001) —. 2001, ApJ, 553, 235
- Reichart & Price (2002) Reichart, D. E. and Price, P. A. 2002, ApJ, 565, 174
- Rhoads (1999) Rhoads, J. E. 1999, ApJ, 525, 737
- Robinson (1997) Robinson, R. 1997, http://hires.gsfc.nasa.gov/stis/postcal/quick_reports/
- Sagar et al. (2001) Sagar, R. et al. . 2001, Bulletin of the Astronomical Society of India, 29, 91
- Salamanca et al. (2002) Salamanca et al. . 2002, submitted to MNRAS; astro-ph/0112066
- Sari et al. (1999) Sari, R., Piran, T., and Halpern, J. P. 1999, ApJ, 519, L17
- Sari et al. (1998) Sari, R., Piran, T., and Narayan, R. 1998, ApJ, 497, L17
- Schlegel et al. (1998) Schlegel, D. J., Finkbeiner, D. P., and Davis, M. 1998, ApJ, 500, 525
- Stanek et al. (2001) Stanek, K. Z. et al. . 2001, ApJ, 563, 592
- Veillet (2001a) Veillet, C. 2001a, GCN notice 1000
- Veillet (2001b) —. 2001b, GCN notice 1003
- Watanabe et al. (2001) Watanabe, J., Kinoshita, D., Komiyama, Y., Fuse, T., Urata, Y., and Yoshida, F. 2001, PASJ, 53, L27
- Waxman & Draine (2000) Waxman, E. and Draine, B. T. 2000, ApJ, 537, 796


| Date (2001, UT) | Filter | Exposure time (sec) | Magnitude |
|---|---|---|---|
| Feb 28.66 | F450W | 2x1100 (1 orbit) | 23.463 0.034 |
| Feb 28.75 | F606W | 4x1100 (2 orbits) | 23.029 0.010 |
| Feb 28.89 | F814W | 4x1100 (2 orbits) | 22.440 0.012 |
| Mar 17.86 | F450W | 2x1100 (1 orbit) | 25.48 0.15 |
| Mar 17.96 | F606W | 4x1100 (2 orbits) | 25.075 0.029 |
| Mar 18.90 | F814W | 4x1100 (2 orbits) | 24.41 0.05 |
| Apr 5.40 | F450W | 2x1100 (1 orbit) | 25.71 0.16 |
| Apr 5.49 | F606W | 4x1100 (2 orbits) | 25.72 0.04 |
| Apr 6.56 | F814W | 4x1100 (2 orbits) | 25.02 0.06 |
| May 4.35 | F606W | 6x1000 (3 orbits) | 25.96 0.06 |
| May 4.73 | F814W | 4x1100 (2 orbits) | 25.37 0.08 |
| Sep 8.38 | F450W | 6x1000 (3 orbits) | 25.94 0.10 |
| Sep 8.59 | F606W | 6x1000 (3 orbits) | 25.82 0.09 |
| Sep 9.39 | F814W | 6x1000 (3 orbits) | 25.53 0.15 |
| Date (2001, UT) | B | V | R | I |
|---|---|---|---|---|
| Feb 28.75 | 23.544 0.038 | 23.264 0.017 | 22.818 0.015 | 22.418 0.015 |
| Mar 17.96 | 25.55 0.16 | 25.35 0.04 | 24.84 0.04 | 24.39 0.05 |
| Apr 5.49 | 25.69 0.16 | 26.01 0.05 | 25.47 0.06 | 25.01 0.06 |
| May 4.54 | 26.20 0.07 | 25.75 0.08 | 25.35 0.08 | |
| Sep 8.79 | 25.96 0.10 | 25.92 0.10 | 25.72 0.13 | 25.52 0.15 |
| Date (UT) | Passband | Magnitude | Telescope |
|---|---|---|---|
| Feb 22.948 | R | 19.387 0.098 | Wise 1-m |
| Feb 22.959 | R | 19.567 0.082 | Wise 1-m |
| Feb 22.970 | V | 20.052 0.085 | Wise 1-m |
| Feb 23.063 | I | 19.102 0.047 | Wise 1-m |
| Feb 23.072 | R | 19.676 0.053 | Wise 1-m |
| Feb 23.086 | V | 20.093 0.061 | Wise 1-m |
| Feb 24.020 | R | 20.859 0.075 | Wise 1-m |
| Feb 24.052 | V | 21.279 0.109 | Wise 1-m |
| Feb 24.084 | I | 20.582 0.118 | Wise 1-m |
| Feb 25.085 | R | 21.607 0.129 | Wise 1-m |
| Feb 25.136 | V | 21.721 0.231 | Wise 1-m |
| Feb 22.482 | R | 18.455 0.033 | P200 LFC |
| Feb 22.487 | R | 18.481 0.036 | P200 LFC |
| Mar 2.468 | I | 22.57 0.35 | P200 JCAM |
| Mar 2.468 | R | 23.19 0.15 | P200 JCAM |
| Mar 2.468 | V | 23.54 0.17 | P200 JCAM |
| Mar 2.468 | B | 24.15 0.46 | P200 JCAM |