Possibly interacting Vorontsov-Velyaminov galaxies
In continuation of the program formulated in Paper I we present results of long-slit spectroscopy with the Russian 6 m telescope of five more objects from the Vorontsov-Velyaminov (hereafter VV) Atlas and Catalogue of Interacting galaxies. These are the galaxies for which the interaction is not evident, although all of them are classified as multiple systems (usually as “nests”, “chains” and similar systems). The spectrophotometry data enable us to derive for all galaxies abundances of O, and for some of them abundances of N, Ne and S. For two of them chemical abundances are given for the first time. In spectra of three of the studied galaxies [O iii] 4363 line is measured, and Te and oxygen abundance are derived by the classical method. For the two others, empirical methods are used. For all 5 galaxies, the radial velocity distribution along the slit was obtained in the H-line. The studied galaxies represent a rather mixed sample: from very low luminosity irregular galaxies, like VV 499 (DDO 053), to rather bright VV 523 (NGC 3991). Their metallicities vary from 1/25 ⊙ for VV 499 to 1/2 ⊙ for VV 523. The morphology of these galaxies ranges between typical dIrr (VV 080) through ring-like (VV 131) to clumpy Irr (VV 523). Position–Velocity diagrams in the H-line along the galaxy body imply the existence of large-scale ionized gas outflows/supershells around the sites of intense current and/or recent SF activity. Sizes of supershells vary in the range of several hundred pc to 2 kpc. For all studied galaxies we examine their local environment and indicate the nearest neighbouring objects capable of inducing the observed enhanced star formation.
Key Words.:
galaxies: interactions – galaxies: abundances – galaxies: starburst – galaxies: irregular – galaxies: general| Galaxy | Date | Grating | Exposure | Wavelength | Dispersion | PA |
| Name | [grooves/mm] | time [s] | Range [Å] | [Å/pixel] | [Degree] | |
| (1) | (2) | (3) | (4) | (5) | (6) | (7) |
| VV 080 | 04.09.1999 | 1302 | 900 | 6000–7200 | 1.2 | 45 |
| VV 080 | 01.11.1999 | 325 | 1200 | 3700–8000 | 4.6 | 55 |
| VV 080 | 01.11.1999 | 325 | 1200 | 3700–8000 | 4.6 | 125 |
| VV 531 | 04.09.1999 | 1302 | 1200 | 6000–7200 | 1.2 | 42 |
| VV 531 | 04.09.1999 | 1302 | 900 | 6000–7200 | 1.2 | 96 |
| VV 531 | 02.11.1999 | 651 | 900 | 3700–6000 | 2.4 | 42 |
| VV 531 | 02.11.1999 | 651 | 1200 | 3700–6000 | 2.4 | 96 |
| VV 499 | 12.02.1999 | 325 | 600 | 3700–8000 | 4.6 | 145 |
| VV 499 | 12.02.1999 | 325 | 1200 | 3700–8000 | 4.6 | 145 |
| VV 499 | 25.04.1999 | 1302 | 21200 | 6000–7200 | 1.2 | 98 |
| VV 499 | 25.04.1999 | 1302 | 900 | 6000–7200 | 1.2 | 145 |
| VV 499 | 06.10.1999 | 651 | 21200 | 3700–6000 | 2.4 | 145 |
| VV 499 | 05.10.2000 | 651 | 21800 | 3700–6000 | 2.4 | 140 |
| VV 499 | 26.12.2001 | 1302 | 21800 | 6000–7200 | 1.2 | 100,145 |
| VV 131 | 13.02.1999 | 325 | 600 | 3700–8000 | 4.6 | 158 |
| VV 131 | 03.11.1999 | 1302 | 1800 | 6000–7200 | 1.2 | 158 |
| VV 131 | 26.12.2001 | 1302 | 1800,900 | 6000–7200 | 1.2 | 46,103 |
| VV 523 | 12.07.1999 | 325 | 2900 | 3700–8000 | 4.6 | 33 |
| VV 523 | 14.07.1999 | 1302 | 1200 | 6000–7200 | 1.2 | 33 |
| Parameter | VV 080 | VV 531 | VV 499 | VV 131 | VV 523 |
|---|---|---|---|---|---|
| Other name | NGC 14 | NGC 1156 | DDO 053 | UGC 4874 | NGC 3991 |
| 00h08m46.2s | 02h59m42.5s | 08h34m06.9s | 09h15m17.43s | 11h57m31.5s | |
| +15°49′01″ | +25°14′15″ | +66°10′55″ | +48°39′55″ | +32°20′25″ | |
| 12.710.16 | 12.320.13 | 14.480.17 | 16.00.5 | 13.500.20 | |
| (mag) | 0.33 | 0.97 | 0.16 | 0.07 | 0.10 |
| 0.580.23 | 0.580.18 | 0.350.24 | — | 0.390.28 | |
| (km s-1) | 8651 | 3751 | –1910 | 27865 | 31925 |
| Distance (Mpc)(2) | 11.7 | 7.8(3) | 3.56(4) | 39.6 | 45.3 |
| (2) | –18.0 | –17.7 | –13.6 | –17.1 | –20.9 |
| D25 (″) | 1518 | 1907 | 679 | 468 | 86(8) |
| D25 (kpc)(2) | 9.3 | 7.2 | 1.3 | 8.3 | 18.9 |
| Axial ratio (b/a)(1) | 0.75 | 0.76 | 0.87 | 0.82 | 0.33 |
| 12+(O/H) | 8.69 | 8.170.08 | 7.520.08 | 7.850.06 | 8.65(10) |
| HI integr.flux(1) (Jykm s-1) | 12.18 | 72.75 | 23.7 | 9.33 | 17.0 |
| km s-1 (11) | 11417 | 1033(6) | 30(7) | 1147 | 24512 |
| M(HI) (10⊙) | 3.9 | 10.4 | 0.71 | 34.5 | 82.3 |
| M(HI)/(2) | 0.16 | 0.56 | 1.7 | 3.2 | 0.23 |
| – total blue magnitude; – extinction corrected absolute magnitude | |||||
| D25 – Diameter at the surface brightness =25m/″ from LEDA; – Galactic extinction in blue | |||||
| (1) Data from NED; -mag. from UGC and VV catalogs | |||||
| (2) See explanations in section 3; (3) from Karachentsev et al. (Kara96 (1996)); (4) Karachentsev et al. (Kara02 (2002)) | |||||
| (5) Haynes et al. (Haynes98 (1998)); (6) from Broeils & van Woerden (BvW94 (1994)) | |||||
| (7) this is from Huchtmeier & Richter (Huchtmeier89 (1989)); (8) from Hecquet et al. Hecquet95 (1995) | |||||
| (9) Determined by combination of empirical methods (see section 3.1.2) | |||||
| (10) Determined with the use of the empirical method by Pilyugin (Pilyugin01 (2001)) | |||||
| (11) from Huchtmeier & Richter (Huchtmeier89 (1989)) | |||||
1 Introduction
As already noticed in the introduction to Paper I (Zasov et al. Zasov00 (2000)), among definitely interacting galaxies in close pairs or groups, which were (in most cases) discovered by Vorontsov-Velyaminov and included in his Atlas and Catalog of interacting galaxies (Vorontsov-Velyaminov Vorontsov59 (1959, 1977)) there are objects with VV numbers where an interaction is not so evident. Many such objects were classified by Vorontsov-Velyaminov as “nests” or often similar systems called “chains” or “pairs in contact”. The original idea of the nature of such galaxies was that they are fragmenting unstable systems. However, observations showed that VV galaxies present a large diversity of types, with no evidence of instability (at least in most cases). It is clear now that the objects in question include both galaxies of strange and unusual shapes (either single objects or mergers), and multiple systems as well, in which only detailed studies allow to disentangle separate components. In particular, the study of ionized or neutral gas velocity distributions may help to resolve the enigma of a galaxy with strange morphology.
The complimentary spectral data are also useful to better constrain the nature of the studied galaxies. In particular, chemical element abundances in regions of current starburst and ages of recent starbursts are important to understand the processes responsible for their peculiarities.
For some of these galaxies H-line kinematic data have been obtained with the 6 m telescope in the beginning of the 1980s (Arkhipova et al. Arkhipova81 (1981), 1987a , 1987b , 1987c ) using the Long-Slit spectrograph with an image tube and photoplate as a detector. New observational opportunities based on use of CCD detectors allowed a higher sensitivity and larger dynamical range data. This strengthened our interest more detailed studies of the subsample of VV galaxies with no traces of interaction.
For the current study we selected about 30 VV galaxies. They look like tight multiple systems or single clumpy galaxies, in which such indicators of interaction as well defined tidal tails or bridges are absent. In Paper I we published the results of four galaxies – VV 432, VV 543E, VV 543W and VV 747. In this paper, the second in the series, we present results of long-slit spectroscopy with the SAO 6 m telescope for five more VV galaxies: VV 080 (NGC 14), VV 131 (UGC 4874), VV 499 (DDO 053), VV 523 (NGC 3991) and VV 531 (NGC 1156).
For all galaxies we obtained the velocity distribution along the slit using the H line, determined relative intensities of detected emission lines, derived abundances of oxygen and some other elements, and estimated characteristic ages of starbursts, as seen in the brightest individual knots. In Section 2 we describe observations, data reduction, and the analysis of obtained observational parameters. In Section 3 we consider individual properties of the studied galaxies. A summary of the obtained results and preliminary conclusions are presented in Section 4.
2 Spectral observations, data reduction and analysis
2.1 Observations
All results presented below were obtained with the SAO 6 m telescope during seven runs in February, April, July, September and November 1999, October 2000, and December 2001 (see for details Table 1). The Long-Slit spectrograph (Afanasiev et al. Afanasiev95 (1995)) at the 6 m telescope prime focus was equipped with a Photometrics CCD-detector PM1024 (with a 2424m pixel size) installed at Schmidt-Cassegrain camera F/1.5. Observations were conducted mainly using the software package NICE in MIDAS, described by Kniazev & Shergin (Kniazev95 (1995)). Long slit spectra (120″) for abundance analysis were obtained with either a 325 gr.mm-1 grating (4.6 Å pix-1), or with a 651 gr.mm-1 grating (2.4 Å pix-1). The slit width was 1.5″ and 2.0″ respectively. For the study of ionized gas kinematics a 1302 gr.mm-1 grating (1.2 Å pix-1) with a slit of 2″120″ was used. The scale along the slit was 0.39″ pix-1 for all three set-ups. Seeing during observations was mostly in the range of 1.5″ to 2.5″. The resulting resolution was about 14–15 Å for the first set-up, 7 Å for the second, and about 3.2 Å for the third set-up. Reference spectra of an He–Ne–Ar lamp were recorded before or after each observation to provide wavelength calibration. Spectrophotometric standard stars from Massey et al. (Massey88 (1988)) were observed for flux calibration at least twice a night.
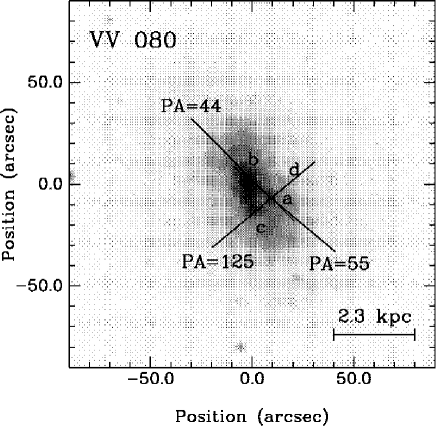
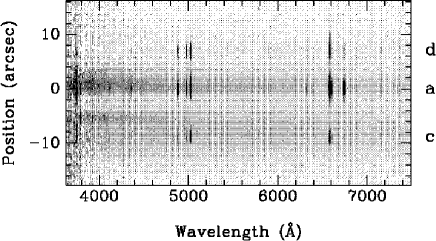
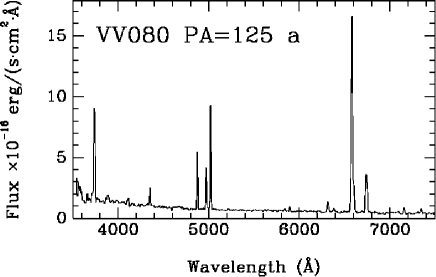
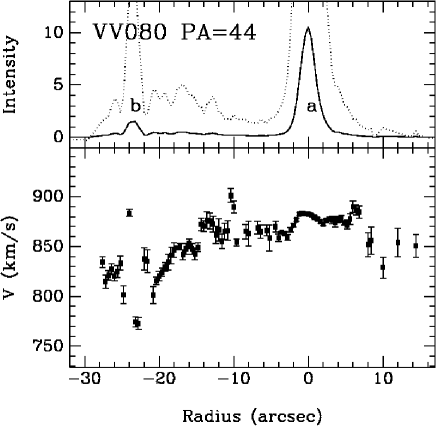
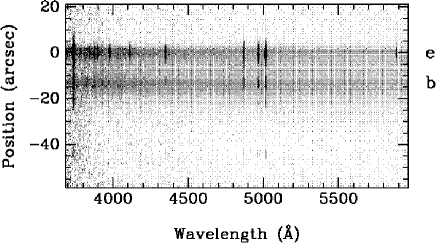
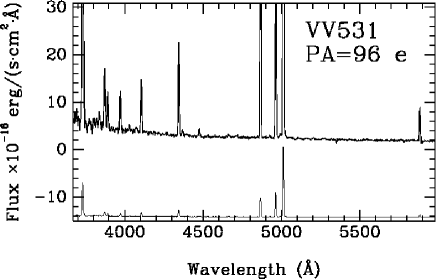
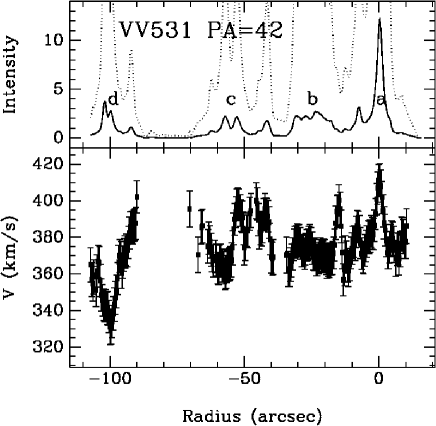
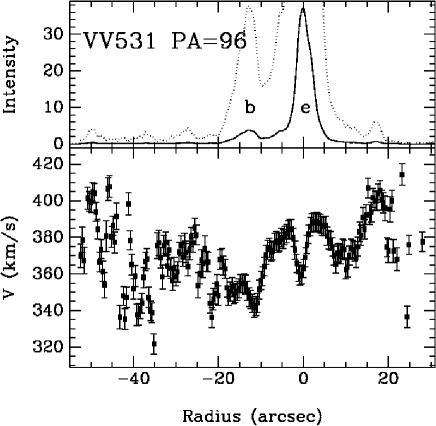
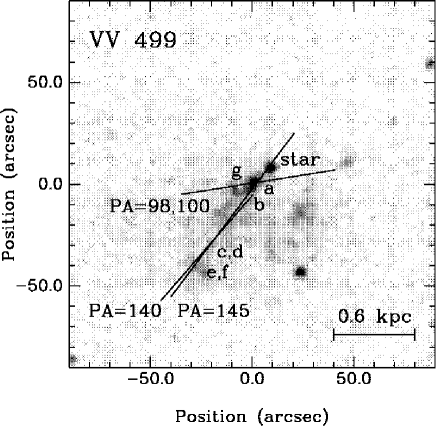
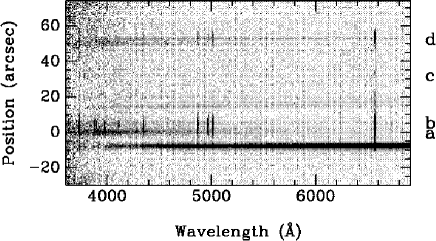
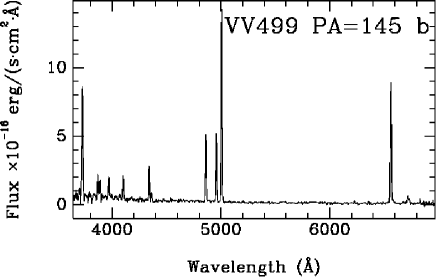
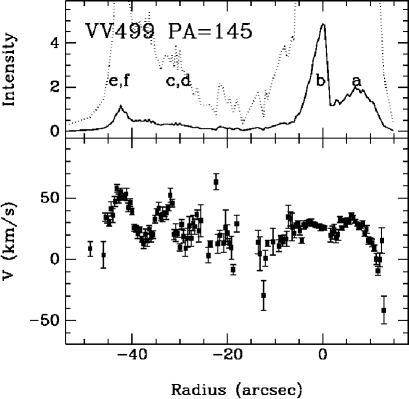
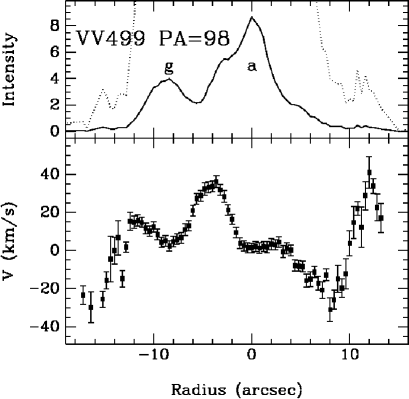
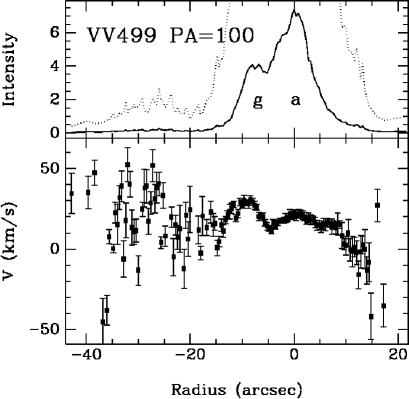
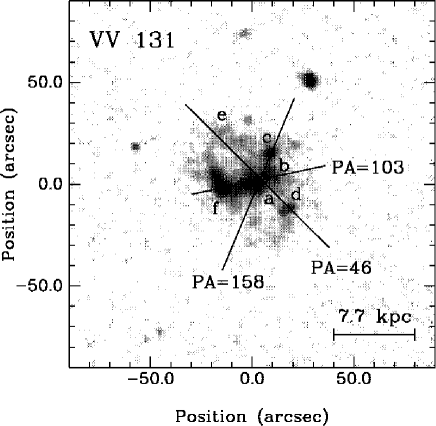
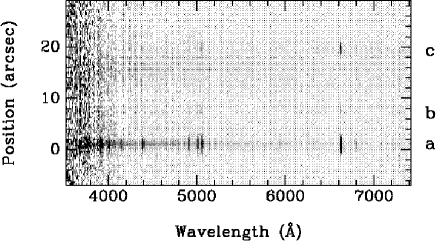
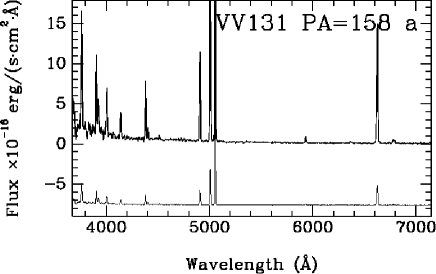
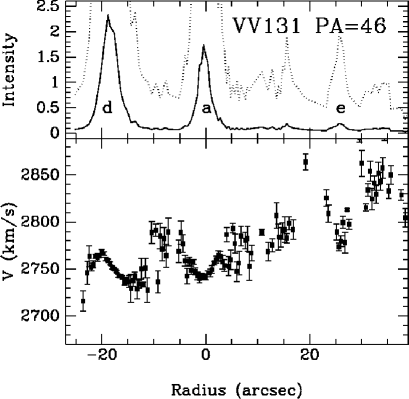
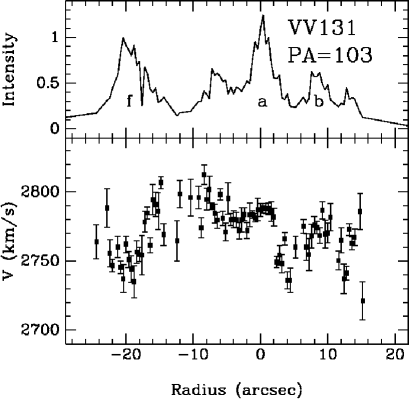
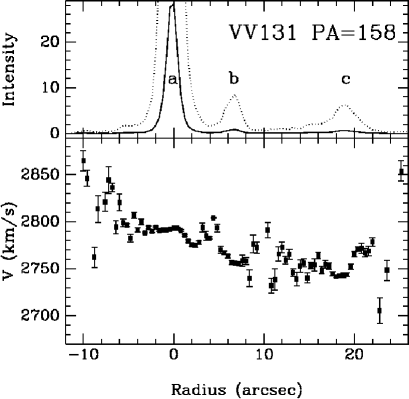
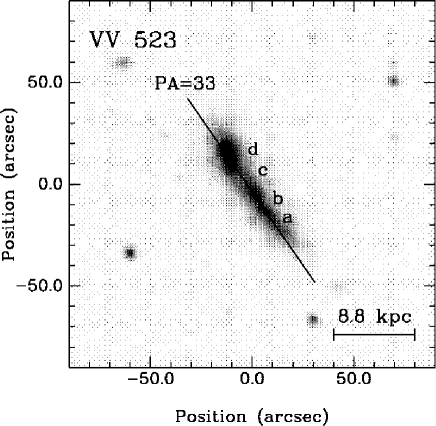
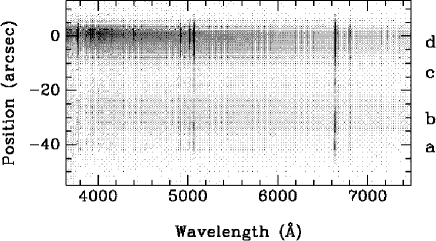
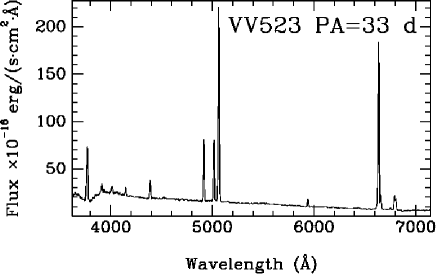
Results of spectroscopy are presented in various forms. We show in the top panels of Figures 1,3,5,7 and 9 direct images of the studied galaxies, extracted from the Digitized Sky Survey (DSS) with the position of the long slit indicated by a bar. Corresponding 2D spectra are shown in the middle panels of these figures. Brightness profiles of H line along the slit and the corresponding Position–Velocity (P–V) diagrams are presented in Figures 2,4,6,8 and 10. In bottom panels of Figures 1,3,5,7 and 9 we present 1D spectra (extracted from the above 2D spectra), which were used for measurements of line intensities and determination of physical conditions and chemical abundances in these H ii regions.
| VV 080 (a) | VV 131 (a) | VV 499 (b) | ||||
| (Å) Ion | F()/F(H) | I()/I(H) | F()/F(H) | I()/I(H) | F()/F(H) | I()/I(H) |
| 3727 [O ii] | 4.6910.474 | 6.4760.692 | 1.3940.112 | 1.3940.119 | 1.6360.131 | 1.8030.156 |
| 3868 [Ne iii] | — | — | 0.7990.074 | 0.7990.076 | 0.2850.037 | 0.3100.042 |
| 3889 He i + H8 | — | — | 0.3480.047 | 0.3480.064 | 0.2290.034 | 0.2540.062 |
| 3967 [Ne iii] + H7 | — | — | 0.5380.049 | 0.5380.059 | 0.2910.032 | 0.3190.056 |
| 4101 H | 0.2190.067 | 0.2690.115 | 0.3070.026 | 0.3070.034 | 0.3390.035 | 0.3640.050 |
| 4340 H | 0.4610.057 | 0.5280.087 | 0.5660.042 | 0.5660.045 | 0.4510.037 | 0.4720.045 |
| 4363 [O iii] | — | — | 0.1350.013 | 0.1350.014 | 0.0830.013 | 0.0860.014 |
| 4861 H | 1.0000.086 | 1.0000.095 | 1.0000.072 | 1.0000.072 | 1.0000.074 | 1.0000.076 |
| 4959 [O iii] | 0.5540.054 | 0.5410.053 | 2.1080.152 | 2.1080.152 | 0.9930.073 | 0.9840.073 |
| 5007 [O iii] | 1.7450.177 | 1.6840.173 | 6.0410.468 | 6.0410.468 | 2.8670.270 | 2.8300.268 |
| 5876 He i | — | — | 0.0720.007 | 0.0720.007 | — | — |
| 6300 [O i] | 0.1910.045 | 0.1410.034 | 0.0170.004 | 0.0170.004 | — | — |
| 6364 [O i] | 0.0910.051 | 0.0660.037 | — | — | — | — |
| 6548 [N ii] | 0.1910.034 | 0.1350.025 | 0.0140.005 | 0.0140.005 | 0.0140.054 | 0.0130.049 |
| 6563 H | 4.0860.325 | 2.8850.252 | 2.7810.198 | 2.7810.215 | 3.0700.238 | 2.7540.233 |
| 6584 [N ii] | 0.5720.058 | 0.4030.044 | 0.0420.008 | 0.0420.008 | 0.0440.056 | 0.0390.051 |
| 6678 He i | 0.0730.040 | 0.0500.028 | 0.0270.004 | 0.0270.004 | — | — |
| 6717 [S ii] | 0.7760.071 | 0.5340.053 | 0.0830.008 | 0.0830.009 | 0.1850.042 | 0.1650.038 |
| 6731 [S ii] | 0.6010.059 | 0.4130.044 | 0.0620.007 | 0.0620.007 | 0.1130.040 | 0.1010.036 |
| 7065 He i | 0.0290.016 | 0.0190.010 | 0.0240.005 | 0.0240.005 | — | — |
| 7136 [Ar iii] | 0.0910.024 | 0.0590.015 | 0.0490.006 | 0.0490.006 | — | — |
| C(H) dex | 0.460.10 | 0.000.09 | 0.140.10 | |||
| EW(abs) Å | 0.002.18 | 0.002.96 | 0.554.55 | |||
| F(H)(a) | 433 | 1186 | 563 | |||
| EW(H) Å | 553 | 30315 | 27314 | |||
| 88418 | 279027 | -106 | ||||
| Te([OIII]) K | — | 16000900 | 188001900 | |||
| 12+(O/H) | 8.60.1(b) | 7.850.06 | 7.520.08 | |||
| (N/O) | — | -1.620.10 | -1.720.44 | |||
| (Ne/O) | — | -0.540.09 | -0.650.14 | |||
| (a) – in units 10-16 erg cm-1 s-1 | ||||||
| (b) – determined by combination of empirical methods (see section 3.1.2) | ||||||
| VV 523 (d) | VV 531 (e) | |||
| (Å) Ion | F()/F(H) | I()/I(H) | F()/F(H) | I()/I(H) |
| 3727 [O ii] | 0.9530.087 | 0.8470.092 | 2.3090.171 | 3.0930.252 |
| 3868 [Ne iii] | 0.2050.032 | 0.1820.033 | 0.2740.025 | 0.3510.035 |
| 3889 He i + H8 | — | — | 0.1570.018 | 0.2200.035 |
| 3967 [Ne iii] + H7 | 0.1310.025 | 0.2910.038 | 0.1930.018 | 0.2580.032 |
| 4101 H | 0.1240.018 | 0.2660.029 | 0.2210.018 | 0.2810.030 |
| 4340 H | 0.3290.030 | 0.4260.036 | 0.3940.030 | 0.4560.038 |
| 4363 [O iii] | 0.0130.010 | 0.0120.010 | 0.0330.009 | 0.0370.010 |
| 4471 He i | 0.0280.011 | 0.0240.011 | 0.0350.006 | 0.0380.007 |
| 4861 H | 1.0000.082 | 1.0000.085 | 1.0000.076 | 1.0000.078 |
| 4959 [O iii] | 1.0870.087 | 0.9660.087 | 1.2980.156 | 1.2580.154 |
| 5007 [O iii] | 3.2200.290 | 2.8630.290 | 3.9820.329 | 3.8180.321 |
| 5876 He i | 0.1170.018 | 0.1040.018 | 0.1350.011 | 0.1090.009 |
| 6300 [O i | — | — | 0.0540.008 | 0.0400.006 |
| 6312 [S iii] | — | — | 0.0190.006 | 0.0140.005 |
| 6364 [O i] | 0.0140.006 | 0.0120.006 | 0.0170.005 | 0.0120.004 |
| 6548 [N ii] | 0.0790.008 | 0.0710.008 | 0.1040.009 | 0.0750.007 |
| 6563 H | 2.9610.228 | 2.6840.248 | 4.0000.294 | 2.8690.233 |
| 6584 [N ii] | 0.2380.021 | 0.2120.023 | 0.3120.026 | 0.2230.020 |
| 6678 He i | 0.0290.005 | 0.0260.005 | 0.0500.006 | 0.0350.005 |
| 6717 [S ii] | 0.2600.021 | 0.2310.023 | 0.3330.025 | 0.2330.020 |
| 6731 [S ii] | 0.1960.016 | 0.1740.018 | 0.2560.020 | 0.1780.015 |
| 7065 He i | 0.0250.005 | 0.0220.005 | 0.0310.006 | 0.0210.004 |
| 7136 [Ar iii] | 0.1140.011 | 0.1020.011 | 0.1180.011 | 0.0780.008 |
| C(H) dex | 0.000.10 | 0.420.10 | ||
| EW(abs) Å | 6.000.58 | 1.501.69 | ||
| F(H)(a) | 75744 | 42323 | ||
| EW(H) Å | 483 | 1689 | ||
| 335524 | 32121 | |||
| Te([OIII]) K | 88001900 | 115001100 | ||
| 12+(O/H) | 8.650.2(b) | 8.170.09 | ||
| (N/O) | — | -1.340.13 | ||
| (Ne/O) | — | -0.630.18 | ||
| (S/O) | — | -1.690.17 | ||
| (a) – in units 10-16 erg cm-1 s-1; (b) – combined value, see section 3.5.2 | ||||
2.2 Data reduction
The reduction was performed in SAO RAS, using various packages of MIDAS and IRAF. This was described in detail in Paper I, and here we outline only some differences introduced since that time due to the development of the methods.
First, the standard steps such as debiasing, flat-fielding and dark noise subtraction are performed in IRAF for each frame containing the objects and reference spectra. The removal of cosmic-ray hits was conducted using MIDAS. Then 2D linearization of the reference spectra was carried out for each CCD-line, and was applied to 2D spectra of spectrophotometric standards and the target galaxies. The original curved object spectra were straightened. All these procedures were performed in IRAF.
Spectra of standard stars were used to build a spectral response curve that then was applied to the spectra of target galaxies, taking into account atmospheric extinction at their different airmasses. Typical uncertainties of the spectral response curves are 5%. As a result, calibrated 1D spectra of studied galaxies (or their individual fragments) were obtained by summing several lines of rectified 2D spectra over the regions of interest.
Finally, to create tables with intensities of emission lines in 1D spectra, we have integrated fluxes of individual lines and performed a Gaussian analysis of blended (at our spectral resolution) emission lines, such as, H and [O iii] 4363, or H and [N ii] 6548,6584. Gaussian fitting of individual lines was performed and their centers were determined in order to measure the redshifts of the objects. The background level was drawn, either using the algorithm described by Shergin et al. (Shergin96 (1996)) or manually. Oxygen abundances of studied galaxies, derived as explained in Sect. 2.3, are given along with other global parameters in Table 2.
The resulting observed emission line intensities () of various ions relative to that of H, and those corrected for interstellar extinction and underlying stellar absorption () (according to the procedure described by Izotov et al. Izotov97 (1997)), are presented in Tables 3 and 4. The derived extinction coefficient C(H), the equivalent width of absorption Balmer hydrogen lines EW(abs), equivalent width of emission H line – (H) and the observed H flux are shown as well. All data in these tables are given for the brightest knots of each studied galaxy. Their names, according to nomenclature presented in the figures showing the positions of the long slit, follow the galaxy names in the table headers.
2.3 Physical conditions and abundance determinations
To analyse emission-line spectra of studied galaxies we followed the prescriptions given by Aller (Aller84 (1984)). We choose the line intensities ratio of [O iii] (5007+4959)/4363 as the optimal for BCG/H ii-galaxies in order to determine the temperature of the H ii region. To correct line intensities for internal and external extinction and underlying Balmer-line absorptions in the stellar continuum, we apply the self-consistent scheme described by Izotov et al. (Izotov94 (1994)). To take into account different electron temperatures in the regions of predominant [O iii] emission and [O ii] emission we also follow the scheme described in detail by Izotov et al. (Izotov94 (1994), Izotov97 (1997)).
Electron temperatures in the brightest H ii regions of the observed VV galaxies and their chemical abundances are summarized in Tables 3 and 4. Electron densities were determined for all H ii regions (using the density sensitive line ratio of the [S ii] 6717,6731 doublet) in the range of 80 to 160 cm-3, with uncertainties of the order of 100%. So, only an upper limit can be inferred: N cm-3.
In the case of weakness/absence of [O iii]-line 4363 we used various empirical methods suggested, e.g., by McGaugh (McGaugh91 (1991)), or Pilyugin (Pilyugin01 (2001)), based on the analysis of strong oxygen line intensities. This relates to VV 080 and VV 523 (see for details the description of individual galaxy data). The methods based on relative intensity of [N ii] 6548,6584 to that of H (van Zee et al. vanZee98 (1998) and Denicolo et al. Denicolo02 (2002)) were used as well. Note that Pilyugin (Pilyugin01 (2001)) shows that his P-method allows one to get the most precise estimate of O/H.
The important parameter, directly related to equivalent width of emission line H, is the age of the current starburst. It can be determined through the relationships given in Starburst99 (Leitherer et al. Starburst99 (1999)). We used the instantaneous starburst model with the Salpeter initial mass function (IMF) and and of 1 ⊙ and 100 ⊙, respectively.
2.4 Position–Velocity diagrams
The procedure of constructing a Position–Velocity (P–V) diagram based on observations in H was described in detail in Paper I. In a further analysis we used only those points in the P–V diagrams what satisfy the criteria S/N 3 and 15 km s-1. To check the quality of our method and to estimate the residual trends left after the application of this restriction, we apply the same procedure to the two night sky lines in the observed spectrum: O i 6300.27 Å and 6863.96 Å. Being transferred to relative velocity, the r.m.s. of scattering along the slit for these control lines was found to be 1.2 km s-1. The residual systematic trend for corrected night sky lines has a full range of about 20 km s-1 on the scale of 80″. Such accuracy of corrected observed wavelength allows us to study irregularities in P–V diagrams with amplitudes as low as 10 km s-1 on the angular scale down to 20″.
| Object | Knot | EW(H) | Age (Myr) |
|---|---|---|---|
| (1) | (2) | (3) | (4) |
| VV 080 | a | 553 | 5.0 |
| c | 182 | 6.2 | |
| d | 1367 | 3.1 | |
| VV 131 | a | 30315 | 2.9 |
| b | 7714 | 5.3 | |
| c | 305 | 8.7 | |
| VV 499 | a | 745 | 4.9 |
| b | 27314 | 3.2 | |
| d | 443 | 7.7 | |
| VV 523 | a | 704 | 4.8 |
| b | 342 | 5.7 | |
| c | 333 | 5.7 | |
| d | 483 | 5.1 | |
| VV 531 | a | 1015 | 4.6 |
| b | 152 | 7.3 | |
| c | 224 | 6.6 | |
| e | 1689 | 4.0 |
3 Properties of individual galaxies
We summarize the main parameters of the five VV galaxies discussed below in Table 2. They include the name of the object, coordinates for epoch J2000, apparent blue magnitude, radial heliocentric velocity based on H i data taken from the literature with its r.m.s. uncertainty, angular sizes on the isophote =25 mag. arcsec-2, and respective linear size and axial ratio, absolute blue magnitude and oxygen abundance (12+(O/H)). We also present integrated H i flux, 21-cm line width, M(HI) in solar units, and the ratio M(HI)/, in solar units. All distance-dependent parameters in Table 2 are derived for the distances accepted in this table. Absolute magnitudes are corrected for foreground extinction , accepted from NED. No correction for internal extinction was applied.
For galaxies VV 499 and VV 531, distances are determined from measurements of found resolved stars. We accept respective values from literature (see notes to Table 2). For more distant galaxies we use their values of radial velocity presented in Table 2. To derive distances, their radial velocities were corrected for the Sun’s motion relative to the Local Group (LG) centroid, according to NED (Karachentsev & Makarov KM96 (1996)) and the motion of the LG to the Virgo cluster with a peculiar velocity of 250 km s-1 (Huchra Huchra88 (1988); Klypin et al. Klypin01 (2001)). The Hubble constant is accepted as 75 km s-1 Mpc-1.
The mass of neutral hydrogen in Table 2 is derived directly from the value of integrated flux in the line of 21 cm (HI) with the use of the standard formula:
| (1) |
where (HI) is in ⊙, (HI) – in Jykm s-1, and distance – in Mpc.
3.1 VV 080 = NGC 14 = Arp 235
3.1.1 General characteristics
VV 080 is a nearby galaxy with a rather asymmetric outer dumbell-like boundary (which makes it resemble an interacting double system on overexposed images). It has a smooth brightness distribution of outer parts, and a clumpy bright inner structure. With its blue luminosity, this galaxy is an intermediate between normal and dwarf irregulars. The earlier data on its P–V diagram along the major axis gave evidence that this is a single object (Arkhipova et al. 1987b ). Its H ii regions (star formation sites) are concentrated in the inner part of the galaxy with a diameter of 40″ (2.5 kpc). VV 080 is not very rich in neutral hydrogen: from the adopted distance and integrated H i flux (Table 2) it follows that (HI)3.910⊙, or (HI)/ 0.16 (in solar units).
3.1.2 Spectroscopy
Slit orientations (see Table 1) were chosen in order to cross the most prominent H ii condensations. Relative line intensities are presented in Table 3 for the brightest knot “a”. The 2D spectrum in the slit position with =125° and the 1D spectrum of knot “a” are shown in Fig. 1. Its line ratios reveal a significant extinction, corresponding to = 0.46 (see Table 3).
Unfortunately, the non-detection of the [O iii] 4363 line precludes a direct estimate of O/H in ionized gas of this galaxy. The parameter (which is the ratio of I(4959+5007)/(I(4959+5007)+I(3727)), used by Pilyugin (see section 2.3) for this galaxy is 0.26, which is outside the range (0.4,1.0), for which Pilyugin’s relationships for the upper branch are applicable. Therefore we do not use that method for this galaxy, and compare the values of 12+(O/H), derived by the other three methods. They give respectively 8.62 (for intermediate value of ionization parameter) for the McGaugh method, 8.50 for the Denicolo et al. method, and 8.62 for the van Zee et al. method. We accept 12+(O/H)=8.6 as the value most consistent with all three estimates. Ages of current starbursts in knots “a”, “c” and “d”, marked on the image and 2D spectrum, are in the range of Myr (Table 5).
3.1.3 Morphology and gas kinematics
44° of the spectral cut, crossing knots “a” and “b”, differs by 30° from the of the galaxy major axis. Its P–V diagram indicates very complex gas motion in the inner 2 kpc region. The small velocity gradient is interrupted by a negative ‘wave’ with an amplitude of 50 km s-1 in the region of knot “b”, seemingly revealing gas outflow (shell) from the region of active star formation (SF). The width of the H i 21-cm line of VV 080 exceeds 100 km s-1. The rotation velocity in Irr galaxies is usually observed to grow monotonously up to the optical borders of a galaxy. Then one might expect the mean velocity gradient to be about 10 km s-1 kpc-1, or only (20–25) km s-1 across the central emission region of the galaxy. In this case it would be hardly noticeable in the obtained spectra (see Fig. 2). It gives evidence that the inner velocity gradient exceeds the mean one along the radius of this galaxy.
Considering /2, where 51° (LEDA), as the minimal velocity of rotation at the optical radius of the galaxy, one may obtain lower limits of the total mass and mass-to-light ratio within the optical radius of 5 kpc: 610⊙, 2 solar units. Thus the total hydrogen mass does not exceed 8% of the dynamical mass of this galaxy.
3.1.4 Possible interaction with other galaxies
VV 080 has several neighbouring galaxies at the projected distances of less than 350 kpc, which implies that VV 080 belongs to a galaxy group. The most disturbing one is the SA(S)ab galaxy NGC 7814, 12 brighter (MB=-192), situated at the projected distance of about 300 kpc. Its radial velocity differs by =185 km s-1. Hence, the tidal effect of this galaxy can be sufficiently strong to trigger the observed SF burst in VV 080.
Since this paper deals mainly with observational data, there is no space to discuss in detail the strength of tidal action for each of the target galaxies. The respective formulae, their discussion and application to the problem of star formation (SF) trigger in blue compact galaxies (BCGs) can be found in the paper by Pustilnik et al. (2001a , P01). Here we briefly, just as an illustration, discuss the possible role of tidal interaction for VV 080.
Physical mechanisms of SF ignition, which take place in this galaxy, can be different. Here we have used the model suggested by Icke (Icke85 (1985)), which involves generation of shocks in galaxy gas with their subsequent dissipation and loss of gas stability. We use in the discussion below the value of threshold pericenter distance from P01, for which the tidal action should generate shocks: , where is the radius of gas disk of disturbed galaxy, is mass ratio of disturbing and disturbed galaxies, - rotation velocity at radius , - the “sound” speed of gas, or dispersion of gas velocities, accepted as typical value of 10 km s-1. The applicability of such estimates of had been tested earlier on the BCG sample from Taylor et al. (Taylor95 (1995)), for which faint companions were detected (see P01).
Since the H i radius of this galaxy is unknown, to estimate we accepted (as follows from several studies, e.g. Taylor et al. (Taylor95 (1995)), van Zee et al. (vanZee98 (1998))) that the H i-to-optical () radius ratio is 4 (here = is the galaxy radius, corresponding to the surface gas density of 0.5 ⊙ kpc-2), that is 20 kpc for VV 080. The rotation velocity, corrected for inclination, is ==73 km s-1. The mass ratio can be estimated to a first approximation from the luminosity ratio of NGC 7814 and VV 080, taking into account the brightening of VV 080 due to current SF activity. We accept that is at least 05. Thus, for =12+05=17, 5. With these values we get =190 kpc. As emphasized in P01, when checking the neighbouring galaxies as potential disturbers, which tidally trigger starbursts, we need to account for significant delay between the time of maximal action and the subsequent response revealing itself as a gas collapse. This delay can reach hundreds of Myr. During this time the distance between interacting galaxies will grow by a characteristic value of the order of 100 kpc. Summing the estimated and expected we come to 300 kpc, close to the observed projected distance between VV 080 and NGC 7814.
Of course, the above estimates cannot be considered as strict evidence for triggering of SF by the tidal action of NGC 7814 on the gaseous disk of VV 080, especially if we take into account the absence of its H i map. We just want to demonstrate using the example of VV 080 that a simple scheme of such interaction, already checked for one type of galaxy with active SF, may be applied to our galaxies. As we see, in the case of VV 080 this scheme does not contradict the available data on this object.
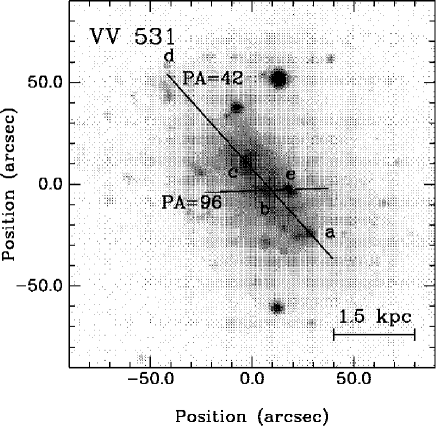
3.2 VV 531 = NGC 1156 = UGC 2455
3.2.1 General characteristics
VV 531 is a rather bright galaxy of IBm type with a strong emission spectrum. Unlike the other galaxies considered in this paper, VV 531 is classified as well isolated, being in the Karachentseva et al. (Kara86 (1986)) list of isolated galaxies. The distance to this galaxy, estimated from its individual brightest stars, is 7.8 Mpc (Karachentsev et al. Kara96 (1996)). These authors claim that this galaxy can be considered as ”the best example of an actually isolated galaxy in a general field”.
The size of the bright inner part of VV 531, containing numerous H ii regions, is 60″ (2.3 kpc). Elmegreen & Salzer (Elm99 (1999)), using H observations, marked about 20 large H ii complexes in this galaxy. This actively star-forming area is surrounded by an extended envelope of low surface brightness, which makes the galaxy rather large: its optical diameter exceeds 7 kpc.
Integrated blue colour indexes of VV 531 obtained by Esipov et al. (Esipov91 (1991)) (=056, =-040) are consistent with a strong starburst in this galaxy. In many aspects VV 531 is reminiscent VV 080. Their general structure, luminosities, and axial ratios are rather similar.
A high S/N 21-cm line H i profile and integrated H i-flux is presented by Haynes et al. (Haynes98 (1998)), from which we derive its full H i mass. A detailed H i map of this galaxy was obtained with the Westerbork Synthesizing Radio Telescope (WSRT) and some of the results were given by Broeils & van Woerden (BvW94 (1994)). For more details, they are presented on the web-site of Westerbork H i survey of spiral and irregular galaxies (WHISP).111http://www.astro.rug.nl/whisp/Database/ OverviewCatalog/ListByName/U2455/u2455plot.gif The description below is based on the figures from this web-page. Its full extent on the column density of 2 atom cm-2 is 9′7′. The major axis orientation of H i disk is close to the Eeast-West direction. The H i velocity field shows clear rotation with the velocity amplitude of 50 km s-1 at the distance of 2′ from the galaxy center. Both data by Haynes et al. (Haynes98 (1998)) and from the WHISP show a small but clear asymmetry in its global H i profile, appearing as some excess flux on the approaching side of the profile at 320–330 km s-1. This indicates either a faint additional source in the telescope beam, or disturbed motion in the galaxy. Such a feature (at 3′ to the East of the galaxy center) is well retraced on both H i brightness and velocity maps with full resolution (left column), and in the P–V diagram along major axis (upper-right box). We return to this point in Section 3.2.4.
3.2.2 Spectral properties
Two spectra were obtained using both higher and lower spectral resolutions for slit s of 42° and 96° (see Figure 3). The former orientation is close to the direction of the VV 531 optical major axis. Relative line intensities for its brightest knot ‘e’ are presented in Table 4. The H over H intensity ratio reveals significant extinction: C(H) = 0.470.10 dex. The latter corresponds to = 032007. This value is rather consistent with the foreground Galaxy extinction = 022 in the direction of VV 531, as indicated in NED according to Schlegel et al. (Schlegel98 (1998)). This in turn implies that if additional extinction is present in that H ii region, its internal C(H) at most amounts to dex.
The estimate of the O/H value shows that this galaxy is moderately poor in heavy elements: we found for knot “e” by the classical method (O/H) = 8.17, which is close to the value 8.23 derived for this galaxy by Vigroux et al. (Vigroux87 (1987)).
SF bursts across the body of VV 531 are rather well synchronized. Ages of instantaneous starbursts (derived with the same IMF parameters, as for VV 080 and VV 499 above) in the four knots picked up in our observations, as estimated from the (H) (see Table 5), fall in the range of 4.0 to 7.3 Myr. The age of the youngest knot “e”, situated near the galaxy center, is consistent with the discovery of WR spectral features in it (Ho et al. Ho95 (1995)). Unfortunately, the S/N in our spectrum of this knot is not sufficient to confirm this result.
3.2.3 Kinematics of gas
Fig. 4 shows the line-of-sight velocity distributions along the 42° and 96°. It is worth noting that the major axis orientations in optical light ( 42°) and in the H i radio image (90°) differ significantly. For both s, global velocity gradients of ionized gas cannot be reliably determined: they are masked by significant velocity swings presumably due to the appearance of supershells near SF regions (see section 3.4.3 for a similar case in VV 131). The velocity amplitude of such variations in VV 531 reaches 50 km s-1.
The small velocity gradient agrees with the earlier estimate of the maximal line-of-sight component of the velocity of rotation at radial distances (about 25 km s-1) obtained from H observations by Karachentsev & Petit (Kara90 (1990)). Hence, the observed small-scale velocity irregularities of ionized gas are comparable to or exceed the amplitude of the rotation velocity in the inner region with a diameter of 1.5′-2.0′. This is fully confirmed by the P–V diagram along the major axis of the H i WSRT image.
The total mass estimate within the optical diameter can be found from the H i linewidth W20. Half of its value can be accepted as an upper limit of circular rotation velocity for this radius. With the values adopted from LEDA of =113 km s-1 and inclination angle =42°, one may obtain (within ) 6⊙. Then the upper limits of and / ratios are about 2 and 0.2, consistent with the range of these parameters for Irr galaxies. The results will not change much if we take =130 km s-1 from H i profile obtained at WSRT - in agreement with their velocity field of this galaxy.
Note, however, that the density profile of H i in VV 531 reveals an inner, dense part (corresponding to the region of intense star formation 1′ or 2.3 kpc) with a surface density of (10–20)⊙ pc-2 and a very extended rarefied gas envelope exceeding the optical size of the galaxy (Broeils & van Woerden BvW94 (1994)). If, following Karachentsev & Petit (Kara90 (1990)) and this work, we accept the value of 25 km s-1 as an upper limit for the line-of-sight component of rotation velocity at 1′, the virial mass of this region is 8.5⊙. The gas surface density profile shows that the hydrogen mass within this radius is (1.5–3)⊙, or (20–40)% of the dynamical mass. This implies that active star formation in this galaxy is related to the region of very high concentration of neutral gas. This is similar to the conclusions reached by Taylor et al. (Taylor94 (1994)) and van Zee et al. (vanZee01 (2001)).
3.2.4 Environment properties
Since VV 531, as mentioned above, is well isolated, its environment, by definition, is not rich. In particular, Karachentsev et al. (Kara96 (1996)) indicate it as the nearest to VV 531 galaxies UGC 2684 and UGC 2716 with close radial velocities, situated at projected distances more than 10°, which corresponds to linear distances of more than 1.3 Mpc. Such isolation, if real, would give one more example of strong spontaneous SF activity in gas-rich dwarf galaxies and form the basis for more active analysis of non-interaction triggers of starbursts.
Note, however, that visual isolation criteria based on catalogs of known rather bright galaxies is in general not sufficient to address this issue. Many instructive examples of detection of lower mass companions with sufficiently strong tidal action near “isolated” galaxies with enhanced SF (e.g., Taylor et al. Taylor93 (1993, 1995); Pustilnik et al. 2001a ) indicate that this question needs more careful consideration. Even actively star-forming galaxies (BCGs), situated in voids, delineated by bright galaxies, often have nearby low-mass companions disturbing their gas disks (e.g., Pustilnik et al. 2002a ; 2002b ).
In particular, some indications of possible low-mass companions of VV 531 appeared in the so-called “Arecibo Slice” – a blind H i survey by Spitzak & Schneider (Spitzak98 (1998)). This survey is a 1° wide declination strip centered at the declination 1.7° to the South of the position of VV 531. It detected 2 rather faint sources (designated in NED as [SS98] 73 and LEDA 169969) at 1.5° and 3.2° from the position of VV 531, with radial velocities of 411 and 469 km s-1, and estimated H i-masses of 1.0 and 1.7⊙ (for accepted distance of 8 Mpc). Their projected distances are much lower than those for the UGC galaxies mentioned above, only 200 and 400 kpc. Having in mind that the “Arecibo Slice” probed only a small part of the sky around VV 531, and despite this detected two dwarfs in the vicinity of VV 531, we can expect that other similar dwarfs do exist in this region. Such low-mass “disturbers”, in order to affect significantly more massive galaxies, should either encounter them very closely (some ten kpc), or experience the so-called sinking satellite merger.
As we already noticed above, there is clear evidence of a small elongated H i feature responsible for the H i line asymmetry (Haynes et al. Haynes98 (1998); WHISP) which may be naturally explained if a small and very nearby object interferes with VV 531. This object is at 7 kpc from the VV 531 center, and one would naturally consider it as a sinking small satellite. Its gravitational action on the gas disk of VV 531 should be rather strong (e.g., Mihos & Hernquist MH94 (1994)). So, current multiple starbursts are probably being triggered by this object.
3.3 VV 499 = DDO 053 = UGC 4459
3.3.1 General characteristics
VV 499 is a 145 Irr-galaxy of unusually blue colour (according to LEDA, its extinction-corrected integrated colour is -0.48). Its integrated colour =0.45, according to Makarova (Makarova99 (1999),Makarova00 (2000)), is, however, rather typical of dI galaxies. This galaxy belongs to the Low Surface Brightness (LSB) class, since its central brightness =24.1 mag. arcsec-2 (Makarova Makarova99 (1999),Makarova00 (2000)).
This is a dwarf galaxy of very low luminosity ( –136) and very small optical diameter (1 kpc). Emission regions of VV 499 are situated along two parallel diffuse strips, with the western one of significantly lower surface brightness. Red DSS-2 image shows extended low brightness background between the strips and around them. Blue stars are observed not only in the strips, where their concentration is higher, but also in between (Schulte-Ladbeck & Hopp Regina98 (1998)). The highly irregular structure of star-forming regions is clearly seen in the HST image (see HST archive).
3.3.2 Spectrophotometry
Several spectra were obtained with the slit oriented at PA = 98°, 140° and 145° (see Figures 5 and 6). Line intensity ratios in knot “b” correspond to high excitation gas (19000 K). Bright emission lines detected in several knots over the galaxy body indicate that the galaxy has experienced recent starburst. According to Leitherer et al. (Starburst99 (1999)), the observed EWs(H) in knots “a”, “b” and “d” (see Tab. 5) correspond to the ages of instantaneous starbursts (with Salpeter IMF and and of 1 ⊙ and 100 ⊙, respectively) of 3–8 Myr. For =0.1 ⊙ the observed EWs(H) will correspond to even smaller ages. For the brightest knot “b” we derive value of O/H with the Te method – 12+(O/H)= 7.520.08, that is consistent with the value of 7.62 obtained by Skillman et al. (Skillman89 (1989)) by the empirical method. Notice that luminosity and O/H of DDO 053 match the “O/H versus ” relationship for dIrr galaxies suggested by Skillman et al. (Skillman89 (1989)).
The oxygen abundance of VV 499 assigns it to the group of very rare extremely metal-deficient gas-rich dwarfs. Izotov & Thuan (Izotov99 (1999)) argued that among such galaxies there may exist truly young local galaxies experiencing the first episode of star formation. However, the analysis of resolved stellar population from HST data indicates the presence of old RGB stars (Karachentsev et al. Kara02 (2002)), which implies that VV 499 is at least 3-Gyr old (L. Makarova, private communication). Its very low metallicity is probably a result of significant metal loss due to metal-enriched galactic wind.
3.3.3 Gas kinematics
Despite the observed appreciable small-scale velocity variations (Figure 6), a significant velocity gradient can be traced along the slit at =140°-145° (nearly parallel to the major axis). The observed amplitude amounts to 40 km s-1 for full extent of 65″. This is consistent with the observed FWHM of H i profile =30 km s-1 (Huchtmeier & Richter Huchtmeier89 (1989)). Taking into account that the slit did not pass through the center of the outer isophotes, and also the possible role of velocity dispersion, one can consider this amplitude as the lower limit of the expected line-of-sight component of circular velocity gradient. After the inclination correction (according to LEDA 45°), we obtain the amplitude of circular rotation of 28 km s-1. It results in the total mass within the radius 0.65 kpc 1.210⊙ and /3 solar units.
The galaxy is quite a gas-rich object. The total mass of H i (see Table 2) is 7.110⊙. Accounting for the mass fraction of He , we conclude that the gas mass is close to dynamical mass inside the optical diameter.
3.3.4 Environment and interactions
VV 499 is a member of the M 81 galaxy group, although there are no neighbouring galaxies of comparable luminosity within several optical diameters around it. The most recent HST Colour-Magnitude diagram-based (CMD) estimate of its distance is 3.56 Mpc (Karachentsev et al. Kara02 (2002)).
The M 81 group consists of two subgroups: M 81 itself at 3.7 Mpc from the Local Group (LG), with a radial velocity relative to the LG of =108 km s-1, and a subgroup of NGC 2403, at 3.2 Mpc and =267 km s-1, with the distance between these subgroups 1.0 Mpc (Karachentsev et al. Kara02 (2002)). VV 499, with its =150 km s-1 and =3.56 Mpc seems to belong to the M 81 subgroup. It is situated on the periphery of this subgroup, about 8.4° to the South-West of M 81, or 0.5 Mpc in projection, in the direction of subgroup of NGC 2403. Its distances to both subgroups are comparable. Tidal effect onto VV 499 of any separate galaxy belonging to these subgroups could be rather subtle. However, the tidal role of the whole subgroup M 81 (with a total mass of 10⊙, Karachentsev et al. Kara02 (2002)) is quite important (see, e.g., estimates in Pustilnik et al. 2001a ). The case of enhanced star formation in VV 499 probably has a relation to statistics of distant dwarf satellites of massive spirals, studied by Zaritsky et al. (Zaritsky97 (1997)). Most of those satellites are emission-line galaxies. We suggest that the likely trigger of current starburst in VV 499 is its tidal disturbance by M 81 subgroup(s) or/and interaction with intragroup gas.
3.4 VV 131 = UGC 4874 = PGC 26104
3.4.1 General characteristics
VV 131 is a rather small and poorly studied galaxy of SBm type. Its total magnitude is quite uncertain. The LEDA database gives =17602, or corrected =168, although there is some evidence that these values may be related only to the inner, brightest part of the galaxy. VV and UGC catalogs give uncorrected =160. This is close to =161, derived from the APM -magnitude, applying the empirical relation between calibrated CCD -magnitudes and APM -magnitudes, obtained by Kniazev et al. (Kniazev02 (2002)). Below we use =16005 (see Table 2).
Visually the galaxy looks like as inclined letter “” with a short bright bar and barely visible outer ellipse of low brightness with the major axis diameter of 1′.
There are several bright knots along the ring, one of which, located at the NW edge (knot “c” in Fig. 7) has its own PGC number (2790837). Nevertheless, it is quite evident that knot “c” is just one of several bright knots of the same galaxy. From our three slit positions we also have not found evidence of a probable star superimposed on this galaxy, as suggested in the UGC. At the adopted distance (39.6 Mpc), the linear diameter of the ring is 11 kpc. It seems that this ring was ignored while determining the position of the major axis and isophotal diameter of the galaxy, presented in the LEDA database. If we use the parameters presented in Table 2, the total corrected absolute -magnitude of the galaxy is =–171. Hence, VV 131 can be considered as a non-typical dwarf (by its luminosity) galaxy, possessing unusually regular structural features: a symmetric bar and a low surface brightness ring. Curiously, it looks very similar to the other 15-magnitude SBm galaxy UGC 634 (its nice -band image is given by van Zee vanZee00 (2000)). By analogy, VV 131 may also be classified as a dwarf low surface brightness barred spiral galaxy.
According to Schneider et al. (Schneider92 (1992)), the H i integrated flux of VV 131 is 9.3 Jykm s-1, which corresponds to total mass =3.4510⊙. The / ratio for this galaxy is unusually high (3 solar units), exceeding characteristic values for normal late-type galaxies by about a factor of six. Partly it may reflect the underestimation of the galaxy light in its low surface brightness extended outer regions. Note, however, that the formally found mean surface density of H i of VV 131 within its optical diameter (11 kpc) is unrealistically high: 4/36 ⊙ pc-2, which is more typical for the densest inner parts of blue compact dwarfs (van Zee et al. vanZee01 (2001)). Is this galaxy surrounded by an extended H i cloud? The overestimation of H i mass of VV 131 due to the probable confusion from the nearby galaxy UGC 4868 seems not to play a significant role. Both galaxies were clearly detected in the H i 21 cm line independently, and the measured integrated H i flux of UGC 4868 is about a half of that for VV 131 (Schneider et al. Schneider91 (1991)). Thus, the unusually high gas content of this galaxy deserves further detailed study.
3.4.2 Element abundances
The presence of the faint [O iii] line 4363 Å (see Figure 7) allows us directly to estimate the electron temperature of H ii regions and to determine O/H. It was found to be 12+(O/H)=7.850.06 (1/12 ⊙)222We adopt solar oxygen abundance as 12+(O/H)=8.92, according to Anders & Grevesse (Anders89 (1989)).. Hence, VV 131 may be considered as a low-metallicity dwarf ring galaxy. The element ratios Ne/O and N/O (Table 3) for this region are consistent with the typical values for metal-poor galaxies, –0.7 and –1.5 dex, respectively, as summarized by Izotov & Thuan (Izotov99 (1999)).
3.4.3 Kinematics and mass estimation
We got for this galaxy P–V diagrams (Fig. 8) along the slits with 46°, 103° and 158° (see Fig. 7). All three slit positions went through the central part of the galaxy (knot “a”). The other bright features are marked as “b”, “c”, “d”, “e” and “f” in Fig. 7; the respective peaks in distribution of H intensity are marked in Fig. 8. For knot “a”, as expected, we derive a radial velocity of km s-1, very close to the systemic velocity of VV 131 presented in Table 2.
P–V diagrams for all three s show significant deviations from smooth curves, which correlate in positions with peaks in distribution of H intensity. Characteristic sizes (FWZI) of such deviations are 5″–10″, corresponding to linear sizes of 1–2 kpc. Their velocity amplitudes are in the range of 20–40 km s-1. These values correspond to parameters of ionized gas supershells observed in many galaxies with active SF (e.g., Marlowe et al. Marlowe95 (1995), Martin Martin96 (1996),Martin97 (1997)). Such supershells originate as a result of the cumulative action of massive star winds and SNe related to individual starbursts with a sufficiently large number of massive stars (e.g. Pustilnik et al. 2001b ,2002b ).
Global distribution of velocity along the galaxy body is best seen on the P–V diagram along 46°, which is close to the direction along the galaxy major axis. Despite the significant deviations near bright H ii regions, a gradient with full amplitude of 110–120 km s-1 over 60″ (11.5 kpc) is clearly seen. It agrees remarkably well with the full width on the level of the 20% of maximum of the H i 21-cm line profile: =1147 km s-1 (Schneider et al. Schneider91 (1991)). Rotation curves, determined from mapping of dwarf galaxies in the 21-cm line, are usually traced to much larger distances than the optical radius of a galaxy. The coincidence of and H-velocity amplitude implies that rotation curve of VV 131 reaches its maximal value at the radii, close to those sampled by our long-slit spectrum.
Adopting that the internal form of observed ring is a circle, from the apparent ratio =0.5 we can determine inclination angle 60°. Then, the true rotation velocity will read as a half-amplitude (57 km s-1) divided by , that is km s-1.
The total mass of a galaxy, defined as , within the radius of 6 kpc is (6.01.2)10⊙. This estimate implies that neutral gas (whose total mass, including the He mass-fraction of 0.25, is 4.610⊙) can be one of the main dynamical components inside the radius of 6 kpc. However, while the radial density distribution of neutral gas is unknown, it is possible that only a fraction of gas mass is bounded in this region.
Thus, we may conclude that VV 131 is a low-luminosity low-mass galaxy with bar and ring structures, with SF activity taking place both near the center (along the bar) and in the ring.
3.4.4 Environment and interaction
The abovementioned neighbouring galaxy UGC 4868 is classified also as SBm (e.g., Schneider et al. Schneider91 (1991)). This galaxy has about the same luminosity and very similar width of H i profile (=120 km s-1 versus 114 km s-1 for VV 131). Hence, the total masses of these two galaxies are comparable. Its location at the projected distance of only 6′ (65 kpc, or 6 optical diameters) to the SW of VV 131, and the small relative radial velocity (=17 km s-1) suggests that VV 131 was disturbed by this galaxy during their recent encounter. Bar structures can quite easy form in HSB (High Surface Brightness) disks as a result of strong perturbations during close encounter (e.g., Mihos et al. Mihos97 (1997)). Subsequently, bars can trigger the enhanced SF activity in these galaxies. The observed bar in VV 131 and several knots with significant SF seem to well match model expectations.
For UGC 4868, also having significant a bar and highly disturbed outermost isophotes, no prominent SF bursts are seen. Probably this is related to different delay time for development of strong perturbation and subsequent gas collapse after the moment of pericenter passage in these two dwarf galaxies. The latter is related to rotation periods of the galaxies involved (T600 Myr), and can easily differ by several tens to a hundred Myr. As regarding unusual structures, seen in dwarf galaxy VV 131, we suggest that it is a transient structure appearing as a result of recent strong disturbance.
3.5 VV 523 = NGC 3991 = UGC 6933
3.5.1 General characteristics
VV 523 belongs to the category of clumpy irregulars (Casini & Heidmann CH76 (1976)), which are characterized by very clumpy structure and by active star formation. Together with the nearby NGC 3994 and NGC 3995 it forms a triplet of interacting galaxies. The galaxy is seen nearly edge-on, and unlike most disky galaxies, it does not have a noticeable bulge. By this reason it looks like a chain of small galaxies in contact. Its morphology also resembles some comet-like blue compact galaxies. Spectral observations clearly indicate that this is a single object. A strong high excitation emission-line spectrum and unusually blue colour of VV 523: (=–033), along with high FIR luminosity, far exceeding the optical one (Hecquet et al. Hecquet95 (1995)), reveal very intense star formation all over the galaxy. Its blue luminosity is unusually high for Irr galaxies (–210), especially if we account for some internal extinction due to its almost edge-on orientation. Evidently its outstanding blue luminosity is related to its young (5–6 Myr, see Table 5) powerful starburst.
Optical observations of this galaxy were described in several papers. The most detailed investigations were presented by Hecquet et al. (Hecquet95 (1995), see also references there to earlier works). These authors carried out -photometry (including photometry of individual clumps) and long-slit spectroscopy to study kinematics, physical conditions in ionized gas and its oxygen abundance. Using evolutionary population synthesis models, they came to the conclusion that evolution of this galaxy is characterized by discrete starbursts rather than by continuous star formation.
3.5.2 Spectral observations
Two observations of VV 523 were carried out with the lower and higher spectral resolutions. In both cases the slit was oriented along the main body of the galaxy (see Figure 9). Line ratios and other parameters of ionized gas are presented in Table 4 for the brightest condensation “d”. Results of our spectrophotometry are consistent in general with those from Hecquet et al.’s (Hecquet95 (1995)) for this knot, but are more deviant for the fainter components. We concentrate further on analysis of the data for knot “d”, where the highest S/N ratio was reached. The largest difference between our and Hecquet et al. spectrophotometry for this knot is for the intensity of [O ii] 3727 line, which is a factor of 3 lower in our spectrum in comparison to their value. These authors indicate that their accuracy in blue reaches 30%. We do not exclude that such large difference in the [O ii] 3727 relative intensity is partly caused by slightly different position angle of the long slit (our PA=33° and their PA=31°) and probably different slit width (not indicated in their paper). However, since for the other knots we have similar large differences in the relative intensities of this line, we suggest that their real errors of flux calibration in UV were significantly higher.
Our estimates of O/H are quite uncertain, since the line [O iii] 4363 in our spectrum is barely detected. Hecquet et al. (Hecquet95 (1995)) give for knot “d” (their region “C”), based on the empirical method of Edmunds and Pagel (EP84 (1984)), the value of 12+(O/H)=8.430.20. Our estimate of this value by the classic method is of very low accuracy: 8.330.30. We used also the Pilyugin (Pilyugin01 (2001)) empirical -method, devised for “high” metallicity H ii regions. With the use of this method, 12+(O/H)=8.76. From these two values we combine some ‘average’ 12+(O/H)=8.65 with probable uncertainty of 0.2 dex.
Parameter in all four knots according to our measurements is consistent within the uncertainties of the order of 0.1 with the constant value of 0.10 dex. This implies (despite the edge-on orientation) only a small attenuation of starburst light. The data show that VV 523 fits in general to the - relation for Irr galaxies. Correction of its for significant enhancement due to current starburst will produce an even better match.
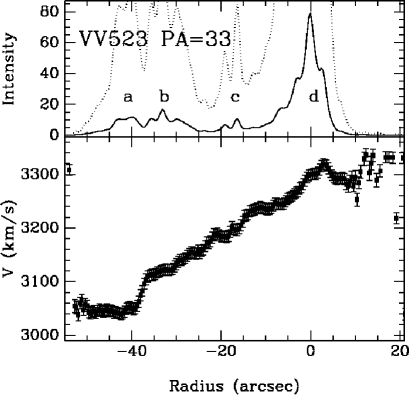
3.5.3 Gas kinematics
The line-of-sight velocity distribution along the slit is shown in Fig. 10. Rotation velocity changes linearly, although some distortions of the P–V diagram with the amplitudes of 30–40 km s-1 are noticeable in the regions of knots “a” and “d”, suggesting the existence of ionized gas shells.
The observed velocity distribution along the whole body of VV 523 mimics a solid-body rotation, which is often observed in edge-on late-type galaxies. This linearity may be naturally explained as a result of inner absorption, which hides the H ii regions located near the line of nodes, where the Doppler component of velocity of rotation is maximal. This absorption effect, however, should be small in the outer regions, so that the velocity difference between the opposite edges of the galaxy remains close to twice the maximal velocity of rotation. Note also, that, as shown, e.g., by Keel (Keel93 (1993)), the large extent of the rising part of a galaxy rotation curve can be indicative of strong disturbance, which changes its normal shape (usually it looks like a solid-body only in the central part, and further from the center the velocity gradient becomes small).
According to our data (see Fig. 10), the full amplitude of the velocity change along the slit on the extent of 73″ is about 290 km s-1. This is a bit higher than the value of =24512 km s-1 from LEDA. Taking half of the optical value given above as the rotation velocity of the outer parts of VV 523, one can derive the total mass within its optical diameter =86″ (19 kpc). Note that the RC3 catalog gives =87″, consistent with the value in Table 2. This mass is 4.610⊙. Since the appearance of this galaxy is quite unusual, it is interesting to look for the ratio / in comparison to other disk galaxies. Taken at face value it amounts about 1.3. Presumably, some corrections should be applied to account for the significant contribution of blue light from young SF regions, on the one hand, and possible obscuration within the galaxy disk, on the other hand. The visual appearance of the brightest SF regions with respect to the rest of the galaxy body implies that they contribute more than a half of the -band total light. This means that for the underlying stellar population / should be larger than 2.6. On the other hand, due to its almost edge-on orientation, the extinction in this underlying disk can reach 10. This implies that non-bursting /1. This value is compatible with the model values for stellar population of typical late-type galaxies of near-solar metallicity and almost constant SFR (e.g., Bell & de Jong BdJ00 (2000)).
The hydrogen content appears to be rather high in VV 523. If all H i was concentrated within the optical radius, the ratio / would be 0.18. Accounting for the helium mass fraction, the neutral gas mass fraction can reach 0.24. In reality its significant portion can spread far beyond the optical radius.
3.5.4 Environment and interactions
As indicated above, VV 523 is a member of a triplet. Other members have comparable luminosity and mass. The projection distance of VV 523 to its neighbours is 50 kpc.
Interaction-induced SF in sufficiently close systems, including gas-rich disk galaxies, was studied in detail by several authors (e.g., Keel Keel93 (1993), Bernloehr Bernloehr93 (1993)). In particular, for VV 523, kinematics of ionized gas was analyzed by Keel (Keel85 (1985), Keel93 (1993), Keel96 (1996)) among many other galaxy pairs. Compelling evidence of interaction-induced disturbances in VV 523 may include the abovementioned solid-body rotation curve for at least a half of the visible disk extent and also the clearly seen optical disk warps. Hecquet et al. (Hecquet95 (1995)) come to similar conclusion on the interaction-induced SF in this galaxy.
4 Summary and conclusions
One of the most important questions concerning the nature of “nest” and “chains” type VV galaxies is their evolution status. Current study, as well as several previous publications, demonstrate that most of the low-luminosity VV galaxies which appeared to be single, are relatively nearby irregular galaxies with several bright knots of enhanced star formation. As the line-of-sight velocity distributions along the slit reveal, such knots are often accompanied by gas outflows with velocities of several tens km s-1 and typical sizes between 0.1 and 2.0 kpc.
Visual inspection of the images of these galaxies shows that unlike more common irregular galaxies, in many single VV galaxies H ii regions are observed superimposed on the low surface brightness (LSB) background of underlying disks. This may give visual impression of a multiple system. The LSB nature of disks in some of these galaxies implies that the SF rate averaged over the lifetime of these galaxies is much lower than the present day one.
Several lines of evidence for the importance of weak interactions to trigger star formation in gas-rich disk galaxies are suggested during the last one and a half decade. Icke (Icke85 (1985)) probably was the first to have drawn attention on the importance of relatively weak interactions to trigger gravitational instability in gas disks via generation of shocks. Much observational evidence for the important role of weak interactions in triggering SF was obtained since that time, including detection of low mass H i companions of nearby H ii-galaxies (e.g., Chengalur et al. Chengalur95 (1995); Taylor et al. Taylor93 (1993), Taylor95 (1995); Taylor Taylor97 (1997)) and optical faint companions of BCGs (Pustilnik et al. 2001a , Noeske et al. Noeske01 (2001)). Recent results on late spirals by Reshetnikov & Combes (Reshet97 (1997)) and Rudnick et al. (Rudnick00 (2000)) also suggest the importance of weak interactions in modulation of the SF history of gas-rich galaxies.
Our analysis of several single VV galaxies shows that weak interactions can be an important factor shaping the appearance of this type of object. In particular, such interactions should presumably trigger starbursts in the galaxies VV 080 and VV 523, belonging to groups. Close neighbour of comparable mass to the galaxy VV 131 may also be an efficient disturber to ignite active star formation in the latter object. Finally, provisional identification of a sinking satellite near VV 531 as a tidally disturbing object can explain its synchronized SF in many regions. All these examples indicate the importance of interactions to trigger starbursts in the majority of VV galaxies studied.
From the observational data presented above and their analysis, along with published data we draw some preliminary conclusions:
-
•
Spectrophotometry and study of ionized gas kinematics of single VV galaxies shows that their properties drastically depend on their luminosity. Low luminosity representatives of our sample are in general metal-deficient objects with as low as 1/25–1/10 ⊙. They show rather low amplitudes of overall gas motions with superimposed velocity perturbations, correlated with positions of enhanced H emission. In this aspect they are similar to dwarf irregular and blue compact galaxies. Luminous VV galaxies appear significantly more evolved (with of 1/3–1/2 ⊙) and with a well traced systematic change of the line-of-sight velocity with the radial distance, caused by rather fast rotation.
-
•
The extremely low metallicity is now fixed for galaxy VV 499 (DDO 053) (12+(O/H) = 7.520.08). This value is consistent with the estimate obtained with the empirical method by Skillman et al. (Skillman89 (1989)). With its very low metallicity and high / ratio, VV 499, along with the dwarf irregular UGC 4483, is probably one of the least evolved galaxies in the nearby M 81 group.
-
•
For all our studied VV galaxies with enhanced star formation, more or less evident objects exerting sufficiently strong tidal disturbance (that still in most cases can be classified as a weak tidal) are identified. They include either sufficiently massive galaxies (as for VV 080, VV 131, VV 523), or a group at the distance of a few hundred kpc (VV 499). In the case of a very “isolated” galaxy (VV 531), there is some evidence of a small sinking satellite. This indicates that weak interactions can be a trigger mechanism of SF activity at least in a substantial fraction of VV galaxies studied.
Acknowledgements.
The authors appreciate partial financial support from the Russian federal scientific-technical program (contract 40.022.1.1.1101). A.Burenkov thanks RFBR for partial support through the grant 01-02-16809. The authors thank the anonymous referee for useful suggestions, which helped to improve the paper. In this research the NASA/IPAC Extragalactic Database (NED) was used, which is operated by the Jet Propulsion Laboratory, California Institute of Technology, under contract with the National Aeronautics and Space Administration, and the Lyon-Meudon Extragalactic Database LEDA.References
- (1) Afanasiev, V.L., Karachentsev, I.D., Arkhipova V.P., et al. 1980, A&A, 91, 302
- (2) Afanasiev, V.L., Burenkov, A.N., Vlasyuk, V.V., & Drabek, S.V. 1995, SAO RAS internal report No. 234
- (3) Aller, L.H. 1984, Physics of Thermal Gaseous Nebulae, Dordrecht: Reidel
- (4) Anders E., & Grevesse N. 1989, Geochim. Cosmochim. Acta, 53, 197
- (5) Arkhipova, V.P., & Esipov, V.F. 1979, SvAL, 5, 140
- (6) Arkhipova, V.P., Afanasiev, V.L., Dostal’, V.A., et al. 1981, SvA, 25, 277
- (7) Arkhipova, V.P., Noskova, R.I., Sil’chenko, O.K., & Zasov, A.V. 1987a, SvAL, 13, 240
- (8) Arkhipova, V.P., Zasov, A.V., & Noskova, R.I. 1987b, SvA, 31, 120
- (9) Arkhipova, V.P., Zasov, A.V., Noskova, R.I., & Sil’chenko, O.K. 1987c, SvA, 31, 609
- (10) Bell, E.F. & de Jong, R.S. 2000, ApJ, 550, 212
- (11) Bernloehr, K. 1993, A&A, 268, 25
- (12) Broeils, A.H., & van Woerden, H. 1994, A&AS, 107, 129
- (13) Casini, C, & Heidmann, J. 1976, A&A, 47, 371
- (14) Chengalur, J.N., Giovanelli, R., & Haynes, M.P. 1995, AJ, 109, 2415
- (15) Denicolo, G., Terlevich, R., & Terlevich, E., 2002, MNRAS, 330, 69
- (16) Edmunds, M.G., & Pagel, B.E.J. 1984, MNRAS, 211, 507
- (17) Elmegreen, D.M., & Salzer, J.J. 1999, AJ, 117, 764
- (18) Esipov, V.F., Kyazumov, H.A., & Jafarov, A.R. 1991, SvA, 35, 452
- (19) Haynes, M.P., Hogg, D.E., Maddalena, R.J., Roberts, M.S., & van Zee, L. 1998, AJ, 115, 62
- (20) Hecquet, J., Augarde, R., Couinot, G., & Auriere, M. 1995, A&A, 298, 726
- (21) Ho, L.C., Filippenko, A.V., & Sargent, W.L.W. 1995, ApJS, 98, 477
- (22) Huchtmeier, W.K., & Richter, O.-G. 1989, A General Catalog of H i Observations of Galaxies. Springer-Verlag
- (23) Huchra, J.P., in ASP Conf. Ser. 4: The Extragalactic Distance Scale. p.257
- (24) Icke, V. 1985, A&A, 144, 115
- (25) Izotov, Y.I. & Thuan, T.X. 1999, ApJ, 511, 639
- (26) Izotov, Y.I., Thuan, T.X., & Lipovetsky, V.A. 1994, ApJ, 435, 647
- (27) Izotov, Y.I., Thuan, T.X., & Lipovetsky, V.A. 1997, ApJS, 108, 1
- (28) Karachentseva, V.E., Lebedev, V.S., & Shcherbanovskii, A.L. 1986, CDS Bull., N30, 125
- (29) Karachentsev, I.D., & Petit M. 1990, A&A, 86, 1
- (30) Karachentsev, I.D., & Makarov, D.I. 1996, AJ, 111, 794
- (31) Karachentsev, I.D., Musella, I., & Grimaldi, A. 1996, A&A, 310, 722
- (32) Karachentsev, I.D., Dolphin, A. E., Geisler, D., et al. 2002, A&A, 383, 125
- (33) Keel, W.C. 1993, AJ, 106, 1771
- (34) Keel, W.C. 1996, ApJS, 106, 27
- (35) Keel, W.C., Kennicutt, R.C., Hummel, E., & van der Hulst, J.M. 1985, AJ, 90, 708
- (36) Klypin, A., Hoffman, Y., Kravtsov, A., & Gottlöber, S. 2002, ApJ, in press = astro-ph/0107104
- (37) Kniazev, A.Y. & Shergin, V.S. 1995, Internal Report SAO RAS, 249, 1
- (38) Kniazev, A.Y., Pustilnik, S.A., Ugryumov, A.V., & Kniazeva, T.F. 2000, Astronomy Letters, 26, 129
- (39) Kniazev, A.Y., Pustilnik, S.A., Ugryumov, A.V., et al. 2002, in preparation
- (40) Leitherer, C., Schaerer, D., Goldader, et al. 1999, ApJS, 123, 3
- (41) Makarova, L.N. 1999, A&AS, 139, 491
- (42) Makarova, L.N. 2000, Ph.D. thesis, SAO, Nizhnij Arkhyz
- (43) Marlowe A.T., Heckman, T.M., Wyse, R.F.G., & Schommer, R. 1995, ApJ, 438, 563
- (44) Martin C. 1996, ApJ, 465, 680
- (45) Martin C. 1997, ApJ, 491, 561
- (46) Massey, P., Strobel, K., Barnes, J.V., & Anderson, E. 1988, ApJ, 328, 315
- (47) McGaugh, S. 1991, ApJ, 380, 140
- (48) Mihos, J.C., & Hernquist, L. 1994, ApJ, 425, L13
- (49) Mihos, J.C., McGaugh, S.S., & de Blok, W.J.G. 1997, ApJ, 477, L79
- (50) Noeske, K.G., Iglesias-Páramo, J., Vilchez, J.M., Papaderos, P., & Fricke, K.J. 2001, A&A, 371, 806
- (51) Pagel, B.E.J., Edmunds, M.G., Blackwell, D.E., Chun, M.S., & Smith, G. 1989, MNRAS, 189, 95.
- (52) Pilyugin, L.S. 2001, A&A, 369, 594
- (53) Pustilnik, S.A., Kniazev, A.Y., Lipovetsky, V.A., & Ugryumov, A.V. 2001a, A&A, 373, 24
- (54) Pustilnik, S.A., Kniazev, A.Y., Ugryumov, A.V. et al. 2001b, ApSS Suppl., 277, 109
- (55) Pustilnik, S.A., Martin, J.-M., Huchtmeier, W. et al. 2002a, A&A, 389, 405
- (56) Pustilnik, S.A., Kniazev, A.Y., Pramskij, A.G., Ugryumov, A.V., & Masegosa, J. 2002b, A&A, in press
- (57) Reshetnikov, V., & Combes, F. 1997, A&A, 324, 80
- (58) Rudnick, G., Rix, H.-W., & Kennicutt, R. 2000, ApJ, 538, 569
- (59) Schlegel, D.J., Finkbeiner, D.P., & Douglas, M. 1998, ApJ, 500, 525
- (60) Schneider, S.E., Thuan, T.X., Magri, C. & Wadiak, J.E. 1990, ApJS, 72, 245
- (61) Schneider, S.E., Thuan, T.X., Mangum, J.G., & Miller, J. 1992, ApJS, 81, 5
- (62) Schulte-Ladbeck, R.E., & Hopp, U. 1998, AJ, 116, 2886
- (63) Shergin, V.S., Kniazev, A.Y., & Lipovetsky, V.A. 1996, Astron. Nachr., v.317, p.95
- (64) Skillman, E.D., Kennicutt, R.C., & Hodge, P.W. 1989, ApJ, 347, 875
- (65) Spitzak J.G., & Schneider S.E. 1998, ApJS, 119, 159
- (66) Taylor, C.L. 1997, ApJ, 480, 524
- (67) Taylor, C.L., Brinks, E., & Skillman, E.D. 1993, AJ, 105, 128
- (68) Taylor, C.L., Brinks, E., Pogge, R.W., & Skillman, E.D. 1994, AJ, 107, 971
- (69) Taylor, C.L., Brinks, E., Grashius, R.M., & Skillman, E.D. 1995, ApJS, 99, 427
- (70) van Zee, L. 2000, AJ, 119, 2757
- (71) van Zee, L., Salzer, J.J., Haynes, M.P., O’Donoghue, A.A., & Balonek, T.J. 1998, AJ, 116, 2805
- (72) van Zee, L., Salzer, J.J., & Skillman, E.D. 2001, AJ, 122, 121
- (73) Vigroux, L., Stasinska, G., & Comte, G. 1987, A&A, 172, 15
- (74) Vorontsov-Velyaminov B.A. Atlas and Catalogue of Interacting Galaxies. Part 1. Moscow Univ. Press., 1959.
- (75) Vorontsov-Velyaminov, B.A. 1977, A&AS, 28, 1
- (76) Vorontsov-Velyaminov, B.A. 1979a, SvAL, 5, 266
- (77) Vorontsov-Velyaminov, B.A. 1979b, SvAL, 5, 267
- (78) Zaritsky, D., Smith, H., Frenk, C., & White, S.D.M. 1997, ApJ, 478, 39 and 53
- (79) Zasov, A.V., Kniazev, A.Y., Pustilnik, S.A., et al. 2000, A&AS, 144, 429 (Paper I).