Cosmic star formation history associated with QSO activity: an approach using the black hole to bulge mass correlation
Abstract
The tight correlation between the masses of central black holes and their host spheroids in nearby galaxies and active galactic nuclei (AGN) suggests that black hole growth is closely related to their spheroid formation. Based on our previous work regarding such a joint evolutionary scheme and the consequential black hole to bulge mass correlation, we use the X-ray luminosity function of AGN and the cosmological evolution rate which are from ROSAT X-ray surveys to estimate the cosmic star formation history associated with the black hole growth. By the basic assumption that the major black hole growth occurs during the luminous AGN phase, the luminosity function of AGNs as a function of redshift traces not only the accretion history of the black holes but also the cosmic star formation history of the spheroids.
Although the space density of the especially luminous QSOs is very low, we show that the total amount of star formation associated with the massive black hole growth is almost the same as that of Lyman Break Galaxies detected by the current optical deep surveys. We thus argue that the optical deep surveys may miss about half of the net star formation in our Universe. This is probably due to in part significant dust extinction as well as the small field of view of previous optical surveys which cannot sample such rare events with relatively short time scale. However, the far infrared emission from the dust heated by star formation on-going during the black hole growth could sufficiently account for the observed SCUBA number counts, and would be the probable dominating energy source of the SCUBA population.
1 Introduction
Recent observations reveal a tight correlation between the masses of central black holes and their host spheroids in nearby galaxies and AGNs (Kormendy & Richstone, 1995; Faber et al., 1997; Magorrian et al., 1998; Laor, 1998; Ho, 1999; Wandel 1999a, ). A mean value of the black hole to bulge mass ratio, and the local black hole mass density, are now fairly agreed upon by observations using different techniques (Salucci et al., 1999; Kormendy & Gebhardt, 2001; Merritt & Ferrarese, 2001; McLure & Dunlop, 2002). This correlation implies a possible scenario where the black hole accretion history in the inner few parsecs and the scale star formation during spheroid formation are closely connected. Simply speaking, the amount of gas accreted to grow the central black hole is proportional to the amount of gas driving the star formation to populate the spheroid within a similar time scale of the two activities (Wang & Biermann, 1998; Wang et al., 2000; Haehnelt & Kauffmann, 2000; Monaco et al., 2000; Burkert & Silk, 2001; Page et al., 2001).
This relation also opens an important avenue to the understanding of the cosmic star formation history (CSFH) associated with the black hole growth by accretion, complementary to the previous optical/near-infrared (NIR) or far-infrared deep surveys.
The study of the CSFH from the optical/NIR deep surveys describes only the unobscured star formation in galaxies, and may be blind to activities during the massive spheroid formation because of the significant dust extinction or the small field of view (Madau et al., 1996; Steidel et al., 1996; Connolly et al., 1997; Steidel et al., 1999). In fact, our knowledge of the cosmic star formation history, especially at high redshift, has dramatically changed in the last few years due to the results of the far-infrared and submillimeter deep surveys. The compelling lines of evidence show that the absorption and re-radiation of light by dust in the early epoch of galaxy formation and evolution is significant (Puget et al., 1996; Guiderdoni et al., 1997; Schlegel et al., 1998; Fixsen et al., 1998; Hauser et al., 1998; Sanders, 1999; Barger et al., 1999).
Although the observations at far-infrared and submillimeter wavelengths may help to unveil the early dusty star formation epoch, it is still a very difficult job to obtain an unbiased view of the early star formation history from these luminous infrared systems due to the rather poor angular resolution of SCUBA and to the faintness of the optical counterparts (Blain et al. 1999a, ; De Zotti et al., 2001).
The main purpose of this paper is to fairly reconstruct the global star formation history associated with AGN accretion and give a proper estimation of the star formation activity during spheroid formation. We assume the X-ray luminosity of the AGN is powered by accretion onto a central massive black hole, especially during the luminous phase. Deep X-ray surveys provide a direct probe of the AGN accretion history, and the history of the black hole growth as well as the joint star formation, based on the assumption that the luminous AGNs reflect the stage of major black hole growth and spheroid formation (Boyle et al., 2000; Miyaji et al., 2000). In this paper, we trace the AGN evolution with the soft X-ray local luminosity function and the evolution rate by Miyaji et al. (2000), which gives an excellent fit to the ROSAT surveys of various depth, including the number counts and the soft X-ray background.
The X-ray view of the CSFH is recently discussed by several authors for normal spiral galaxies where the X-ray emission is dominated by a population of X-ray binaries, hot interstellar gas, or even low luminosity AGNs (LLAGNs) with fluxes about at energy band (Cavaliere et al., 2000; Ptak et al., 2001; Hornschemeier et al., 2002; Miyaji et al., 2002). It is not the purpose of this paper to give any constraints on the star formation in galaxies or LLAGNs. Instead, we study the intensive star formation associated with black hole growth in massive spheroids using the X-ray surveys. We adopt in the calculation: 1) a simple connection between the X-ray emission from AGNs and the black hole mass by assuming an Eddington ratio ; 2) the black hole to bulge mass correlation; 3) a similar time scale for the black hole growth and the intensive star formation populating finally the spheroids based on our previous work. The present day black hole density and the SCUBA number counts are used as two important model constraints in the calculation, with the set of cosmological parameters and .
2 Black hole mass distribution and the accretion history from ROSAT surveys
The mass accretion onto the central black hole is an efficient source of X-ray radiation, especially for the luminous AGNs. Although X-ray binaries can contribute as much as of the X-ray background (XRB) flux in the band, the bulk of the energy density of the XRB is certainly explained by AGNs (Mushotzky et al., 2000; Barger et al. 2001a, ; Giacconi et al., 2001). Thus, the deep X-ray surveys could present good opportunities for the study of accretion history of AGNs. We estimate the black hole mass from the X-ray luminosity by assuming an Eddington ratio , which is defined as the fraction of Eddington luminosity at which AGN radiate (). With the bolometric correction (), we find the black hole mass . is the AGN luminosity in units of and in units of . The black hole (BH) mass function at different redshifts is converted from the X-ray luminosity function by assuming reasonable values for the Eddington ratio and the “duty cycle ” of the AGN active phase. Following the findings of various AGN observations, depends weakly on the luminosity, where most luminous QSOs radiate at about the Eddington limit and low luminosity AGNs () show . We thus approximate ; is a scaling factor (Padovani, 1989; Salucci et al., 1999; Wandel, 1999). The “duty cycle ”, i.e. the fraction of black holes which are active at a given time of redshift , may be a function of several parameters, such as the redshift and the quasar light curves. In this work, we simply assume that each AGN shines for a constant time , , where is the redshift dependent Hubble time. This means that we simplify the QSO activity as a single significant burst with shining ratio and duration (Haiman & Menou, 2000). The QSO life time is adopted in this calculation, which is close to the e-folding time shown in theoretical models with the radiation efficiency , and consistent with the new results of Chandra for the QSO accretion duration (Wang & Biermann, 1998; Burkert & Silk, 2001; Barger et al., 2001).
Although there are a variety of AGN spectra in the current sample of ROSAT X-ray regime by Miyaji et al. (2000), non type 1 AGNs are only a small fraction of the total sample and excluding them does not change the main results significantly. In this case, we consider all AGNs in the sample of ROSAT soft X-ray regime by Miyaji et al. (2000) as unobscured type 1, and include a bolometric correction to convert X-ray luminosity to black hole mass . is adopted in our calculation based on the mean type 1 AGN spectral energy distribution from Elvis et al. (1994). The black hole mass function can be derived from the observed X-ray luminosity function by:
| (1) |
A Luminosity Dependent Density Evolution(LDDE) model is suggested by Miyaji et al.(2000), where the evolution rate drops with decreasing AGN luminosity, and provides a good representation of the available X-ray observational constraints. We follow the LDDE cosmological evolution for the ROSAT soft X-ray luminosity function , and trace the black hole mass density accreted during the active phase with lookback time.
However, there are several lines of arguments which suggest that the optical and soft X-ray surveys may miss a large number of type 2 AGNs, especially the high luminosity type 2 QSOs at high redshift (). Synthesis models of the X-ray background in particular require a large number of luminous obscured objects to reproduce the source counts at relatively bright fluxes (). The ratio of type 2 to unobscured type 1 Seyferts () and the luminous type 2 to type 1 QSOs are usually in the range of , in order to get a best fit of the available X-ray observations (Maiolino & Rieke, 1995; Fabian & Iwasawa, 1999; Gilli et al., 2001; Maiolino et al., 2001). Although the Chandra and XMM-Newton deep surveys have recently detected several examples of the type 2 QSOs, Alexander et al.(2001) suggests that their abundance is definitely much lower than what is expected by the XRB population synthesis models, and probably in a ratio of about (Norman et al., 2002; Stern et al., 2002; Hasinger et al., 2001; Akiyama et al., 2002).
Since the Miyaji et al. (2000) sample may represent only the population and evolution of the type 1 AGNs (i.e. type 1 Seyferts and type 1 QSOs), we adopt a reasonable fraction of obscured type 2 sources in our calculation to include the amount of star formation in the host galaxies of the obscured objects. Maiolino & Rieke (1995) derived an estimate for the ratio of the local absorbed to unabsorbed low luminosity AGNs around a value of 4. Unlike the absorption distribution of local Seyferts, the existence and abundance of the luminous type 2 QSOs is very uncertain. The difficulties are that: 1)some type 2 QSOs could be hidden in the Ultraluminous Infrared Galaxies (ULIGs) (Kim & Sanders, 1998); 2)although it is still to be verified, some type 2 QSOs appear as normal blue, broad-lined QSOs in the optical (Halpern et al., 1999).
However, the present observational data suggests that the evolution of the obscured objects might be different from that of the unobscured ones, with the number ratio of type 2 to type 1 QSOs increasing with redshift (Gilli et al., 1999; Pompilio et al., 2000; Reeves & Turner, 2000; Gilli et al., 2001). In this case, we divide the soft X-ray Luminosity Function(XLF) into two luminosity regions according to the e-folding luminosity . The abundance ratio of type 2 to type 1 Seyferts () is set equal to 4 and the ratio of type 2 to type 1 QSOs is simplified as . and are free parameters. We also explored the possibility that the abundance ratio of LLAGNs is much higher than 4, i.e. as high as 10. It seems that the current far-infrared and submillimeter deep surveys are not robust enough to contrain this value. Probably, it is because LLAGNs do not contribute much to the bright SCUBA number counts. In this case, the abundance ratio of the low luminosity Seyferts is not critical for this work. Thus, the abundance ratio of type 2 to type 1 AGNs including low luminosity Seyferts and QSOs can be described as the following:
| (2) |
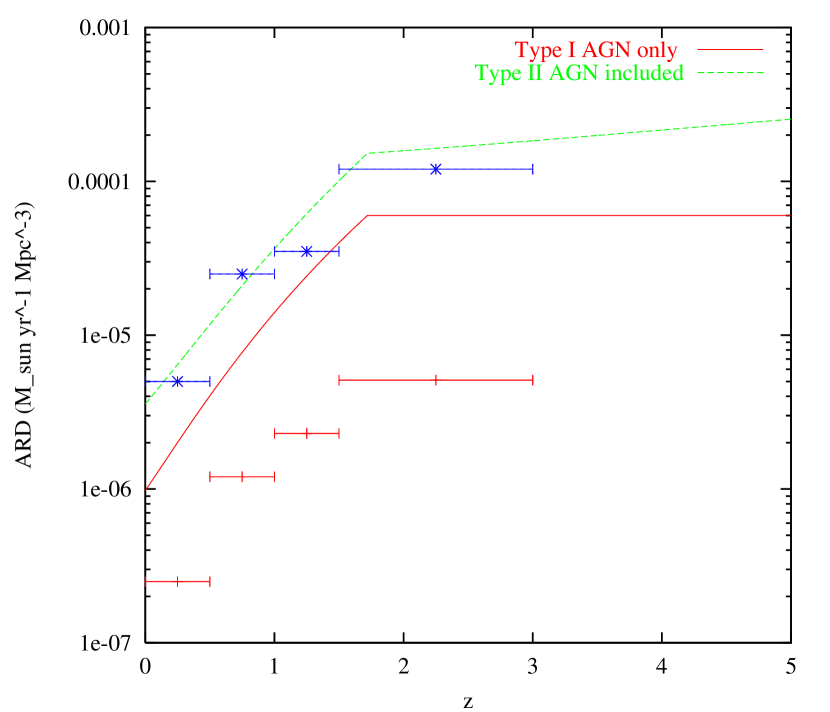
Considering the present day black hole density and the submillimeter deep surveys as the model constraints, we found the ratio of the obscured type 2 to unobscured type 1 QSOs has an upper limit of about 2 ( and have the best fit values of and ). There is not much room left for a ratio far beyond this number. This is actually consistent with the results of recent Chandra deep surveys by Alexander et al. (2001) who suggests that this ratio is unlikely to be more than 8 and is probably considerably lower. Since X-ray emission directly measures the accretion of AGNs, we show in Fig. 1 the accretion history from the model calculation. The solid line illustrates the accretion history of the type 1 AGNs only; while the dashed line is for the case with type 2 AGNs included. The accretion rate density in units of from a multiwavelength study of 69 hard X-ray selected sources in the field of Abell 370 cluster (A370), Hawaii Survey Field (SSA13) and Chandra Deep Field-North (CDF-N) for four redshift bins are also ploted in Fig. 1, where the blue asterisks represent the accretion onto the AGNs calculated from their bolometric luminosities and the red crosses are from their X-ray luminosities as a low limit. Fig. 1 shows that the predicted accretion rate density of the type 1 AGNs is below the upper bound derived from the hard X-ray selected samples (Barger et al., 2001). Meanwhile, we see that the fraction of type 2 AGNs included in our model still agrees with the current results of deep hard X-ray surveys. It is worth mentioning that the treatment of the abundance of type 2 AGNs in this work is very rough. We need more data from the Chandra and XMM-Newton surveys at significant fainter fluxes to better constrain the abundances.
3 Star formation associated with black hole growth and the SCUBA counts
Recent observations seem to support an evolutionary scenario where the black hole growth and intensive star formation during the spheroid formation are co-evolving events. In this scheme, the accretion onto a seed black hole and the rapid star formation in a region are significantly enhanced due to a merging process or tidal interactions. Accretion star formation compete for the gas supply and may self-regulate by the fundamental properties of the viscous accretion disk, leading to the formation of massive black holes scaling with their spheroids. In this case, the mass function of spheroids may have a similar form to the balck hole mass function, and the spheroidal mass distribution could be derived by:
| (3) |
is the black hole to bulge mass ratio. We adopt here a mean value as the first approximation (McLeod & Rieke, 1994; Kormendy & Richstone, 1995; Faber et al., 1997; Magorrian et al., 1998; Merritt & Ferrarese 2001a, ).
The aim of this section is mainly to estimate the star formation rate during spheroid formation in individual galaxies, and then discuss the co-moving star formation history related with such an epoch. The SCUBA number counts are used as a model constraint or consistency check for the amount of star formation, especially at .
The basic assumption of this calculation is that the stellar population of the spheroids are mostly from an intensive star formation phase in the central region which is associated with the mass accretion onto the central black holes. In the model calculation of Wang & Biermann (1998), star formation would dominate the energy output in the first for the stellar black hole growing to a mass of , even with full-Eddington accretion. Because of the heavy dust extinction, the intensive star formation during this process would emit a large fraction of its energy at infrared wavelength. The Ultraluminous Infrared Galaxies (ULIGs) may represent such a dust-enshrouded stage of both intensive starbursts and AGNs. Once the AGN activity becomes powerful enough, the nucleus sheds its obscuring dust, allowing the AGN to visually dominate, completing the evolutionary process from ULIGs to optically selected QSOs (Sanders et al., 1988; Yamada, 1994; Mihos & Hernquist, 1996; Silk & Rees, 1998; Taniguchi et al., 1999).
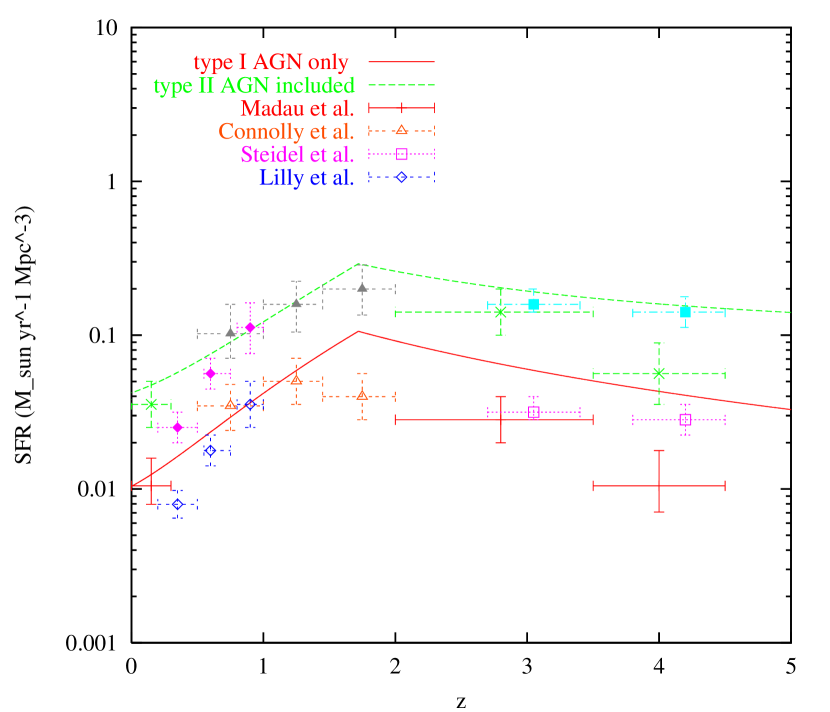
We adopt a characteristic star formation time scale for the starburst activities coupled with the black hole growth, which is approximately equal to the QSO life time (i.e. ). This is consistent with the predictions of the theoretical models and the recent Chandra results of the QSO accretion duration (Wang & Biermann, 1998; Burkert & Silk, 2001; Barger et al., 2001). The star formation rate during such a phase would be . Following the cosmological evolution inferred from X-ray deep surveys, we get the redshift dependent black hole mass distribution by eq. 1, and the mass function of spheroids with redshift by eq. 3. So far, we get to know the star formation rate in individual spheroid during the past active phase, the mass distribution and the cosmological evolution. The co-moving star formation rate vs. redshift from our calculation is shown in Fig. 2.
In section 2, we have applied the local black hole density to constrain the black hole mass distribution and cosmological evolution in our calculation. Independently, submillimeter deep survey would be a good tracer and constraint of such an active star formation stage associated with the major phase of black hole growth and spheroid formation. To discuss the contribution of such an intensive star formation phase to the SCUBA number counts, we should convert the star formation rate to far-infrared emission for individual source. This relation is not straightforward even for the local ULIGs because of the high internal extinction. A number of authors have discussed how the star formation rate in a galaxy can be inferred from its optical, UV or far-infrared luminosity (Scoville & Young, 1983; Leitherer & Heckman, 1995; Rowan-Robinson et al., 1997). The transformation factor depending upon star formation parameters could vary by more than one order of magnitude. We adopt a mean value , and a mean color ratio given by Chary & Elbaz (2001) from IRAS, ISO and SCUBA surveys.
Similar to eq. 1, we can derive the luminosity function at different redshift as follow:
| (4) |
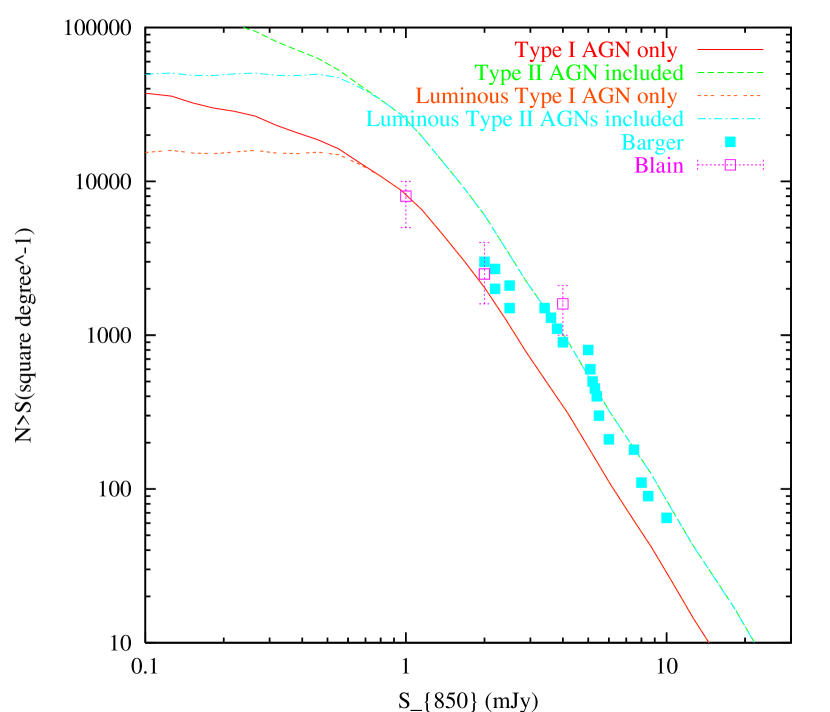
where reflects the fraction of galaxies which are in the active stage with intensive star formation ongoing. , and are the parameters adopted in our model and discussed above. is the frequency of . Since early star formation could be well constrained by the far-infrared and submillimeter deep surveys, we show the number count fitting in Fig. 3. We find that the amount of star formation related to the spheroid formation during the black hole growth heats the dust sufficiently to account for the far-infrared emission in most of the SCUBA counts.
Throughout the discussion above, we only focus on the star formation history in massive spheroids, i.e. elliptical galaxies or the disk galaxies with bulges. Although there are two kinds of bulges in the disk galaxies strengthened by especially Hubble Space Telescope (”mini-elliptical” vs. ”pseudobulge”) and their formation mechanism might be very different, both of them follow the same correlation of or , presumably consistent with a scenario that the bulge formation and the black hole growth are closely connected (Carollo et al., 1997; Carollo et al. 1998a, ; Carollo et al. 1998b, ; Peletier et al., 2000). The star formation during the massive spheroid formation would be drastic and dusty, very probably missing in the current UV/optical deep surveys. However, some disk galaxies harbor only small black holes with the black hole to bulge mass ratio much lower than that of the spheroidal systems. The typical example is M33, a bulgeless galaxy with the upper limit on a black hole mass (three magnitude lower than what is expected from the mass correlation in massive systems). The star formation in these galaxies may be mild and the dust extinction is not so severe. Normally they are contained in the optical deep surveys, or other studies of the spiral galaxies (Cavaliere et al., 2000; Hornschemeier et al., 2002). The detailed discussion of the star formation history of these galaxies are beyond the scope of this paper.
4 Discussion and summary
We have begun to probe the cosmic star formation history associated with AGN accretion by X-ray deep surveys based on the tight correlation of in early type galaxies and nearby AGNs. This approach is parallel and complementary to the current study from optical and infrared observations of the star formation activities at (Madau et al., 1998; Pettini et al., 1998; Hughes et al., 1998; Barger et al., 1998; Ellis, 1998).
The cosmic star formation history associated with AGN accretion derived from our calculation is approximately comparable to that of the normal galaxies in Madau plot after a reasonable dust correction, although they are much rarer objects compared with optically selected galaxies (The co-moving number density of luminous AGNs is as small as , see Fig. 2). In this case, we might say that about half of the star formation (if not more) in our Universe is closely connected with AGN accretion, and we might severely overlook the intensive star formation during the epoch of the spheroidal formation by optical/NIR surveys due to the significant dust extinction and the small sample volume of these surveys.
We found from Fig. 2 that the peak of the intensive star formation representing the spheroid formation is at , not necessarily much beyond this epoch even if we take into account a reasonable fraction of type 2 QSOs at high redshift. According to various observation, we divide the soft X-ray luminosity function into two luminosity regions, where the abundance ratio of the type 2 to type 1 Seyferts is set equal to 4, and the ratio of the type 2 to type 1 QSOs is simplified as a power law function of . Actually an upper limit of the abundance ratio of the type 2 to type 1 QSOs is about from our calculation with the constraints of the local black hole mass density and the results of the submillimeter deep surveys. However, current model constraints are not sufficient to reject a much higher abundance ratio for low luminosity type 2 to type 1 AGNs (). The reason may be that the bright SCUBA counts are dominated by the luminous AGNs and the ratio of the low luminosity AGNs is not critical. Future results of the Chandra and XMM/Newton deep surveys would give more information on the abundance of the obscured objects.
The energy budget of the submillimeter sources has been discussed by several authors, which show that the AGN powered far-infrared emission in the obscured objects could account for only a certain fraction of the SCUBA number counts (Almaini et al., 1999; Risaliti et al., 2002). The SCUBA/X-ray anti-correlation of the Chandra deep surveys gives a clear detection of AGN activities in those samples only (Bautz et al., 2000; Fabian et al., 2000; Barger et al. 2001b, ; Hornschemeier et al., 2001). Nevertheless, Fig. 3 shows that the far-infrared emission from the dust heated by the intensive star formation during the black hole growth could sufficiently interpret the number counts of the submillimeter deep surveys, where the SCUBA number counts are dominated by the contribution from the star formation in the host galaxies of the luminous type 1 or type 2 QSOs, and the the faint parts () may be from those low luminosity X-ray sources with small bulges. In this case, our calculation may indicate that the star formation activity might dominate the energy power (at least comparable to the AGNs) in the far-infrared emission in these SCUBA sources, consistent with the multiwavelength observations of the submillimeter selected galaxies. They suggest that even when an AGN is present in a SCUBA source, it rarely dominates the engergy budget of the galaxy (Frayer et al., 1998; Alexander et al., 2002; Ivison et al., 2002; Smail et al., 2002).
References
- Akiyama et al. (2002) Akiyama, M., Ueda, Y., Ohta, K., 2002, ApJ, 567, 42
- Almaini et al. (1999) Almaini, O., Lawrence, A., Boyle, B.J. 1999, MNRAS, 305, L59
- Alexander et al. (2001) Alexander, D.M., Brandt, W.N., Hornschemeir, A.E. et al. 2001, AJ, 122, 2156
- Alexander et al. (2002) Alexander, D.M., Bauer, F.E., Brandt, W.N. et al. 2002, AJ, in press, astro-ph/0211267
- Barger et al. (1998) Barger, A.J., Cowie, L.L., Sanders, D.B. et al. 1998, Nature, 394, 248
- Barger et al. (1999) Barger, A.J., Cowie, L.L., Smail, I. et al. 1999, AJ, 117, 2656
- Barger et al. (2001) Barger, A.J., Cowie, L.L., Bautz, M. W. et al. 2001, AJ, 122, 2177
- (8) Barger, A.J., Cowie, L.L., Mushotzky, R.F. et al. 2001a, AJ, 121, 662
- (9) Barger, A.J., Cowie, L.L., Steffen, A.T. et al. 2001b, ApJ, 560, L23
- Bautz et al. (2000) Bautz, M.W., Malm, M.R., Baganoff, F.K. et al. 2000, ApJ,543, L119
- (11) Blain, A. W., Smail, I., Ivison, R. J. 1999a, MNRAS, 302, 632
- Blain et al. (1999) Blain, A.W., Kneib, J.-P., Ivison, R.J., Smail, I. 1999, ApJ, 512, L87
- Boyle et al. (2000) Boyle, B.J. et al. 2000, MNRAS, 317, 1014
- Burkert & Silk (2001) Burkert, A., Silk, J. 2001, ApJ, 554, L151
- Carollo et al. (1997) Carollo, C.M., Stiavelli, M., de Zeeuw, P.T. et al. 1997, AJ, 114, 2366
- (16) Carollo, C.M., Stiavelli, M. 1998a, AJ, 115, 2306
- (17) Carollo, C.M., Stiavelli, M., Mack, J. 1998b, AJ, 116, 68
- Cavaliere et al. (2000) Cavaliere, A., Giacconi, R., Menci, N. 2000, ApJ, 528, L77
- Chary & Elbaz (2001) Chary, R., Elbaz, D. 2001, ApJ, 556, 562
- Connolly et al. (1997) Connolly, A. J., Szalay, A. S., Dickinson, M. et al. 1997, ApJ, 486, L11
- De Zotti et al. (2001) De Zotti, G. , Granato, G. L., Baccigalupi, C. Proc. Frascati Workshop in ”Multifrequency Behaviour of High Energy Cosmic Sources”, Vulcano, May 21–26, 2001, astro-ph/0107241
- Ellis (1998) Ellis, R. 1998, Nature, 395, 3
- Elvis et al. (1994) Elvis, M., et al. 1994, ApJS, 95, 1
- Faber et al. (1997) Faber, S.M., Tremaine, S., Ajhar, E.A. et al. 1997, AJ, 114, 1771
- Fabian & Iwasawa (1999) Fabian, A.C., Iwasawa, K. 1999, MNRAS, 303, L34
- Fabian et al. (2000) Fabian, A.C., Smail, Ian, Iwasawa, K. et al. 2000, MNRAS, 315, L8
- Fixsen et al. (1998) Fixsen, D.J., Dwek, E., Mather, J.C. 1998, ApJ, 508, 123
- Frayer et al. (1998) Frayer, D.T., Ivison, R.J., Scoville, N.Z. et al. 1998, ApJ, 506, L7
- Giacconi et al. (2001) Giacconi, R., Rosati, P., Tozzi, P. et al. 2001, ApJ, 551, 624
- Gilli et al. (1999) Gilli, R., Risaliti, G., Salvati, M. 1999, A&A, 347, 424
- Gilli et al. (2001) Gilli, R., Salvati, M., Hasinger, G. 2001, A&A, 366, 407
- Guiderdoni et al. (1997) Guiderdoni, B., Bouchet, F.R., Puget, J.-L. et al. 1997, Nature, 390, 257
- Haehnelt & Kauffmann (2000) Haehnelt, M. G., Kauffmann, G. 2000, MNRAS, 318, L35
- Haiman & Menou (2000) Haiman, Z., Menou, K. 2000, ApJ, 531, 42
- Halpern et al. (1999) Halpern, J. P., Turner, T. J., George, I. M. 1999, MNRAS, 307, L47
- Hasinger et al. (2001) Hasinger, G., Altieri, B., Arnaud, M. et al. 2001, A&A, 365, 45
- Hauser et al. (1998) Hauser, M.G. et al. 1998, ApJ, 508, 25
- Ho (1999) Ho, L.C., 1999, in ”Observational Evidence for Black Holes in the Universe”, ed. S. K. Chakrabarti(Dordrecht: Reidel), 157
- Hornschemeier et al. (2001) Hornschemeir, A. E., Brandt, W. N., Garmire, G. P. et al. 2001, ApJ, 554, 742
- Hornschemeier et al. (2002) Hornschemeier, A. E., Brandt, W. N., Alexander, D. M. et al. 2002, ApJ, 568, 82
- Hughes et al. (1998) Hughes, D.H. et al. 1998, Nature, 394, 241
- Ivison et al. (2002) Ivison, R. J., Greve, T.R., Smail, I. et al. 2002, MNRAS, 337, 11
- Kim & Sanders (1998) Kim, D.-C., Sanders, D.B. 1998, ApJS, 119, 41
- Kormendy & Richstone (1995) Kormendy, J., Richstone, D. 1995, ARA&A, 33, 581
- Kormendy & Gebhardt (2001) Kormendy, J., Gebhardt, K. 2001, XX Texas Symposium on Relativistic Astrophysics, Martel & Weeler Eds., AIP, in press (astro-ph/0105230)
- Laor (1998) Laor, A. 1998, ApJ, 505, L83
- Leitherer & Heckman (1995) Leitherer, C., Heckman, T.M. 1995, ApJS, 96, L9
- Madau et al. (1996) Madau, P., Ferguson, H. C., Dickinson, M. E. et al. 1996, MNRAS, 283, 1388
- Madau et al. (1998) Madau, P., Pozzetti, L., Dickinson, M. 1998, ApJ, 498, 106
- Magorrian et al. (1998) Magorrian, J., Tremaine S., Richstone D. et al. 1998, AJ, 115, 2285
- Maiolino & Rieke (1995) Maiolino, R., Rieke, G. H. 1995, ApJ, 454, 95
- Maiolino et al. (2001) Maiolino, R., Salvati, M., Marconi, A. et al. 2001, A&A, 375, 25
- McLeod & Rieke (1994) McLeod, K.K., Rieke, G.H. 1994, ApJ, 420, 58
- McLure & Dunlop (2002) McLure, R.J., Dunlop, J.S. 2002, MNRAS, 331, 795
- (55) Merritt, D., Ferrarese, L. 2001a, MNRAS, 320, L30
- Merritt & Ferrarese (2001) Merritt, D., Ferrarese, L. in ”The Central Kpc of Starbursts and AGNs”, ed. Knapen J.H. et al., 2001 (astro-ph/0107134)
- Mihos & Hernquist (1996) Mihos, J.C., Hernquist, L. 1996, ApJ, 464, 641
- Miyaji et al. (2000) Miyaji, T., Hasinger, G., Schmidt M. 2000, A&A, 353, 25
- Miyaji et al. (2002) Miyaji, T., Griffiths, R.E. 2002, ApJ, 564, L5
- Monaco et al. (2000) Monaco, P., Salucci, P., Danese, L. 2000, MNRAS, 311, 279
- Mushotzky et al. (2000) Mushotzky, R.F., Cowie, L.L., Barger, A.J. et al. 2000, Nature, 404, 459
- Norman et al. (2002) Norman, C., Hasinger, G., Giacconi, R. et al. 2002, ApJ, in press, astro-ph/0103198
- Padovani (1989) Padovani, P., 1989, A&A, 209, 27
- Page et al. (2001) Page, M. J., Stevens, J. A., Mittaz, J. P. D. et al. 2001, Science, vol.294, 2516
- Peletier et al. (2000) Peletier, R.F. et al. 2000, MNRAS, 310, 703
- Pettini et al. (1998) Pettini, M., Kellogg, M., Steidel, C.C. et al. 1998, ApJ, 508, 539
- Pompilio et al. (2000) Pompilio, F., La Franca, F., Matt, G. 2000, A&A, 353, 440
- Ptak et al. (2001) Ptak, A., Griffiths, R.E., White, N.E. et al. 2001, ApJ, 559, L91
- Puget et al. (1996) Puget, J.-L., Abergel, A., Bernard, J.-P. et al. 1996, A&A, 308, L5
- Reeves & Turner (2000) Reeves, J. N., Turner, M. J. L. 2000, MNRAS, 316, 234
- Risaliti et al. (2002) Risaliti, G., Elivis, M., Gilli, R. 2002, ApJ, 566, L67
- Rowan-Robinson et al. (1997) Rowan-Robinson, M., Mann, R.G., Oliver, S.J. et al. 1997, MNRAS, 289, 490
- Salucci et al. (1999) Salucci, P., Szuszkiewicz, E., Monaco, P. et al. 1999, MNRAS, 307, 637
- Sanders et al. (1988) Sanders, D.B., Soifer, B.T., Elias, J.H. et al. 1988, ApJ, 325, 74
- Sanders (1999) Sanders D. B, 1999, Advances in Space Research, Vol. 25, Iss. 11, p. 2251-2264
- Schlegel et al. (1998) Schlegel, D.J., Finkbeiner, D.P., Davis, M. 1998, ApJ, 500, 525
- Scoville & Young (1983) Scoville, N.Z., Young, J.S. 1983, ApJ, 265, 148
- Silk & Rees (1998) Silk, J., Rees, M.J. 1998, A&A, 331, L1
- Smail et al. (2002) Smail, I., Ivison, R.J., Blain, A.W. et al. 2002, MNRAS, 331, 495
- Steidel et al. (1996) Steidel, C. C., Giavaliso, M., Dickinson, M. et al. 1996, AJ, 112, 352
- Steidel et al. (1999) Steidel, C.C., Adelberger, K.L., Giavalisco, M. et al. 1999, ApJ, 519, 1
- Stern et al. (2002) Stern, D. et al. 2002, ApJ, in press, astro-ph/0111513
- Taniguchi et al. (1999) Taniguchi, Y., Ikeuchi, S., Shioya, Y., 1999, ApJ. 514, L9
- Wandel (1999) Wandel, A., 1999, in “Structure and kinematics of Quasar Broad Line Regions”, ASP conference series, Vol. 175, Ed. C. M. Gaskell et al., p213
- (85) Wandel, A. 1999a, ApJ, 519, L39
- Wang & Biermann (1998) Wang, Y.P., Biermann, P.L. 1998, A&A, 334, 87 (WB98)
- Wang et al. (2000) Wang, Y.P., Biermann, P.L., Wandel, A. 2000, A&A, 361, 550
- Yamada (1994) Yamada T., 1994, ApJ 423, L27