Active star formation in N11B Nebula in the Large Magellanic Cloud: a sequential star formation scenario confirmed 111Based in part on observations with the NASA/ESA Hubble Space Telescope obtained from the archive at the Space Telescope Science Institute, which is operated by the Association of Universities for Research in Astronomy, Inc., under NASA contract NAS5-26555 222Based in part on observations obtained at European Southern Observatory, La Silla, Chile
Abstract
The second largest H II region in the Large Magellanic Cloud, N11B has been surveyed in the near IR. We present images of the N11B nebula. These images are combined with CO emission line data and with archival NTT and HST/WFPC2 optical images to address the star formation activity of the region. IR photometry of all the IR sources detected is given. We confirm that a second generation of stars is currently forming in the N11B region. Our IR images show the presence of several bright IR sources which appear located towards the molecular cloud as seen from the CO emission in the area. Several of these sources show IR colours with YSO characteristics and they are prime candidates to be intermediate-mass Herbig Ae/Be stars. For the first time an extragalactic methanol maser is directly associated with IR sources embedded in a molecular core. Two IR sources are found at (0.5 pc) of the methanol maser reported position. Additionally, we present the association of the N11A compact H II region to the molecular gas where we find that the young massive O stars have eroded a cavity in the parental molecular cloud, typical of a champagne flow. The N11 region turns out to be a very good laboratory for studying the interaction of winds, UV radiation and molecular gas. Several photodissociation regions are found.
1 Introduction
Giant H II regions are relatively scarce objects in the Local Group. In these regions we expect to find a broad spectrum of coeval phenomena related to massive stars. The action of stellar winds from the massive stars and the supernova explosions pushes and destroys the natal molecular cloud, but also, helps to trigger the formation of a new generation of massive stars. At present, there is morphological evidence showing that a former massive star generation could produce a new one in the peripheral molecular clouds, but there is no quantitative evidence of how different generations are related in a giant H II region. This quantitative evidence is very hard to obtain, because it requires the characterisation of the stellar content embedded in the H II region and the physical condition of the gas in the molecular cloud.
The sequential star formation scenario proposed by Elmegreen & Lada (1977, see also Elmegreen 1998), has a few clear galactic examples where it is possible to see that the direct action of massive stars in the parental molecular cloud could be producing a new generation of stars. Two such regions, the OB Association Ara OB1 (Arnal et al. 1987), and the Carina Nebula (Smith et al. 2000) have been proposed as leading cases in our Galaxy.
In general, in a massive star forming region we find a cavety of relatively low density ionised gas produced by the action of several hot massive stars together with photodissociation regions (PDR) located on the surfaces of the molecular clouds facing the hot stars. Embedded IR sources and/or molecular cores could be direct evidence of an emerging new generation of stars.
In the Local Group, the formation and evolution of large superbubbles (Oey 1999) is a controversial issue. Evolved superbubbles are suggested to be produced by the direct action of SN explosions in the interstellar medium which produce shells of emitting gas (Wang & Helfand 1991). In younger H II superbubbles, the main bright nebular filaments are not shells but PDR interfaces between the H II cavity and the surrounding molecular clouds surfaces. An example in an extragalactic environment is now clearly established: 30 Doradus Nebula in the Large Magellanic Cloud (Rubio et al. 1998; Walborn et al. 1999a and references therein).
The N11 nebular complex (Henize 1956) or DEM34 (Davies, Elliot, & Meaburn 1976) is the second largest H II region in the LMC after 30 Doradus Nebula (Kennicutt & Hodge 1986), lying at the opposite end of the LMC Bar. The complex consists of a huge bubble surrounded by nine distinct nebular entities (Rosado et al. 1996). These are easily distinguished in the spectacular H+[N II] emission line image published by Walborn & Parker (1992). The OB association LH9 is located at the center of a cavity of about pc (Lucke & Hodge 1970; Parker et al. 1992). This OB association is dominated by HD 32228 (Radcliffe 64, Sk , Breysacher 9), a massive compact cluster containing a WC4 star of about 3.5 Myr (Walborn et al. 1999b). Surrounding LH9 are several younger OB associations embedded in dense nebular regions, two of which have O3 stars among their members: LH13 in N11C (Heydari-Malayeri et al. 2000) and LH10 in N11B (Parker et al. 1992). The latter authors propose an evolutionary link between the OB associations LH9 and LH10, where the star formation in LH10 could have been triggered by the evolution of massive stars in LH9. This suggestion was based on the different initial mass function slopes found, significantly flatter for LH10 than for LH9, and the different apparent ages derived for both associations. Walborn & Parker (1992) noticed a remarkable analogy in the structural morphology between N11 and 30 Doradus and proposed a two-stage starburst scenario to explain the morphological distribution of OB stars in both H II regions. According to this scenario, an initial and centrally concentrated burst of stars may trigger a second burst in the peripherical molecular clouds about years later. In N11, this process would be 2 million years older than in 30 Dor.
N11 is a large molecular cloud complex composed by at least 29 separate molecular clouds (Israel et al. 2002, Israel & de Graauw 1991), directly associated with the ionised gas (Rosado et al. 1996). The CO emission is concentrated in distinctive peaks and correlated with the H and FIR dust emissions, suggesting that the star-formation activity is distributed in the ringlike structure of N11 (Caldwell & Kutner 1996).
Thus, the N11 region is a very good candidate for the study of the sequential star formation processes and for the determination of how different complex elements are related in the ongoing star generation embedded in the nebular ring.
In this paper we present new near-infrared images and CO observations of the N11B nebula which show a striking relationship between IR sources and the molecular cloud. In addition, we compare our observations with optical nebular emission archival images obtained with the New Technology Telescope (NTT) and the Hubble Space Telescope (HST) yielding further evidence of the ongoing star forming activity in this region.
2 Observations
2.1 Millimeter
Millimeter observations of N11 were done in the 12CO(10) as part of the Swedish-ESO Submillimeter Telescope (SEST) Key Programme: “CO in the Magellanic Clouds” between years 1988-94, using the SEST radiotelescope (ESO, Chile)333The Swedish-ESO Submillimeter Telescope (SEST) is operated jointly by the European Southern Observatory (ESO) and the Swedish Science Research Council (NFR). These observations were done with a FWHP= resolution (Israel & de Graauw 1991; Israel et al. 2002), and the molecular clouds of the complex were fully mapped with a grid spacing. The observations showed the presence of 29 individual molecular clouds which appeared well correlated with H and FIR peaks. For this work we have selected a subset of the Key Programme CO observations, which include the regions N11A and N11B. The sampled area was with a grid spacing of (5 pc at the LMC distance).
The data were reduced using the millimeter IRAM software package. The spectra were smoothed to a velocity resolution of 0.45 km s-1. Integrated contour maps of the region were produced and used in the following sections to superimpose the molecular clouds on the NIR and optical nebular images.
2.2 Infrared images
The , and () images of the OB association LH10 in N11B, centered around the star PGMW 3070444PGMW star numbers are from Parker et al. 1992 were obtained on 28 January 1993, using the near-IR camera IRCAM, attached to the 2.5-m Du Pont Telescope at Las Campanas Observatory (LCO), Chile. IRCAM is equipped with a NICMOS III array (Persson et al. 1992) and the pixel scale was px-1. The seeing during the observations was typically of giving an optimum sampling. Nine position tiles with a separation of were observed in each filter. Each tile was formed of a sequence of five exposures of 40 sec each, and these were combined to obtain, a total on source exposure time of 800 sec in each filter. Sky frames were taken at one degree to the North of N11B, showing few stars and no extended nebulosities. In each filter, the images were median-averaged after subtraction of dark, and sky, and then flat-fielded using IRAF555IRAF is distributed by the National Optical Astronomy Observatories, which is operated by the Association of Universities for Research in Astronomy, Inc., under contract to the National Science Foundation. routines. Several standard stars extracted from Persson et al. (1998) were observed during the night; their images were also dark-subtracted and and flat-fielded. All combined images of the LH10 region were registered with respect to the image by means of several common stars, and the final area covered resulted to be of for each filter.
2.3 Optical
A 120 sec exposure time image obtained with EMMI Camera attached to the New Technology Telescope (NTT) at the European Southern Observatory, using the filter #589 [O III], was retrieved from the ESO Archive Facility. The image was obtained on Dec. 16, 1995 by J. Danziger using a 2K2K CCD (scale of px-1) on very good seeing conditions. The image was processed as follows: it was flat-fielded using flat images obtained during the same day, but due to the unavailability of bias images, the overscan region was used instead to remove the bias level. Few cosmic rays were detected by visual inspection of the image and these were “cleaned” by linear interpolation with neighbour pixels.
Archival images obtained with the HST/WFPC2 were used to investigate the morphological relationships between IR sources and stellar objects or gaseous structures in the OB association LH10. These WFPC2 datasets were obtained in May 12, 1999 (Proposal 6698, PI Y.-H. Chu), using narrowband filters F502N, corresponding to [O III] 5007Å (datasets u3me0103r and u3me0104r, 1200 sec of exposure time) and F656N, corresponding to H (datasets u3me0101r and u3me01012r, 1000 sec of exposure time). These images were extracted from the HST Archive and calibrated using the “on the fly” calibration pipeline. Additional cosmic rays rejection, combining and mosaicing were done using IRAF/STSDAS software. The datasets are the same as those reported by Nazé et al. (2001).
3 Results
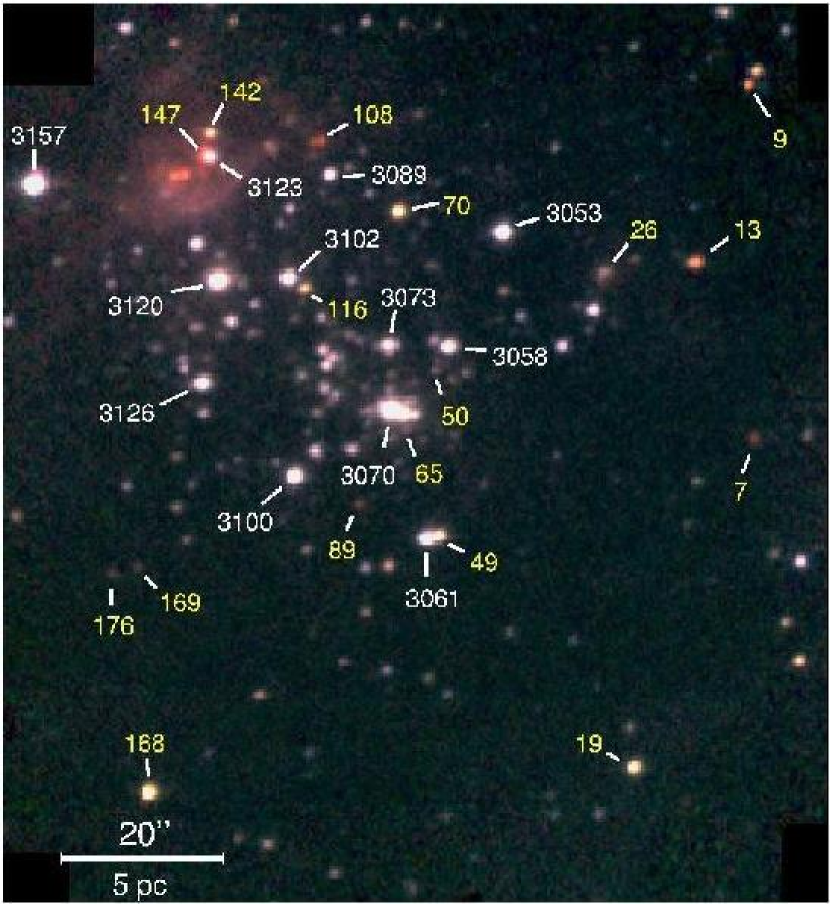
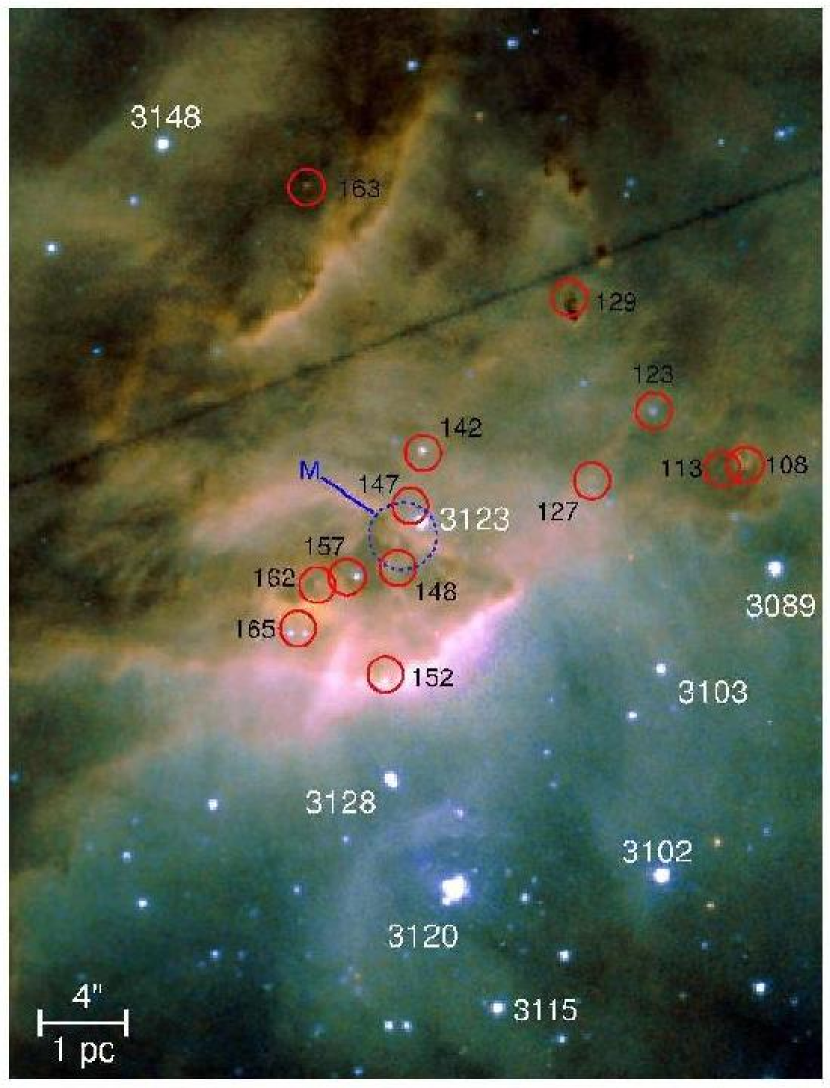
Figure 1 is a false-colour image obtained from a combination of , , and images as blue, green, and red channels, respectively. Several IR sources are found. These are labelled in black numbers in the figure while those catalogued in the optical are labelled with white numbers. The image is centered on PGMW 3070, the multiple star core of LH10 with an O6 V spectral type, showing a cluster of blue stars with relatively low extinction. In the NE corner of the image, around the O8.5 V star PGMW 3123, a nebular feature appears with several embedded IR sources (shown in greater detail in Figure 2). In this area, the WFPC2 and NTT images (discussed in following sections) show that this nebulosity is in fact a PDR at the interface between the molecular cloud and the H II cavity fuelled by the UV photons produced by the hottest stars in LH10.
3.1 Photometry of infrared sources
Point-spread function photometry was performed using IRAF/DAOPHOT-II software running in a Linux workstation. Stars were detected at a level above the mean background, and additional stars surrounded by nebulosities were included by eye. Three PSF star candidates were selected in each image avoiding nebular and crowded regions. The PSF was calculated using a penny1 function and one look-up table. The final PSF photometry was made using a 3 pixel aperture (roughly the FWHM of the stars), and aperture corrections were estimated using the curve-of-growth method with the same PSF stars for each frame. False star detections were minimised by eye inspection of the images, mainly in the nebular region. Objects suspected to be false detections were rejected from the final catalogue. The photometric limits were determined plotting the star distribution per bin for each filter, and assuming that the peak of such distributions were magnitude limits. The peak of the distribution occurred about brighter than the magnitude where the distribution fell to zero. Thus, we estimate that our catalogue is complete to , , and .
Table 1 gives the photometry of all 184 IR sources detected in the field. Running number sources are in column 1 (BRRG numbers), column 2 and 3 are right ascension and declination (J2000), columns 4, 5, 6, 7, 8, 9 are , , magnitudes and their errors, columns 10 and 11 are and colours, and column 12 contains comments related to the identification of optical counterparts.
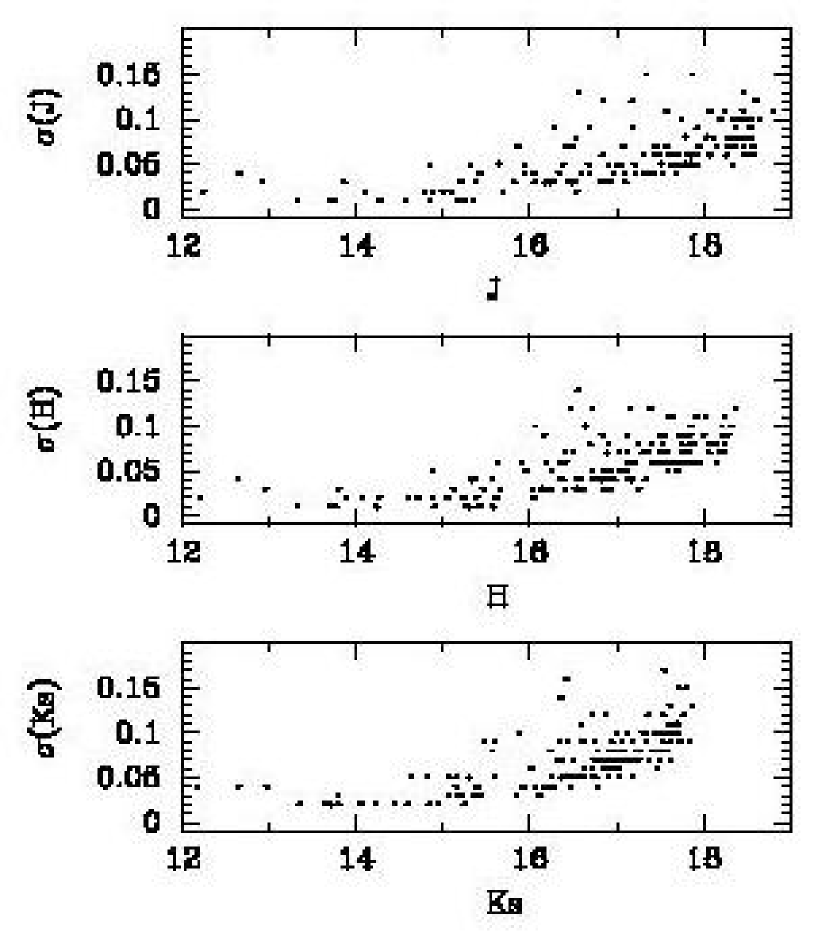
Internal photometric errors as determined by DAOPHOT (including photon-counts statistics, NICMOS noise characteristics, and PSF fitting errors) are plotted in Figure 3. To check systematic photometric errors produced by aperture corrections and standard zero-points, we compare un-crowded regions with sources with those of the 2MASS point source catalogue (Second Incremental Data Release, Cutri et al. 2000). Table 2 lists the stars used for the comparison and the magnitude differences derived from our photometry and those of the 2MASS point source catalogue. A comparison of our photometry to that of the 2MASS catalogue shows differences which are indicative that our photometry is systematically fainter than that obtained from the 2MASS. We find a magnitude offset of about magnitudes between the LCO and 2MASS infrared photometry. We rechecked our sky-subtraction procedures, aperture corrections and zero-points to determine the origin of such differences and we have not found any error in our procedure. A possible explanation for these differences could be a change in the observing conditions during the N11B observation (for example, the passage of tiny atmospheric cirrus). We decided to apply a correction to our final catalogue taking into account these differences with the 2MASS catalogue.
Positions in equatorial coordinates of the individual sources were derived from the identification of seven Guide Star Catalogue (GSC) stars in the IR images. Positions derived in this way show systematic differences with those derived from the default world coordinate system astrometric solution in the HST/WFPC2 image headers. This offset in coordinates is not seen when we compare our positions with those in other catalogues such as Parker et al. (1992) and 2MASS. The offset difference found with the HST images is in the range of the absolute errors expected from the HST pointing system. Table 3 gives the average offsets and errors found on the coordinates between our IR seven stars and those found in the different catalogues (GSC, Parker et al. 1992, 2MASS) and the positions derived from WFPC2 images. This offset coordinate difference must be known with the best attainable precision as we will compare the position of a methanol maser with that of detected IR sources and the HST/WFPC2 images (see Section 3.4).
3.2 Colour-Magnitude and Colour-Colour diagrams
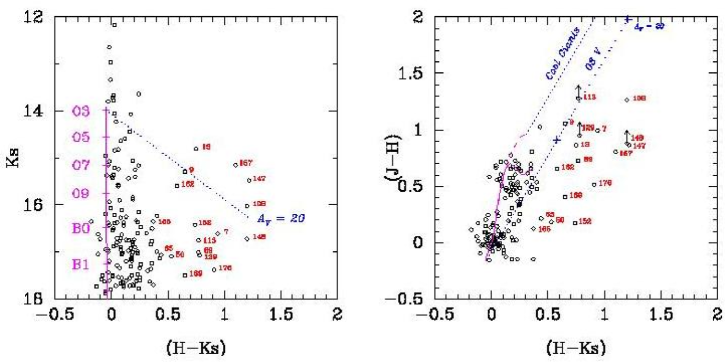
Colour-Magnitude (CMD) and Colour-Colour diagrams (Fig 4) show a clear main-sequence between spectral types O3 and B0 on the ZAMS (our lower limit) spread out by low or moderate range of visual absorption. There are few sources with apparent IR excess (BRRG 7, 89, 147, 148, 157, 152, 169, 176), and few other that could be O stars with high reddening ( mag) (BRRG 9, 13, 162). The absolute IR magnitudes and colours for OB ZAMS stars are adopted from Hanson, Howarth & Conti (1997).
The interpretation of IR CMDs is not straightforward as the early ZAMS stars locus is very steep, even steeper than that of the optical CMDs. Moreover, the first two million years evolutionary tracks for massive stars are almost constant in colour. Therefore, it is extremely difficult to discern between a ZAMS and a main-sequence star using only near-IR photometric information. Thus, spectroscopic classification must be done, as an unreddened ZAMS O6.5 V star looks like an unreddened O8 V dwarf star using NIR broadband photometry.
Parker et al. (1992) classified five stars in LH10 as ZAMS O stars (O stars with He II 4686 absorption line being stronger than any other He II absorption line). According to these authors, the stars PGMW 3073, 3102, 3126, 3204 and 3264 are roughly coeval with but slightly younger than the other typical “non-ZAMS” O stars. Three of these ZAMS stars are found in our survey, namely: PGMW 3073 (O6.5 V), 3102 (O7 V) and 3126 (O6.5 V). Only one star, PGMW 3073 () shows magnitude compatible with a 06 V ZAMS star ( for a LMC distance modulus of 18.5). The other two stars (PGMW 3102 and PGMW 3126) have magnitudes brighter than PGMW 3073, in particular PGMW 3102 is almost one magnitude brighter in . Their magnitude would imply a ZAMS O3-O4 star. According to the calibration of Vacca, Garmany, and Shull (1996), the absolute magnitudes for O6.5 V and O7 V stars stars are and , respectively. So, the optical data for these three stars (, for PGMW 3073, 3102, and 3126, respectively) would suggest that the , and the spectral type for PGMW 3126 are in remarkable agreement, and PGMW 3073 is 0.7 mag underluminous, and PGMW 3102 is 0.5 mag overluminous. The model for ZAMS stars predicts that they could be underluminous so that could explain PGMW 3073. It is possible to invoke different explanations to take into account the departure in magnitudes for those ZAMS stars, but in any case, all of this may be over-interpretation of the data; in Figure 6 in Vacca et al. (1996), it is clear that the variation of for a given spectral subtype can be quite large (they state a for the deviation of the data ponts to the best fit in their calibration). Therefore, the magnitude differences may be intrinsic scatter in the absolute magnitudes. Also, we need to keep in mind the intrinsic uncertainty in the spectral classification derived from spectra with moderate signal-to-noise ratio and nebular contamination.
Another issue in the interpretation of NIR photometric information is the effect of differential and internal reddening. Sources BRRG 9, 13, and 162 have the colours and magnitudes expected for early-O stars with high reddening. Different alternative explanations for these kind of sources can be suggested. They might be LMC red giants with moderate reddening but in a region with a peculiar extinction law, or Young Stellar Objects (YSOs) with intrinsic IR emission whose combined colours place them on the locus expected for stars with high reddening. We believe that the second alternative is the most plausible one. Rubio et al. (1998) reported similar IR sources in 30 Dor, and they discussed the importance of obtaining IR photometry in additional bands, such as and , as well as high spatial resolution images and IR spectroscopy.
A direct comparison between the NIR CMDs obtained for N11B and the NE nebular filament in 30 Doradus (Rubio et al. 1998) indicates that sources with the strong IR excess found in the latter are absent in the N11B region. In spite of a factor smaller area surveyed by Rubio et al. (1998) in that filament (), they found six IR sources with and . Our NIR survey centered in the LH10 association does not show any IR source with characteristics like those found in 30 Dor. The most extreme IR sources discovered in this survey, BRRG 147 and BRRG 157, have , and both are found towards the nebulosity where the CO cloud is located and where a methanol maser has been reported.
Brandner et al. (2001), using HST/NICMOS images of the 30 Dor Nebula, suggested that sources with intrinsic IR excess and magnitudes, , are intermediate mass Herbig Ae/Be candidates. Table 4 lists the IR sources in N11B that meet this criterion. It also lists the sources with , including stars with interesting morphological association with the surrounding gas and dust, such as BRRG 26, an embedded source in a compact nebulosity. Candidates of classical T Tauri stars would have and (Brandner et al. 2001) and are therefore beyond the sensitivity limit reached in our survey.
3.3 Comparison between molecular CO and optical nebular emissions
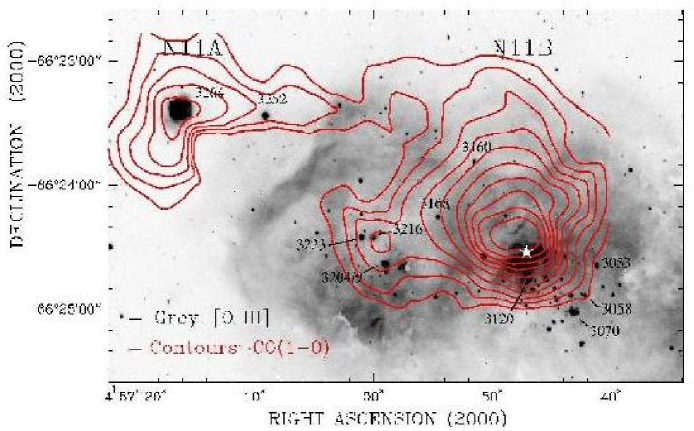
Figure 5 shows the distribution of the integrated CO emission superimposed over the [O III] 5007Å NTT image of the N11A and N11B region. The molecular gas is concentrated towards the brightest optical nebular emission features of these regions. Caldwell & Kutner (1996) found that the CO molecular clouds in all of the N11 nebula was correlated to the H emission.
In the particular case of N11B, the CO observations show that this emission is almost coincident in all its extension with the optical nebula mapped by the high-excitation [O III] gas. Therefore, most of the diffuse optical emission could be a consequence of photoevaporation and/or ionisation of gas at the interface of the molecular cloud produced by the intense UV field generated by the LH10 association. There are several noticeable structures that suggest this scenario. The peak of the CO emission in N11B is located to the north of the brightest optical nebular emission filament, and the ionising sources of LH10. This optical filament may be produced by the interaction of the O stars in LH10 with the border of the giant molecular cloud being eroded, resulting in a prominent PDR also seen in WFPC2 images (next Section). This morphology clearly resembles the W and NE filaments in 30 Doradus (Barbá, Rubio & Walborn 1999). Towards the molecular cloud, we find the reddest IR sources of our survey and also a methanol maser reported by Ellingsen et al. (1994). Thus, this area is a prime candidate site for current star formation in N11B.
A secondary CO emission peak is found to the east of N11B, in the direction of PGMW 3216. Close to it, we find an O8.5 IV star (PGMW 3223) and a multiple system whose main component is an O3 III(f*) star (PGMW 3209), reported by Walborn et al. (1999b). This molecular peak could be associated with the dusty cometary structures described by Nazé et al. (2001).
To the northeast of N11B, we find a separate nebular entity: the N11A nebular knot (upper left quadrant in Figure 5). This compact H II region has been studied by Heydari-Malayeri & Testor (1985), and Parker et al. (1992) who proposed that an early O star (PGMW 3264, O3-6 V) is emerging from its protostellar cocoon. Heydari-Malayeri et al. (2001), using HST observations, found that this object is a small compact group of five stars packed in a area, dominated by a source of , almost two magnitudes brighter than the second source in the group.
CO emission is found towards the N11A nebular knot. The maximum of the CO emission is almost coincident with the position of the compact group of stars, but shifted to the south-east. Heydari-Malayeri et al. (2001) found a sharp nebular ridge to the north-east of the exciting stars indicating the presence of a PDR in the knot, favouring the interpretation of an interaction between the stars inside the optical knot and the molecular material mapped by the CO emission. The PDR lies on the edge of the molecular region facing the exciting stars, similar to the case discussed previously for N11B.
It is most interesting to study in detail the PDRs in N11A and N11B because they might be in a different stage of evolution. In the case of N11A, the optical compact group of stars is visible indicating that the molecular cloud lies behind the stars and that they have evacuated a cavity towards our line of sight. This conclusion is supported by the fact that the O star has a relatively low reddening, , probably due only to dust mixed with the ionised gas (Heydari-Malayeri et al. 2001). These authors proposed that the nebular morphology of N11A is a good example of the champagne model (Tenorio-Tagle 1979; Bodenheimer et al. 1979), in the stage when the newborn stars disrupt the molecular cavity. Small nebular emission filaments discovered by Heydari-Malayeri et al. (2001) are located on the south-west border of the nebular knot, and show arcs pointing toward the direction where the CO emission has a sharp edge, indicating an abrupt drop of the molecular gas density. This morphology suggests that the compact group of stars could be blowing this side of its stellar nursery, in a similar morphological picture to that seen towards Knot 1 in the 30 Dor Nebula (Rubio et al. 1998; Walborn et al. 1999a; Walborn, Maíz-Apellániz & Barbá 2002).
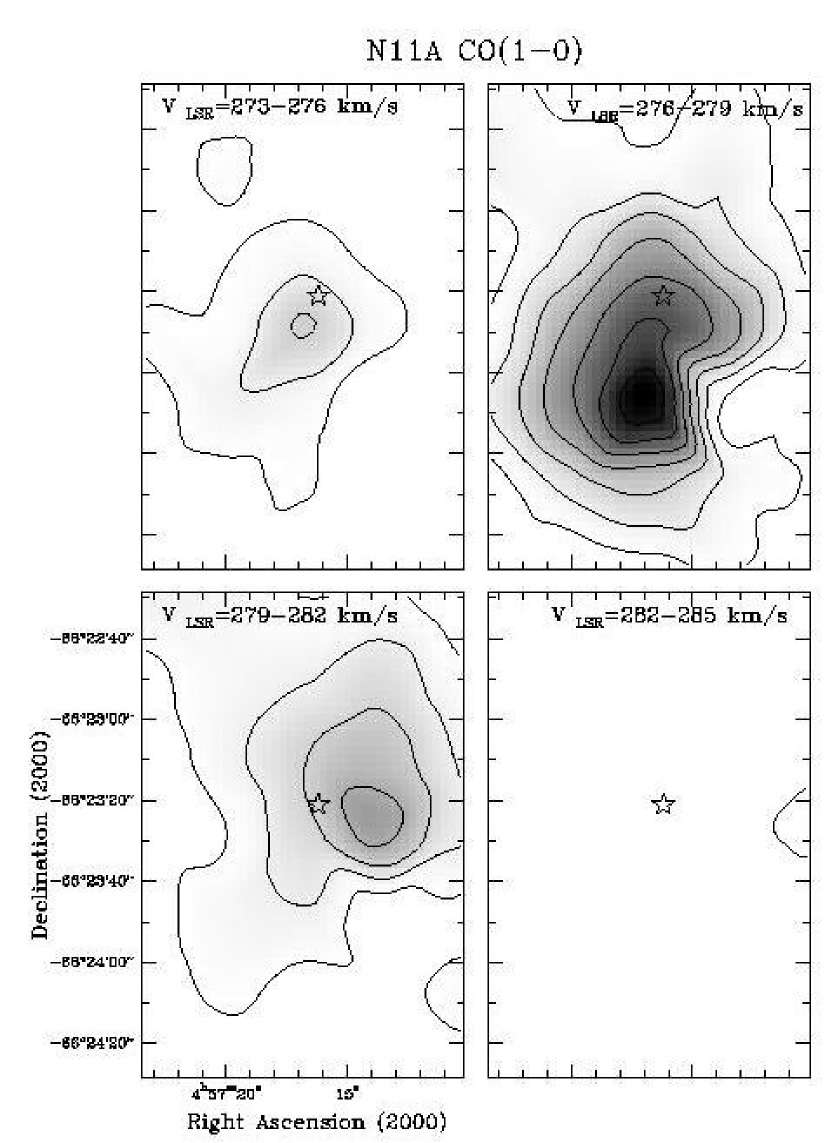
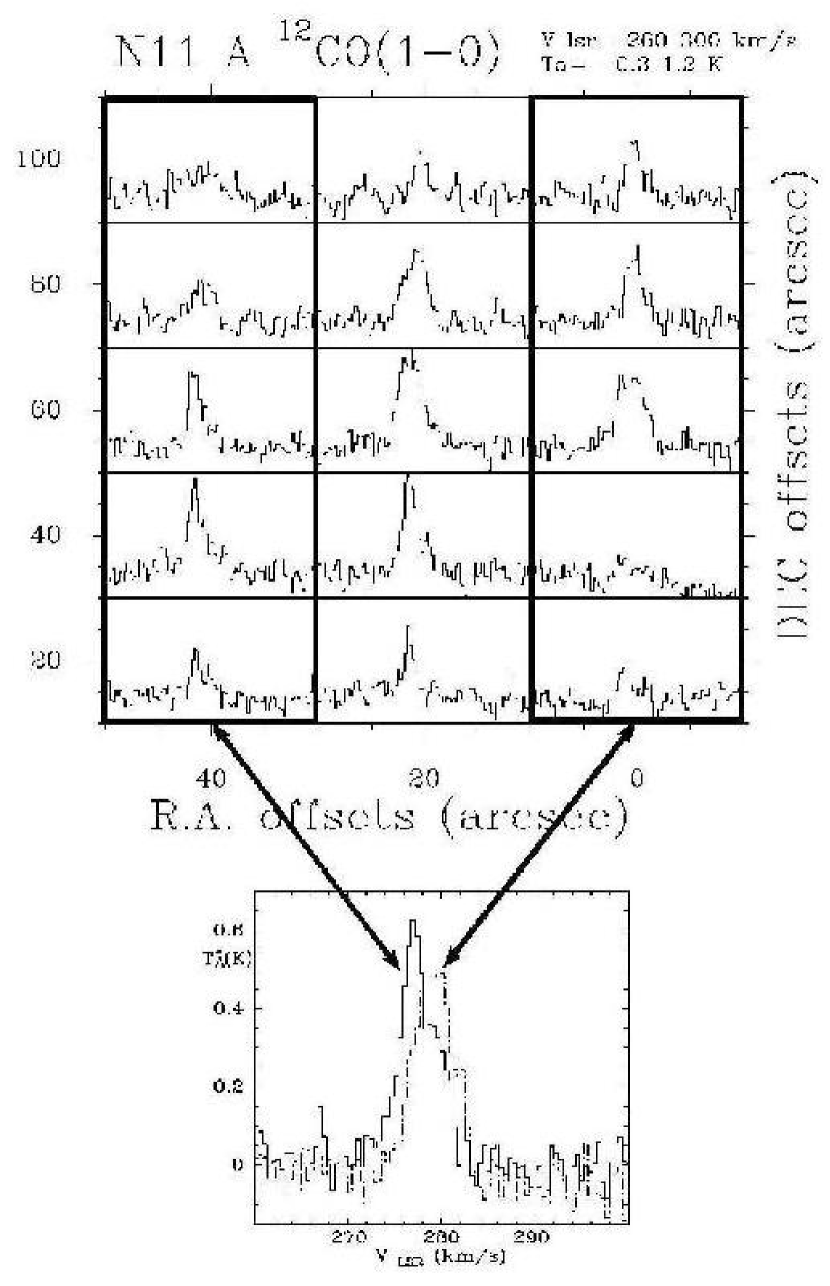
The velocity information of the CO gas supports this scenario. Figure 6 shows four different velocity integrated channel maps each with 3 km s-1 range. The position of the compact group of massive stars is indicated by a star in each panel. The CO emission peaks to the south of the stars in the velocity range km s-1 while it peaks to the west at the velocity range km s-1. So, there is gas spatially concentrated at different velocities. Figure 7 shows the CO spectra around the compact cluster. We have integrated the emission to the east and west of the cluster, as indicated in the figure, and the resultant CO spectra clearly show a velocity separation of 2 km s-1. Thus, the molecular gas is being accelerated and we see either an expanding envelope or the interaction of the cluster and the molecular gas which has produced a cavity. This cavity is formed in the thinner region of the parental molecular cloud. The molecular gas towards this direction has a greater velocity than that towards the densest part of the molecular cloud. We plan to obtain more sensitive and higher spatial resolution CO observations of this region.
The CO emission distribution between N11A and N11B is devoid of molecular gas (Figure 5). There is a sharp edge in the molecular cloud west of N11A and then a huge elongated area of about pc where no molecular emission has been detected. This molecular gas void is coincident with the one present in the optical nebular emission. The nebular emission to the east of N11B shows a smooth surface as seen in the [O III] gas, suggesting that an energetic event could have taken place producing the cavity, pressing the molecular gas towards N11A and mechanically smoothing, by some shock interaction, the eastern wall of the molecular cloud N11B. The compression of the molecular cloud in N11A could have favoured the formation of a dense core that gave origin to the compact star cluster (PGMW 3264). Alternatively, the energetic event could have favoured the gas evacuation around the new born stars.
Sensitive and better spatially sampled observations of the molecular gas in N11B using the CO emission line are underway. Preliminary results show that the distribution of the molecular gas is similar to the one found in CO). There seems to be a different CO/CO ratio towards the peak of N11B (Rubio M., private communication).
3.4 A Methanol Maser
Methanol (CH3OH) maser emission at 6.67 GHz is one of the strongest astrophysical masers, and therefore it has been possible to detect it in extragalactic environments. This maser emission has been established as a tracer of star-forming regions often associated to ultra-compact H II regions in our Galaxy (e.g. Caswell et al. 1995). Three methanol masers were discovered in the LMC, all of them placed in H II regions, namely: N105a (Sinclair et al. 1992), N11B (Ellingsen et al. 1994), and DEM52 (Beasley et al. 1996). The methanol maser associated with the N11B nebula is the second one in intensity, with a peak flux density of 0.3 Jy, and a heliocentric velocity of 301 km s-1(). The coordinates reported by Ellingsen et al. (1994) for this maser are , , and it was unresolved with a beam.
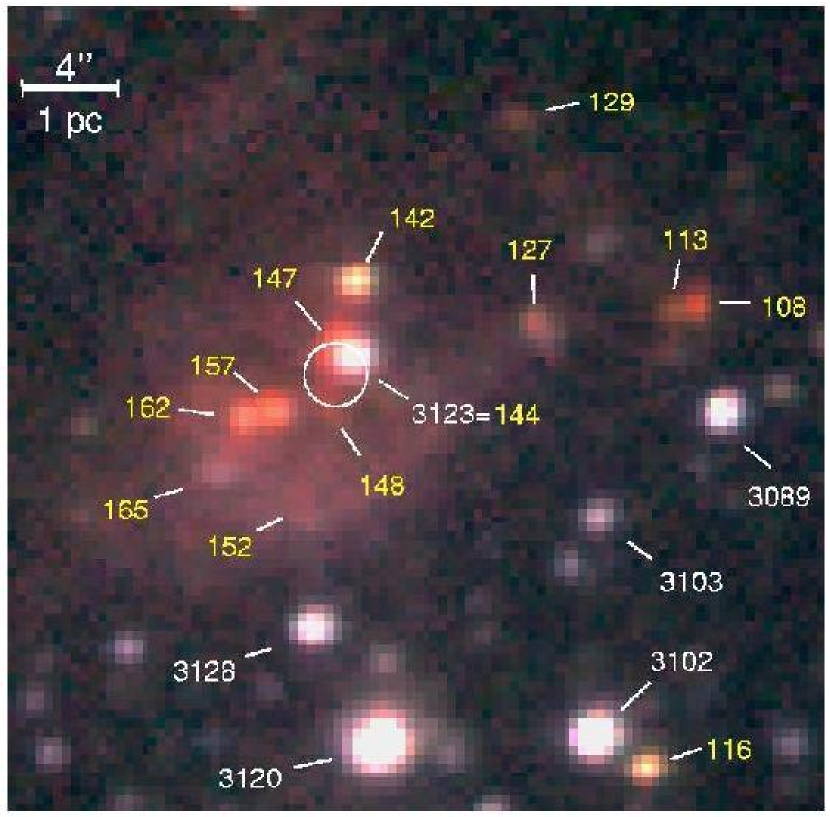
The N11B maser, according to the given radio position, is located in one of the dusty prominences where our NIR images show 3 stellar IR sources inside the ATCA beam (BRRG 144, 147, and 148). Figure 2 shows the maser position marked by a circle. Only one of these IR sources, BRRG 144, has been identified with an optical stellar source, PGMW 3123. This star has been classified as a late-O type star, O8.5 V, with usual stellar IR properties. Its IR magnitudes are , , with an expected reddening of . This O star probably belongs to the LH10 association and is probably not associated with the maser. The two other IR stellar-like sources are among the reddest sources in the field, (BRRG 147, , , ; BRRG 148, , , ). They show an intrisic IR excess and meet the Brandner et al. (2001) criterium for intermediate mass Herbig Ae/Be star candidates (Section 3.2). In the Milky Way, Walsh et al. (1999) did a NIR survey towards a selected sample of methanol maser and/or ultracompact H II regions, and they found that about 50% of the methanol masers have associated NIR counterparts. The IR counterparts were identified not only from coincidence in position, but also from the fact that they show the reddest colours in the sample. A similar scenario is found between the association of the IR sources BRRG 147 and 148 with the methanol maser in N11B.
3.5 Comparison with narrowband WFPC2 images
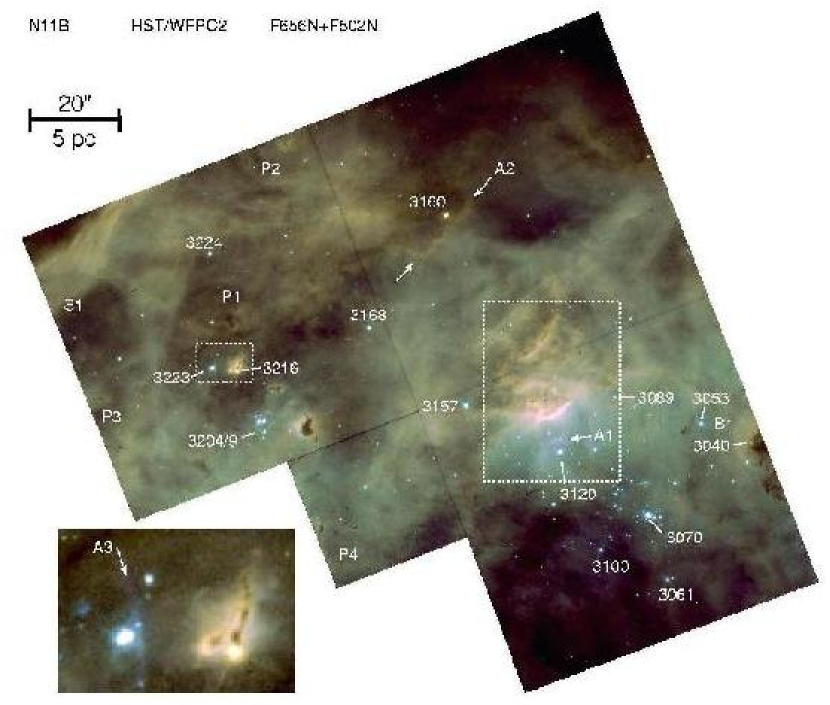
Aiming to detect optically wind-blown bubbles in the interstellar medium of N11B, Nazé et al. (2001) obtained a set of WFPC2 images in F502N ([O III]) and F656N (H) narrowband filters of such nebula. These images are a superb set to compare morphological aspects between the ionised features, molecular clouds and infrared sources distribution.
A false colour image (Figure 8) of N11B was produced by combining H (F656N) and [O III] (F502N) WFPC2 mosaics. H was mapped in red and [O III] in blue, the green channel corresponds to H and [O III] together. In this image, nebular features with high H to [O III] ratio stand out in yellowish colours, while those brighter in [O III] appear blue. Figure 8 shows that strongest the nebular emission comes from the PDR interface between the molecular gas and the ionised cavity, where several LH10 stars are located. ie. PGMW 3128, PGMW 3120. This PDR is in fact a dusty prominent feature that shows a rugged surface with many bright and dark protuberances, some of them facing to the hot stars. It also seems to be illuminated from behind due to the presence of a weaker PDR edge seen to the north east. The PDR emission pattern looks like the heads of pillars in M16 (Hester et al. 1996) as it was described by Nazé et al.(2001). These dusty features coincide with the the maximum of the CO emission as seen from the CO distribution in Figure 5.
Figure 9 shows a close-up of the dusty prominence and its neighbouring stars of the N11B WFPC2 colour mosaic display in Figure 8. The reddest IR sources (black numbers in Figure 9) detected in our images are lying toward the molecular cloud core, as expected for a star forming region signature. Some of the IR sources are associated with small dusty protuberances, such as BRRG 108, 113 and 129, while others are close to the bright H spot (sources BRRG 162 and BRRG 165). The methanol maser (marked with a blue circle) is located in a dark spot close to the weak PDR edge north of the main molecular protuberance, between sources BRRG 147 and BRRG 148.
On the surface of the molecular cloud, dark finger tip-like features are seen with bright rimmed borders and dark tails (northwest corner of Figure 9). The scale of these features is about of ( pc). Two of them have IR sources, BRRG 108 and BRRG 129, directly associated. Their appearance is similar to those discovered by Scowen et al. (1998) (see also Barbá et al. 1999) in the inner cavity of the 30 Dor Nebula. Those in N11B possibly present a different illumination pattern. Walborn et al. (1999a) discovered IR sources embedded in dark globules in the 30 Dor region. Thus, N11B would be the second region in the LMC where these finger-like features with IR sources are detected. The two sources associated with these features, BRRG 108, and 129, plus BRRG 113 (very close to BRRG 108) satisfy the criterion suggested by Brandner et al. (2001) for intermediate-mass Herbig Ae/Be candidates in 30 Dor.
To the south of the PDR, there is a well defined nebular ring seen in bluish colour in Figure 9 around PGMW 3120. It consists of a segmented nebular arc of about radius. Although, Nazé et al. (2001) did a detailed nebular kinematic study of N11B, defining several shells from the H and [N II] emission line splitting, they found that this nebular ring was not detected as a kinematical feature in their echellograms. Their kinematic analysis around PGMW 3120 reveals a huge shell extending to the south, east, and west as seen in the splitting of the nebular line emission. Towards the north of PGMW 3120, Nazé et al. (2001) detect the emission line splitting, but at a distance of , where the bright ring is located, the lines do not show any splitting further north (see their Figure 10). They suggest that the small H arc is probably “fortuitous”.
We propose an alternative interpretation for this nebular arc. Photodissociation regions are characterised not only by the presence of a molecular cloud surface that is being photodissociated and photoionised, but also by the existence of a photoevaporative flow. This flow has been detected in several PDRs where the strong radiation field is acting on the molecular cloud surface, and a clear example of this phenomenon are M16’s Elephant Trunks (Hester et al. 1996). As we have mentioned earlier, the HST/WFPC2 images of N11B show the same morphological pattern in the nebular emission close to the dusty prominence. The H and [O III] images show clear striation patterns peperdicular to the molecular interface, where photoevaporated gas is streaming away from the molecular cloud toward the ionised H II region. This striation pattern is clearly seen in N11B, despite of the factor 25 greater in distance between M16 and the LMC. Thus, the ring around PGMW 3120 is probably due to the interaction between the stellar winds and the photoevaporative outflow which produces a concentration of gas at the region where the winds and the photoevaporation flow interact. This would be the case in the northern region of PGMW 3120. At the position of the optical nebular arc there is no cavity, and the nebular spectrum does not show further splitting. To the north of the ring the region is dominated by the photoevaporative flow and not by the stellar winds that are responsible for the splitting seen in the nebular lines in all other directions. The “kinematic expanding shell” proposed by Nazé et al. (2001) does not continue to the north of PGMW 3120.
3.6 PDR and other nebular structures
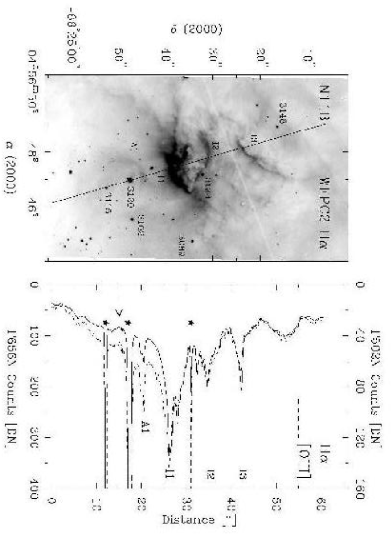
The structure of the PDR’s in H and [O III] emission lines accross PGMW 3120 is mapped along an almost north-south cut in Figure 10. The emission line surface brightness (in detector counts) shows distinctive features. Three main PDRs are identified across the line and labelled with , , and .
The PDR shows a typical ionisation structure where H emission appears more deeply concentrated in the interface than the [O III] emission line which peaks at the outer edge of the interface. Unfortunately, there are no [S II] HST images yet, but we would expect filamentary structures in such images, similar to those seen in the 30 Doradus region (Scowen et al. 1998; Rubio et al. 1998).
The PDR interfaces and are facing each other indicating the presence of a ionised cavity in between. This cavity is also detectable in the kinematic profile presented by Nazé et al. (2001). In their Figure 10 it is possible to see a strong double-peak emission line profile developing at accross the region (see PGMW 3223 EW profile). The star PGMW 3123 (O8.5 V) is located in the cavity and is perhaps contributing with UV photons. There may be some other hot stars hidden in the dusty prominence which appears similar to a wide pillar feature.
Following the emission line spatial structure of the PDR from the interface to the south, the arc around PGMW 3120 (labelled ) is found, as well as a deep depression in both the H and [O III] flux distribution immediately south of the stars. This spatial distribution suggests that the gas density around the stars is depleted to the south. To the north, the stellar winds are interacting with the PDR outflow. This region could be an interesting area in which to investigate the energy balance and deposition energy of early O stars in a pristine H II region with well developed PDR interfaces.
Other interesting features in the N11B region are two arcs labelled as and in Figure 8. Nazé et al. (2001) suggested that arc could be identified as part of a ring nebula around the K I star PGMW 3160, and they proposed that the optical filaments were not associated with dusty features. We believe that such filament could well be another PDR facing the main group of hot stars of the LH10 association. This PDR appears to run parallel to the PDR interface described above. In a close inspection of the WFPC2 images, the arc shows the same spatial structure as the PDR but with a fainter emission. In Figure 8 the arc stands out as a yellowish colour filament indicating a higher H to [O III] emission ratio (as also noted by Nazé et al. 2001). The distribution of PDRs in this part of the molecular cloud looks like the bright rimmed borders of a thunderstorm cloud illuminated at the sunset. The dark region of the image to the north of PGMW 3160 seems to be in the shadow of the molecular cloud, protected from the UV light produced by the hot stars of LH10.
A tiny arc, labelled in the inset of Figure 8, appears just close to PGMW 3223666This star is resolved in two components in WFPC2 images, with an intensity ratio in H filter of about 1:0.6 and a separation of ) an O8.5 V star. The arc is located in between the stars and the Y-shaped cometary dust clouds described by Nazé et al. (2001). This arc could be of similar nature as that seen around of PGMW 3120. The outflow pattern seen around the east branch of the Y-shaped cloud suggests that PGMW 3223 could contribute to its photoevaporation. Nazé et al. (2001) identified a star with strong H emission in the tip of the Y-shaped dust cloud and suggested that this star is part of the ongoing star formation in the region. The star, identified as PGMW 3216, has , , , and indicating that it is an obscured hot source. A secondary maximum of the CO emission is located in this region (see Figure 5), favouring the scenario of star-forming activity in such place.
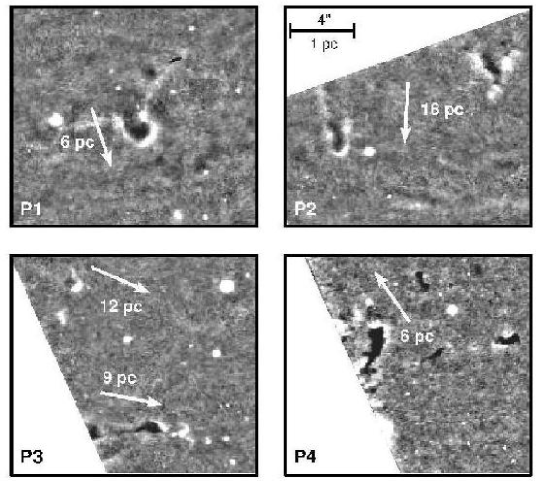
Pointing toward the stars PGMW 3204/09 there are several dusty clouds, some of them showing PDR interfaces. The kiwi shaped cloud at to the west of those stars was nicely described by Nazé et al. (2001). The rimmed finger-like features with bright tips, labelled , , and in Fig. 8 are shown in Fig. 11. They show an illuminated surface facing PGMW 3204/09 possibly due to the UV radiation engraving the molecular cloud as far as (15pc) from the stars. This Figure was done by subtracting a 15 pixels median image from the F656N image. This procedure allows us to enhance the contrast between the bright and dark areas, eliminating the diffuse emission component. The arrows point to the direction to PGMW 3204/09 star group for each feature. It also indicates the projected linear distance to those stars.
There are dusty filamentary structures which don’t seem to be directly illuminated by the hot stars, located to the south and east of PGMW 3070 (see Fig. 8). The presence of these dusty clouds could be relevant for the cluster studies as they can be responsible for spacial variable extinction at the scale of few tenths of arceseconds in the LH10 area.
A very filamentary cloud appears close to the the west corner of the WFPC2 images with an embedded star labelled in Fig. 8. This is the BRRG 26 source (, , ) in our IR images which shows a compact nebulosity. The source is embedded in the tip of the dark pillar which appears as a yellowish (H emission) semicircle of about (1.25 pc) radii, producing a Strömgren-like sphere. It is also identified as PGMW 3040 ().
In the east corner of Fig. 8 (labelled with ) there are several parallel filaments. These filaments could be the surface of the molecular cloud facing the cavity described in Section 3.3.
3.7 Other early O stars in LH10
The LH10 association is very rich in O stars and it is obvious that the WPFC2 images help to resolve tight stellar systems in some objects, like PGMW 3204/09 (Walborn et al. 1999b) and PGMW 3264 (N11A, Heydari-Malayeri et al. 2001) and PGMW 3120, PGMW 3223 in this paper.
PGMW 3120 is a very interesting object. The star was classified by Parker et al. (1992) as O5.5 V((f*)), with the peculiarity of displaying N IV 4058Å emission and N V 4604Å absorption simultaneously, two lines which are not expected to be present in an O5.5 V spectral type star. In the WFPC2 narrowband images, PGMW 3120 appears composed of 3 stars of similar brightness (1:0.88:0.82 in H) forming almost an equilateral triangle with of separation between them. The peculiar spectral classification could be explained if one of the brightest components is an O3 star 777Recently, a new spectrum of PGMW 3120 obtained at ESO by D. Lennon was analysed by N. Walborn, who couldn’t detect N IV emission and N V absorption above the noise level, discharging the possible presence of an O3 star. Additional spectroscopic observations are planned for this interesting object..
Heydari-Malayeri & Testor (1983) indicated that PGMW 3070 ( object in their paper) has probably a multiple nature. Parker et. al (1992) concluded that the star is resolved into 5-7 components with an integrated spectral type O6 V. In our IR images 9 stars are found in a circle of (1 pc) radii. Their IR magnitudes and colours look like an OB open cluster with low reddening. Three of these are bright IR sources, BRRG 75, 67, and 61, in order of brightness. The WFPC2 images show 18 components in the same area where 9 are seen in the IR. PGMW 3070 is resolved in four components packed in a circle of (0.12 pc) radii.
PGMW 3061 was classified by Parker et al. (1992) as a classic example of O3 III(f*) giant star with a possible faint blend (PGMW 4020), with . In our IR images the object appears as a double star, BRRG 146, with a relatively bright IR close companion, BRRG 49 at , and .
PGMW 3126 (O6.5 Vz) and PGMW 3128 (O9.5 IV) are both double stars with faint companions at about in WFPC2 images. The IR counterparts of these O stars are seen as the single star BRRG 146, and BRRG 150, respectively.
All these O stars show normal IR colours in our colour-magnitude and colour-colour diagrams.
4 Discussion and summary
We confirm that a second generation of stars is currently forming in the N11B region. Our IR images show the presence of several bright IR sources which appear located toward the molecular cloud as seen from the CO emission in the area. Several of these sources show IR colours with YSO characteristics and they are prime candidates to be intermediate-mass Herbig Ae/Be stars following the criterion of Brandner et al. (2001). For the first time, an extragalactic methanol maser is directly associated with IR sources embedded in a molecular core. Two IR sources, BRRG 147 and 148, are found at (0.5 pc) of the methanol maser reported position. They are among the reddest IR sources in N11B and therefore the strongest candidates of YSOs. IR spectroscopy of these sources will reveal their nature.
The overall picture of N11B including the CO and ionised gas distributions clearly demonstrate that the nebula is a region of interaction between stellar winds and UV radiation from hot young stars, as well as of PDRs in the molecular clouds originated by the action of such stars. Almost all the optical nebular emission in N11B is directly associated with CO emission, suggesting that the main source of such optical emission comes from the molecular cloud surface, where the gas is photoevaporated and ionised. In fact, all the brighter optical nebular emission filaments and peaks are PDRs facing the hot stars: a bright rim to the north of the multiple O star PGMW 3120, a Y-shaped cometary globule close to the double O star PGMW 3223, a kiwi-shaped globule to the west of the multiple early-O star PGMW 3204/09
The nebular knot N11A to the east of N11B is also associated with a molecular cloud core. This knot is excited by the multiple O star PGMW 3264, and we find evidence of the interaction of the stellar winds and the molecular gas. This nebula has the morphology and kinematics of a champagne flow where the massive stars have open a cavity in their parental molecular cloud. Future IR data will allow to search for IR embedded sources in the region.
Walborn & Parker (1992) proposed that N11 was few years older than the 30 Doradus, based on their analysis of the relative ages of the stellar content of both giant H II regions. In 30 Doradus, a new generation of massive stars is currently being formed in the peripherical molecular clouds apparently due to the energetic activity of the hot massive stellar core R136 (Rubio et al. 1998; Walborn et al. 1999a; Brandner et al. 2001). The stellar content of such new generation in 30 Doradus has O stars embedded in compact nebulosities (Walborn et al. 2002 and references therein), with a relative age of about 1-2 Myr younger than the core R136, characterised by the presence of luminous H-burning WN stars with an age of about 2 Myr. Walborn et al. (1999b) derived an age of about 3.5 Myr for the LH9 association in the N11 core, and less than 1 Myr for PGMW 3209 in LH10. Their results confirm the youth of the LH10 association (also deduced from absence of WR stars), and that the N11 region is older than 30 Doradus.
Our study supports the idea that N11B is in a later stage of evolution than 30 Doradus. It shows a lack of bright IR sources compared to the star forming regions in 30 Dor. Our brightest IR source has , while several IR embedded stars were observed in 30 Dor. The IR sources in N11B are probably intermediate mass star candidates still embedded in the molecular gas. The O stars have blown away the molecular material and are disrupting the molecular cloud surface. Thus, we may be witnessing the last stage of the second generation burst in N11B.
References
- (1) Arnal, E. M., Cersosimo, J. C., May, J., Bronfman, L. 1987, A&A, 174, 78
- (2) Barbá, R. H., Walborn, N. R., & Rubio, M. 1999, RMxAAC, 8, 161
- (3) Beasley, A. J., Ellingsen, S. P., Claussen, M. J., & Wilcots, E. 1996, ApJ, 459, 600
- (4) Bodenheimer, P., Tenorio-Tagle, G., & Yorke, H. W. 1979, ApJ, 233, 85
- (5) Brandner, W., Grebel, E. K., Barbá, R. H., Walborn, N. R., & Monetti, A. 2001, AJ, 122, 858
- (6) Caldwell, D. A., & Kutner, M. L. 1996, ApJ, 472, 611
- (7) Caswell, J., Vaile, R., Ellingsen, S., Whiteoak, J., & Norris, R. 1995, MNRAS, 272, 96
- (8) Cutri, R.M. et al. 2000, Explanatory Supplement to the 2MASS Second Incremental Data Release (Pasadena: Caltech)
- (9) Davies, R. D., Elliot, K. H., & Meaburn, J. 1976, MNRAS, 81, 89
- (10) Ellingsen, S. P., Whiteoak, J. B., Norris, R. P., Caswell, J. L., & Vaile, R. A. 1994, MNRAS, 269, 1019
- (11) Elmegreen, B. G. 1998, in “Origins”, ASP Conf. Ser. 148, C. E. Woodward, J. M. Shull, & H. A. Thronson, Jr. (Provo: ASP), 150
- (12) Elmegreen, B. G. & Lada, C.J. 1977, ApJ, 214, 725
- (13) Hanson, M. M., Howarth, I. D., & Conti, P. S. 1997, ApJ, 489, 698
- (14) Henize, K. G. 1956, ApJS, 2, 315
- (15) Hester, J. J. et al. 1996, AJ, 111, 2349
- (16) Heydari-Malayeri, M., & Testor, G. 1983, A&A, 118, 116
- (17) Heydari-Malayeri, M., & Testor, G. 1985, A&A, 144, 98
- (18) Heydari-Malayeri, M., Royer, P., Rauw, G., & Walborn, N. R. 2000, A&A, 361, 877
- (19) Heydari-Malayeri, M., Charmandaris, V., Deharveng, L., Rosa, M. R., Schaerer, D., & Zinnecker, H. 2001, A&A, 372, 527
- (20) Israel, F. P. & de Graauw, Th. 1991, in “The Magellanic Clouds”, IAU Symposium No. 148, R. Haynes & D. Milne eds. (Dordrecht: Kluwer), 45
- (21) Israel, F. P. et al. 2002, A&A, submitted
- (22) Kennicut, R. C. Jr. & Hodge, P. W. 1986, ApJ, 306, 130
- (23) Lucke, P. B. & Hodge, P. W. 1970, AJ, 75, 171
- (24) Nazé, Y., Chu, Y.-H., Points, S. D., Danforth, C. W., Rosado, M., & Chen, C.-H. R. 2001, AJ, 122, 921
- (25) Oey, M. S. 1999, in “New Views of the Magellanic Clouds”, IAU Symposium Vol. 190, Y-H. Chu, N.R. Suntzeff, J.E. Hesser, & D.A. Bohlender, eds. (Provo: ASP), 78
- (26) Parker, J. Wm., Garmany, C. D., Massey, P., & Walborn, N. R. 1992, AJ, 103, 1205 (PGMW)
- (27) Persson, S. E., West, S. C., Carr, D. M., Sivaramakrishnan, A., & Murphy, D. C. 1992, PASP, 104, 204
- (28) Persson, S. E., Murphy, D. C., Krzeminski, W., Roth, M., & Rieke, M. J. 1998, AJ, 116, 2475
- (29) Rosado, M., Laval, A., Le Coarer, E., Georgelin, Y. P., Amram, P., Marcelin, M., Goldes, G., & Gach, J. L. 1996, A&A, 308, 588
- (30) Rubio, M., Barbá, R. H., Walborn, N. R., Probst, R. G., García, J., & Roth, M. R. 1998, AJ, 116, 1708
- (31) Scowen, P. A. et al. 1998, AJ, 116, 163
- (32) Sinclar, M. W., Carrad, G. J., Caswell, J. L., Norris, R. P., & Whiteoak, J. B. 1992, MNRAS, 256, 33
- (33) Smith, N., Egan, M. P., Carey, S., Price, S. D., Morse, J. A., & Price, P. A. 2000, ApJ, 532, L145
- (34) Tenoglio-Tagle, G. 1979, A&A, 71, 79
- (35) Vacca, W.D., Garmany, C.D., & Shull, J.M. 1996, ApJ, 460, 914
- (36) Walborn, N.R. & Parker, J.Wm. 1992, ApJ, 399, L87
- (37) Walborn, N. R., Barbá, R. H., Brandner, W., Rubio, M., Grebel, E. K., & Probst, R. G. 1999a, AJ, 117, 225
- (38) Walborn, N. R., Drissen, L., Parker, J. Wm., Saha, A., MacKenty, J. W., & White, R. L. 1999b, AJ, 118, 1684
- (39) Walborn, N. R., Maíz-Apellániz, J., & Barbá, R. H. 2002, AJ, in press
- (40) Walsh, A. J., Burton, M. G., Hyland, A. R., & Robinson, G. 1999, MNRAS, 905, 922
- (41) Wang, Q. & Helfand, D. J. 1991, ApJ, 373, 497
- (42)
- (43)
| BRRG # | Comment11Optical counterpart stars are numbered from Parker et al. 1992 | ||||||||||
|---|---|---|---|---|---|---|---|---|---|---|---|
| 1 | 4:56:34.87 | 17.58 | 0.11 | 16.90 | 0.08 | 16.86 | 0.07 | 4010 | |||
| 2 | 4:56:34.98 | 15.22 | 0.03 | 15.24 | 0.02 | 15.21 | 0.03 | 3016 | |||
| 3 | 4:56:34.98 | 16.06 | 0.04 | 15.46 | 0.03 | 15.25 | 0.02 | ||||
| 4 | 4:56:35.26 | 17.06 | 0.05 | 16.35 | 0.04 | 16.27 | 0.04 | ||||
| 5 | 4:56:35.41 | 16.69 | 0.04 | 16.42 | 0.06 | 16.37 | 0.07 | 3019 | |||
| 6 | 4:56:35.51 | 17.60 | 0.06 | 17.03 | 0.07 | 16.84 | 0.07 | ||||
| 7 | 4:56:35.94 | 18.54 | 0.10 | 17.55 | 0.09 | 16.61 | 0.09 | ||||
| 8 | 4:56:35.98 | 16.33 | 0.04 | 15.61 | 0.02 | 15.40 | 0.04 | 4011 | |||
| 9 | 4:56:36.14 | 17.00 | 0.05 | 15.95 | 0.05 | 15.30 | 0.05 | ||||
| 10 | 4:56:36.67 | 15.86 | 0.07 | 15.63 | 0.06 | 15.57 | 0.08 | 3025, 3027 | |||
| 11 | 4:56:36.74 | 18.53 | 0.06 | 3026 | |||||||
| 12 | 4:56:37.09 | 17.52 | 0.04 | 16.98 | 0.04 | 16.90 | 0.05 | ||||
| 13 | 4:56:37.17 | 16.42 | 0.07 | 15.56 | 0.04 | 14.81 | 0.05 | 3029 | |||
| 14 | 4:56:37.25 | 17.79 | 0.05 | 17.75 | 0.08 | 17.67 | 0.10 | 3030 | |||
| 15 | 4:56:37.28 | 17.88 | 0.10 | 17.72 | 0.15 | 3031 | |||||
| 16 | 4:56:37.28 | 18.56 | 0.07 | 17.89 | 0.06 | 17.70 | 0.11 | ||||
| 17 | 4:56:37.58 | 18.65 | 0.10 | 18.25 | 0.11 | ||||||
| 18 | 4:56:37.76 | 18.43 | 0.10 | 3032 | |||||||
| 19 | 4:56:38.29 | 15.17 | 0.01 | 14.60 | 0.02 | 14.44 | 0.02 | 4013 | |||
| 20 | 4:56:38.38 | 17.51 | 0.05 | 17.09 | 0.05 | 16.92 | 0.08 | ||||
| 21 | 4:56:38.40 | 18.24 | 0.08 | ||||||||
| 22 | 4:56:38.41 | 18.58 | 0.07 | 17.56 | 0.06 | 17.13 | 0.07 | ||||
| 23 | 4:56:38.48 | 17.49 | 0.06 | 16.98 | 0.04 | 16.79 | 0.08 | ||||
| 24 | 4:56:38.82 | 18.33 | 0.08 | 18.37 | 0.12 | 3037 | |||||
| 25 | 4:56:38.98 | 17.21 | 0.04 | 17.14 | 0.06 | 17.05 | 0.08 | 3039 | |||
| 26 | 4:56:39.02 | 16.53 | 0.08 | 16.07 | 0.10 | 15.88 | 0.10 | 3040 | |||
| 27 | 4:56:39.24 | 14.99 | 0.02 | 15.05 | 0.02 | 15.07 | 0.03 | 3042 | |||
| 28 | 4:56:39.32 | 17.65 | 0.05 | 17.60 | 0.07 | 17.73 | 0.09 | 3043 | |||
| 29 | 4:56:39.53 | 17.66 | 0.06 | 17.57 | 0.06 | 17.63 | 0.10 | 3044 | |||
| 30 | 4:56:39.55 | 18.28 | 0.08 | 17.84 | 0.07 | 17.62 | 0.07 | ||||
| 31 | 4:56:39.84 | 15.35 | 0.01 | 15.43 | 0.01 | 15.42 | 0.03 | 3045 | |||
| 32 | 4:56:39.88 | 17.43 | 0.07 | 17.59 | 0.11 | 17.61 | 0.13 | 3046 | |||
| 33 | 4:56:39.93 | 17.75 | 0.05 | 17.85 | 0.06 | 17.74 | 0.09 | 3047 | |||
| 34 | 4:56:39.98 | 17.92 | 0.06 | 17.83 | 0.08 | 17.88 | 0.13 | 3048 | |||
| 35 | 4:56:40.05 | 17.31 | 0.04 | 16.76 | 0.04 | 16.71 | 0.06 | 4015 | |||
| 36 | 4:56:40.68 | 16.46 | 0.03 | 16.54 | 0.04 | 16.53 | 0.05 | 3051 | |||
| 37 | 4:56:40.84 | 17.81 | 0.05 | 17.33 | 0.04 | 17.20 | 0.07 | ||||
| 38 | 4:56:41.06 | 17.36 | 0.04 | 16.73 | 0.04 | 16.47 | 0.04 | ||||
| 39 | 4:56:41.10 | 13.32 | 0.01 | 13.33 | 0.01 | 13.34 | 0.02 | 3053 | |||
| 40 | 4:56:41.39 | 18.34 | 0.10 | 18.01 | 0.09 | 17.77 | 0.12 | ||||
| 41 | 4:56:41.45 | 18.37 | 0.07 | 18.22 | 0.10 | 3055 | |||||
| 42 | 4:56:41.77 | 17.59 | 0.07 | 17.11 | 0.05 | 16.90 | 0.06 | ||||
| 43 | 4:56:41.84 | 18.46 | 0.06 | 18.29 | 0.09 | 4018 | |||||
| 44 | 4:56:42.02 | 17.96 | 0.07 | 17.71 | 0.06 | 17.55 | 0.10 | 3056 | |||
| 45 | 4:56:42.08 | 17.90 | 0.06 | 17.52 | 0.07 | 17.26 | 0.07 | ||||
| 46 | 4:56:42.08 | 17.64 | 0.11 | 17.55 | 0.17 | ||||||
| 47 | 4:56:42.09 | 17.39 | 0.04 | 17.41 | 0.06 | 17.49 | 0.08 | 3057 | |||
| 48 | 4:56:42.16 | 14.27 | 0.01 | 14.27 | 0.02 | 14.23 | 0.02 | 3058 | |||
| 49 | 4:56:42.30 | 15.10 | 0.02 | 14.71 | 0.02 | 14.59 | 0.02 | 4020 | |||
| 50 | 4:56:42.40 | 17.80 | 0.06 | 17.62 | 0.06 | 17.09 | 0.08 | ||||
| 51 | 4:56:42.42 | 18.13 | 0.08 | 4023 | |||||||
| 52 | 4:56:42.42 | 18.12 | 0.08 | 17.47 | 0.06 | 17.30 | 0.10 | ||||
| 53 | 4:56:42.43 | 16.48 | 0.03 | 16.55 | 0.03 | 16.44 | 0.05 | 3059 | |||
| 54 | 4:56:42.46 | 17.85 | 0.05 | 17.33 | 0.04 | 17.16 | 0.07 | ||||
| 55 | 4:56:42.51 | 17.97 | 0.07 | 17.41 | 0.06 | 17.34 | 0.10 | 4022 at | |||
| 56 | 4:56:42.52 | 13.69 | 0.01 | 13.72 | 0.01 | 13.71 | 0.02 | 3061 | |||
| 57 | 4:56:42.62 | 18.42 | 0.08 | 17.76 | 0.07 | 17.72 | 0.10 | ||||
| 58 | 4:56:42.65 | 17.93 | 0.05 | 17.79 | 0.07 | 17.84 | 0.09 | 3062 | |||
| 59 | 4:56:42.79 | 17.75 | 0.10 | 17.22 | 0.06 | 16.99 | 0.07 | 4025 at | |||
| 60 | 4:56:42.79 | 18.37 | 0.08 | 4024 | |||||||
| 61 | 4:56:42.79 | 15.42 | 0.04 | 15.38 | 0.04 | 15.36 | 0.03 | 3063 | |||
| 62 | 4:56:42.85 | 18.04 | 0.08 | 17.79 | 0.09 | 17.54 | 0.12 | ||||
| 63 | 4:56:42.86 | 18.49 | 0.08 | 18.16 | 0.06 | ||||||
| 64 | 4:56:42.94 | 16.55 | 0.13 | 16.48 | 0.12 | 16.37 | 0.14 | 3064 | |||
| 65 | 4:56:42.96 | 17.71 | 0.06 | 17.50 | 0.09 | 17.06 | 0.07 | ||||
| 66 | 4:56:42.98 | 18.34 | 0.05 | 4026 | |||||||
| 67 | 4:56:43.04 | 13.86 | 0.03 | 13.80 | 0.03 | 13.78 | 0.03 | 3065 | |||
| 68 | 4:56:43.14 | 17.86 | 0.06 | 17.82 | 0.06 | 17.71 | 0.10 | 3067 | |||
| 69 | 4:56:43.15 | 17.93 | 0.07 | 17.13 | 0.05 | 16.77 | 0.07 | ||||
| 70 | 4:56:43.19 | 15.01 | 0.02 | 14.24 | 0.01 | 14.07 | 0.02 | 4027 | |||
| 71 | 4:56:43.21 | 18.29 | 0.07 | 18.23 | 0.09 | 3068 | |||||
| 72 | 4:56:43.23 | 16.28 | 0.09 | 16.17 | 0.09 | 16.35 | 0.09 | 3069 | |||
| 73 | 4:56:43.28 | 17.55 | 0.07 | 17.25 | 0.08 | 17.07 | 0.09 | ||||
| 74 | 4:56:43.29 | 18.09 | 0.06 | 17.60 | 0.07 | 17.24 | 0.08 | ||||
| 75 | 4:56:43.29 | 12.65 | 0.04 | 12.63 | 0.04 | 12.65 | 0.04 | 3070, Multiple star | |||
| 76 | 4:56:43.30 | 16.54 | 0.02 | 16.03 | 0.03 | 15.84 | 0.03 | 4028 | |||
| 77 | 4:56:43.31 | 16.88 | 0.03 | 16.84 | 0.03 | 16.79 | 0.04 | 3071 | |||
| 78 | 4:56:43.34 | 17.06 | 0.07 | 16.89 | 0.07 | 16.87 | 0.12 | 4029 | |||
| 79 | 4:56:43.37 | 18.53 | 0.09 | 18.32 | 0.10 | 3072 | |||||
| 80 | 4:56:43.38 | 14.85 | 0.05 | 14.88 | 0.05 | 14.82 | 0.05 | 3073, 3075 at | |||
| 81 | 4:56:43.46 | 18.20 | 0.10 | 18.02 | 0.11 | ||||||
| 82 | 4:56:43.74 | 17.64 | 0.06 | 17.40 | 0.08 | 17.43 | 0.10 | 4031 | |||
| 83 | 4:56:43.75 | 17.44 | 0.04 | 16.91 | 0.04 | 16.60 | 0.05 | ||||
| 84 | 4:56:43.77 | 16.86 | 0.03 | 16.79 | 0.04 | 16.71 | 0.05 | 3078 | |||
| 85 | 4:56:43.77 | 16.51 | 0.03 | 16.52 | 0.03 | 16.50 | 0.05 | 3077 | |||
| 86 | 4:56:43.79 | 16.68 | 0.09 | 16.83 | 0.09 | 16.60 | 0.11 | 3076 | |||
| 87 | 4:56:43.81 | 18.19 | 0.10 | 17.85 | 0.09 | 17.60 | 0.11 | ||||
| 88 | 4:56:43.89 | 16.58 | 0.04 | 16.39 | 0.04 | 16.15 | 0.04 | 3079 | |||
| 89 | 4:56:43.91 | 18.50 | 0.06 | 17.78 | 0.06 | 17.01 | 0.06 | ||||
| 90 | 4:56:43.93 | 18.33 | 0.07 | 17.72 | 0.05 | 17.40 | 0.08 | ||||
| 91 | 4:56:43.95 | 17.22 | 0.04 | 17.37 | 0.07 | 17.19 | 0.05 | 3080 | |||
| 92 | 4:56:44.06 | 15.64 | 0.05 | 15.66 | 0.03 | 15.60 | 0.05 | 3081, 3083 at | |||
| 93 | 4:56:44.11 | 16.90 | 0.05 | 16.92 | 0.04 | 16.95 | 0.06 | 3082 | |||
| 94 | 4:56:44.15 | 17.31 | 0.06 | 17.12 | 0.07 | 16.97 | 0.08 | 3084 | |||
| 95 | 4:56:44.19 | 17.69 | 0.04 | 17.26 | 0.03 | 17.03 | 0.05 | ||||
| 96 | 4:56:44.20 | 17.63 | 0.06 | 17.03 | 0.05 | 16.95 | 0.07 | ||||
| 97 | 4:56:44.27 | 18.58 | 0.12 | 3085 at | |||||||
| 98 | 4:56:44.41 | 16.38 | 0.05 | 16.35 | 0.06 | 16.38 | 0.07 | 3087 | |||
| 99 | 4:56:44.45 | 18.47 | 0.13 | ||||||||
| 100 | 4:56:44.47 | 17.68 | 0.06 | 17.53 | 0.09 | 17.52 | 0.09 | 3091 | |||
| 101 | 4:56:44.48 | 15.93 | 0.05 | 15.91 | 0.06 | 15.93 | 0.04 | 3088 | |||
| 102 | 4:56:44.58 | 14.85 | 0.01 | 14.87 | 0.02 | 14.84 | 0.02 | 3089 | |||
| 103 | 4:56:44.61 | 15.24 | 0.01 | 15.30 | 0.01 | 15.24 | 0.02 | 3090 | |||
| 104 | 4:56:44.63 | 15.94 | 0.04 | 15.97 | 0.05 | 15.90 | 0.04 | 3092 | |||
| 105 | 4:56:44.68 | 15.68 | 0.02 | 15.58 | 0.01 | 15.43 | 0.03 | 3093 | |||
| 106 | 4:56:44.72 | 16.17 | 0.03 | 16.14 | 0.03 | 16.19 | 0.04 | 3095 | |||
| 107 | 4:56:44.74 | 18.45 | 0.11 | 18.18 | 0.07 | ||||||
| 108 | 4:56:44.76 | 18.48 | 0.10 | 17.22 | 0.06 | 16.02 | 0.06 | ||||
| 109 | 4:56:44.79 | 17.22 | 0.04 | 16.72 | 0.05 | 16.63 | 0.05 | 4034 | |||
| 110 | 4:56:44.80 | 18.24 | 0.07 | ||||||||
| 111 | 4:56:44.81 | 15.32 | 0.05 | 15.33 | 0.04 | 15.37 | 0.04 | 3097, 3096 at | |||
| 112 | 4:56:44.86 | 17.43 | 0.06 | 17.51 | 0.07 | 17.50 | 0.08 | 3099 | |||
| 113 | 4:56:44.93 | 17.52 | 0.08 | 16.75 | 0.09 | ||||||
| 114 | 4:56:44.95 | 18.26 | 0.06 | 18.06 | 0.08 | ||||||
| 115 | 4:56:44.96 | 17.40 | 0.04 | 16.94 | 0.03 | 16.74 | 0.05 | ||||
| 116 | 4:56:45.06 | 16.05 | 0.03 | 15.40 | 0.01 | 15.16 | 0.03 | ||||
| 117 | 4:56:45.09 | 16.67 | 0.05 | 16.50 | 0.07 | 16.62 | 0.06 | 3101 | |||
| 118 | 4:56:45.11 | 18.55 | 0.08 | ||||||||
| 119 | 4:56:45.22 | 13.70 | 0.01 | 13.69 | 0.01 | 13.67 | 0.02 | 3100 | |||
| 120 | 4:56:45.24 | 18.06 | 0.06 | 17.70 | 0.06 | 17.47 | 0.06 | ||||
| 121 | 4:56:45.38 | 16.03 | 0.04 | 16.05 | 0.02 | 16.06 | 0.04 | 3103 | |||
| 122 | 4:56:45.39 | 13.76 | 0.01 | 13.77 | 0.01 | 13.80 | 0.02 | 3102 | |||
| 123 | 4:56:45.41 | 17.79 | 0.08 | 17.30 | 0.07 | 17.12 | 0.10 | 3104 | |||
| 124 | 4:56:45.45 | 18.37 | 0.10 | 3105 | |||||||
| 125 | 4:56:45.57 | 16.93 | 0.03 | 16.92 | 0.05 | 17.04 | 0.07 | 3106 | |||
| 126 | 4:56:45.64 | 17.46 | 0.06 | 17.49 | 0.06 | 17.58 | 0.08 | 3107 | |||
| 127 | 4:56:45.82 | 17.17 | 0.12 | 16.64 | 0.10 | 16.24 | 0.08 | 3108 at | |||
| 128 | 4:56:45.87 | 17.10 | 0.03 | 16.59 | 0.04 | 16.36 | 0.05 | ||||
| 129 | 4:56:45.96 | 17.85 | 0.10 | 17.07 | 0.09 | ||||||
| 130 | 4:56:46.06 | 16.44 | 0.03 | 16.41 | 0.03 | 16.38 | 0.05 | 3109 | |||
| 131 | 4:56:46.11 | 17.21 | 0.05 | 17.19 | 0.06 | 17.00 | 0.08 | 3110 | |||
| 132 | 4:56:46.33 | 17.19 | 0.09 | 17.12 | 0.09 | 17.03 | 0.06 | 3113 | |||
| 133 | 4:56:46.36 | 17.72 | 0.05 | 17.68 | 0.05 | 17.50 | 0.10 | 3116 | |||
| 134 | 4:56:46.49 | 17.86 | 0.15 | 17.39 | 0.12 | 16.99 | 0.10 | ||||
| 135 | 4:56:46.55 | 15.18 | 0.03 | 15.12 | 0.03 | 15.15 | 0.04 | 3115 | |||
| 136 | 4:56:46.58 | 17.09 | 0.04 | 16.38 | 0.04 | 16.25 | 0.05 | ||||
| 137 | 4:56:46.72 | 17.85 | 0.06 | 17.83 | 0.06 | 17.61 | 0.09 | 3118 | |||
| 138 | 4:56:46.75 | 18.07 | 0.06 | 17.59 | 0.05 | 17.34 | 0.09 | ||||
| 139 | 4:56:46.78 | 17.10 | 0.07 | 16.90 | 0.05 | 16.95 | 0.09 | 3121 | |||
| 140 | 4:56:46.83 | 12.92 | 0.03 | 12.96 | 0.03 | 12.97 | 0.04 | 3120 | |||
| 141 | 4:56:46.89 | 17.92 | 0.05 | 18.07 | 0.07 | 17.70 | 0.11 | 3122 | |||
| 142 | 4:56:47.01 | 15.82 | 0.03 | 15.25 | 0.01 | 15.06 | 0.05 | 4038 | |||
| 143 | 4:56:47.02 | 18.41 | 0.08 | 17.97 | 0.06 | 17.63 | 0.09 | ||||
| 144 | 4:56:47.03 | 14.78 | 0.02 | 14.72 | 0.02 | 14.64 | 0.05 | 3123 | |||
| 145 | 4:56:47.07 | 16.27 | 0.03 | 16.20 | 0.03 | 16.11 | 0.03 | 3127 | |||
| 146 | 4:56:47.11 | 14.10 | 0.02 | 14.08 | 0.02 | 14.05 | 0.02 | 3126 | |||
| 147 | 4:56:47.13 | 17.56 | 0.11 | 16.70 | 0.08 | 15.48 | 0.09 | ||||
| 148 | 4:56:47.17 | 17.92 | 0.11 | 16.72 | 0.12 | ||||||
| 149 | 4:56:47.23 | 16.48 | 0.07 | 16.41 | 0.07 | 16.43 | 0.09 | 3129 | |||
| 150 | 4:56:47.25 | 14.87 | 0.02 | 14.90 | 0.01 | 14.95 | 0.02 | 3128 | |||
| 151 | 4:56:47.29 | 17.69 | 0.05 | 17.59 | 0.05 | 17.53 | 0.08 | 3130 | |||
| 152 | 4:56:47.33 | 17.33 | 0.15 | 17.16 | 0.12 | 16.42 | 0.16 | 3131 at , 4039 at | |||
| 153 | 4:56:47.39 | 17.35 | 0.04 | 16.90 | 0.03 | 16.75 | 0.05 | ||||
| 154 | 4:56:47.49 | 18.46 | 0.07 | ||||||||
| 155 | 4:56:47.50 | 16.23 | 0.03 | 16.25 | 0.03 | 16.22 | 0.04 | 3134 | |||
| 156 | 4:56:47.53 | 16.82 | 0.03 | 16.83 | 0.04 | 16.76 | 0.05 | 3135 | |||
| 157 | 4:56:47.54 | 17.05 | 0.05 | 16.25 | 0.05 | 15.15 | 0.05 | 3133 | |||
| 158 | 4:56:47.55 | 18.07 | 0.11 | 17.91 | 0.11 | 17.71 | 0.11 | 3137 | |||
| 159 | 4:56:47.56 | 18.34 | 0.07 | 3136 | |||||||
| 160 | 4:56:47.61 | 17.33 | 0.04 | 16.87 | 0.03 | 16.74 | 0.07 | ||||
| 161 | 4:56:47.64 | 17.88 | 0.05 | 17.19 | 0.04 | 16.84 | 0.06 | ||||
| 162 | 4:56:47.74 | 16.83 | 0.06 | 16.18 | 0.06 | 15.60 | 0.09 | ||||
| 163 | 4:56:47.77 | 17.20 | 0.05 | 16.55 | 0.14 | 16.33 | 0.07 | ||||
| 164 | 4:56:47.78 | 18.58 | 0.06 | ||||||||
| 165 | 4:56:47.88 | 16.84 | 0.12 | 16.72 | 0.12 | 16.35 | 0.14 | 3138 | |||
| 166 | 4:56:47.89 | 18.14 | 0.07 | 3139 | |||||||
| 167 | 4:56:48.05 | 17.47 | 0.07 | 17.33 | 0.04 | 17.28 | 0.08 | 3142 | |||
| 168 | 4:56:48.10 | 14.57 | 0.01 | 13.88 | 0.02 | 13.64 | 0.02 | 3143 | |||
| 169 | 4:56:48.39 | 18.55 | 0.09 | 18.15 | 0.08 | 17.50 | 0.07 | ||||
| 170 | 4:56:48.47 | 17.80 | 0.06 | 17.75 | 0.09 | 17.65 | 0.11 | 3145 | |||
| 171 | 4:56:48.47 | 16.52 | 0.03 | 16.62 | 0.03 | 16.72 | 0.05 | 3146 | |||
| 172 | 4:56:48.63 | 16.97 | 0.04 | 16.96 | 0.04 | 16.99 | 0.07 | 3147 | |||
| 173 | 4:56:48.76 | 15.37 | 0.03 | 15.39 | 0.02 | 15.39 | 0.03 | 3148 | |||
| 174 | 4:56:48.78 | 18.36 | 0.09 | 17.71 | 0.09 | 17.36 | 0.12 | ||||
| 175 | 4:56:48.78 | 18.62 | 0.12 | 17.91 | 0.08 | ||||||
| 176 | 4:56:48.87 | 18.80 | 0.11 | 18.29 | 0.09 | 17.38 | 0.07 | ||||
| 177 | 4:56:48.97 | 17.08 | 0.04 | 17.12 | 0.04 | 17.02 | 0.07 | 3150 | |||
| 178 | 4:56:49.01 | 17.92 | 0.09 | 17.79 | 0.09 | 17.80 | 0.15 | 3151 | |||
| 179 | 4:56:49.07 | 17.61 | 0.05 | 17.74 | 0.06 | 17.61 | 0.10 | 3152 | |||
| 180 | 4:56:49.93 | 18.24 | 0.11 | ||||||||
| 181 | 4:56:50.05 | 17.75 | 0.05 | 17.17 | 0.04 | 17.19 | 0.09 | ||||
| 182 | 4:56:50.59 | 12.24 | 0.02 | 12.20 | 0.02 | 12.17 | 0.04 | 3157 | |||
| 183 | 4:56:50.84 | 17.43 | 0.06 | 16.86 | 0.05 | 16.50 | 0.07 | ||||
| 184 | 4:56:51.03 | 16.29 | 0.04 | 16.28 | 0.04 | 16.32 | 0.05 | 3159 |
| 2MASS | BRRG | |||
|---|---|---|---|---|
| 0456410-662440 | 39 | 0.10 | 0.22 | 0.13 |
| 0456452-662510 | 119 | 0.11 | 0.12 | 0.14 |
| 0456468-662446 | 140 | 0.10 | 0.15 | 0.14 |
| 0456506-662435 | 182 | 0.10 | 0.10 | 0.18 |
| Mean () | 0.10(0.01) | 0.15 (0.05) | 0.15(0.02) |
| Offset | ||
|---|---|---|
| GSC–BRRG | ||
| PGMW–BRRG | ||
| 2MASS–BRRG | ||
| HST–BRRG |
| BRRG # | ||||||||
|---|---|---|---|---|---|---|---|---|
| 7 | 4:56:35.94 | 18.54 | 0.10 | 0.14 | 0.13 | |||
| 9 | 4:56:36.14 | 17.00 | 0.05 | 0.07 | 0.07 | |||
| 13 | 4:56:37.17 | 16.42 | 0.07 | 0.08 | 0.06 | |||
| 26 | 4:56:39.02 | 16.53 | 0.08 | 0.13 | 0.13 | |||
| 50 | 4:56:42.40 | 17.80 | 0.06 | 0.08 | 0.10 | |||
| 65 | 4:56:42.96 | 17.71 | 0.06 | 0.11 | 0.12 | |||
| 89 | 4:56:43.91 | 18.50 | 0.06 | 0.08 | 0.08 | |||
| 108 | 4:56:44.76 | 18.48 | 0.10 | 0.12 | 0.12 | |||
| 113 | 4:56:44.93 | 0.12 | ||||||
| 129 | 4:56:45.96 | 0.14 | ||||||
| 147 | 4:56:47.13 | 17.56 | 0.11 | 0.14 | 0.12 | |||
| 148 | 4:56:47.17 | 0.14 | ||||||
| 152 | 4:56:47.33 | 17.33 | 0.15 | 0.19 | 0.20 | |||
| 157 | 4:56:47.54 | 17.05 | 0.05 | 0.07 | 0.07 | |||
| 162 | 4:56:47.74 | 16.83 | 0.06 | 0.08 | 0.11 | |||
| 165 | 4:56:47.88 | 16.84 | 0.12 | 0.17 | 0.18 | |||
| 169 | 4:56:48.39 | 18.55 | 0.09 | 0.12 | 0.11 | |||
| 176 | 4:56:48.87 | 18.80 | 0.11 | 0.14 | 0.12 |