Observations of giant outbursts from Cygnus X-1
Abstract
We present interplanetary network localization, spectral, and time history information for 7 episodes of exceptionally intense gamma-ray emission from Cygnus X-1. The outbursts occurred between 1995 and 2003, with durations up to 28000 seconds. The observed 15 - 300 keV peak fluxes and fluences reached respectively. By combining the triangulations of these outbursts we derive an 1700 square arcminute (3 ) error ellipse which contains Cygnus X-1 and no other known high energy sources. The outbursts reported here occurred both when Cyg X-1 was in the hard state as well as in the soft one, and at various orbital phases. The spectral data indicate that these outbursts display the same parameters as those of the underlying hard and soft states, suggesting that they represent another manifestation of these states.
1 Introduction
The X-ray source Cygnus X-1 was discovered by Bowyer et al (1965), and its optical counterpart, a spectroscopic binary at a distance of 2 kpc with a 5.6 day period (HDE226868), was identified by Webster and Murdin (1972) and Bolton (1972). The primary is a supergiant, and the mass of the secondary is at least (Gies & Bolton 1986), making it a black hole candidate and a high mass X-ray binary. The X-ray source, which has been observed from keV to MeV energies, is thought to be powered by accretion (e.g. Petterson 1978). Soft X-radiation may be produced in an accretion disk close to the black hole, and hard X-rays by inverse Compton scattering in a separate hot plasma; see Liang and Nolan (1984) for a review. Recently, a relativistic jet has been detected in the radio (Stirling et al. 2001), and Romero et al. (2002) have suggested that Cygnus X-1 is a microblazar, that is, that we are observing it close to the axis of the jet.
Cygnus X-1 is known to exhibit two states of X-ray emission, which are thought to depend on the accretion rate (Esin et al. 1998). The first, more common one, is the hard state, in which the 20 - 200 keV flux is roughly one Crab, and the 10 keV emission is about 0.5 Crab. The second is the soft state, in which the low energy X-ray flux increases by a factor of 2 - 4, while the high energy flux decreases by a factor of about 2. Transitions between the two states and flaring have been documented extensively (Ling et al. 1997; Zhang et al. 1997; Cui et al. 2002; McConnell et al. 2002), and both states exhibit variability of a factor of two or so on all timescales.
In this paper we report on seven episodes of long, intense gamma-ray emission from this source; we refer to them as outbursts (and identify them by their dates), to distinguish them from the shorter, less intense flaring which has been documented previously. One of these outbursts, 950325, was found by Mazets et al. (1995) and initially thought to be a gamma-ray burst; subsequently, however, its source was found to be Cygnus X-1 by M. Briggs (private communication, 1995). Later, Stern et al. (2001) called attention to five outbursts on 1999 April 19-21. During the two brightest events, the hard X-ray flux increased by over an order of magnitude for 1000 s. Observations by Ulysses and Konus - Wind of still three more outbursts in 2002 - 2003 have prompted us to reanalyze all the available data in order to obtain better energy spectra and a more precise source location as well.
2 Observations
The outbursts reported here were discovered in the time history data of the gamma-ray burst (GRB) detectors aboard the Wind, Ulysses, and Compton Gamma-Ray Observatory (CGRO) spacecraft (Konus, GRB, and the Burst and Transient Source Experiment, or BATSE, experiments respectively). In general, the data used were for the non-triggered modes, with low temporal and spectral resolution (0.25 - 2.9 s and 3 channels, respectively). Although in some cases, the emission was intense enough to trigger BATSE, the data obtained in the triggered modes had too small a duration to cover the entire outburst, and the lower time resolution continuous data have been used for most of our analysis. Table 1 gives the dates, times, and durations of the seven events, as well as the spacecraft which observed them, and the spectral state and orbital phase of Cyg X-1. To determine the source of the outbursts, we have employed the usual method of interplanetary network (IPN) triangulation for a repeating source (e.g. Hurley et al. 1999). In all cases, the IPN consisted of only two widely separated spacecraft (Ulysses and either CGRO or Wind ), so a single annulus of location was obtained for each flare. The seven annuli were combined statistically to produce the 1, 2, and 3 error ellipses shown in figure 1. The only known hard X-ray source in this region is Cyg X-1, which lies at the 95 % confidence level.
Although Ulysses observed all seven of the outbursts in Table 1, it was in a mode in which no energy spectra were accumulated. Konus Wind observed 6 of the 7 outbursts (one outburst, 990421B, occurred during a period when the data were contaminated by solar particles), and we have used the data from it exclusively for time-resolved spectral analysis. The time and energy resolutions vary depending on the mode of operation. For five outbursts we have data in three energy channels (nominally 10-50, 50-200, and 200-750 keV, or G1, G2, and G3, respectively) which span the entire event. In the sixth case (950325) a cosmic gamma-ray burst fortuitously triggered Konus during the outburst, allowing it to record multi-channel energy spectra for a total of 360 s, starting 120 s after the GRB trigger, when the 15 s long GRB had ceased emitting. In addition, for this event, there are also 3 channel data. Because the most detailed data are available for it, we discuss this outburst first.
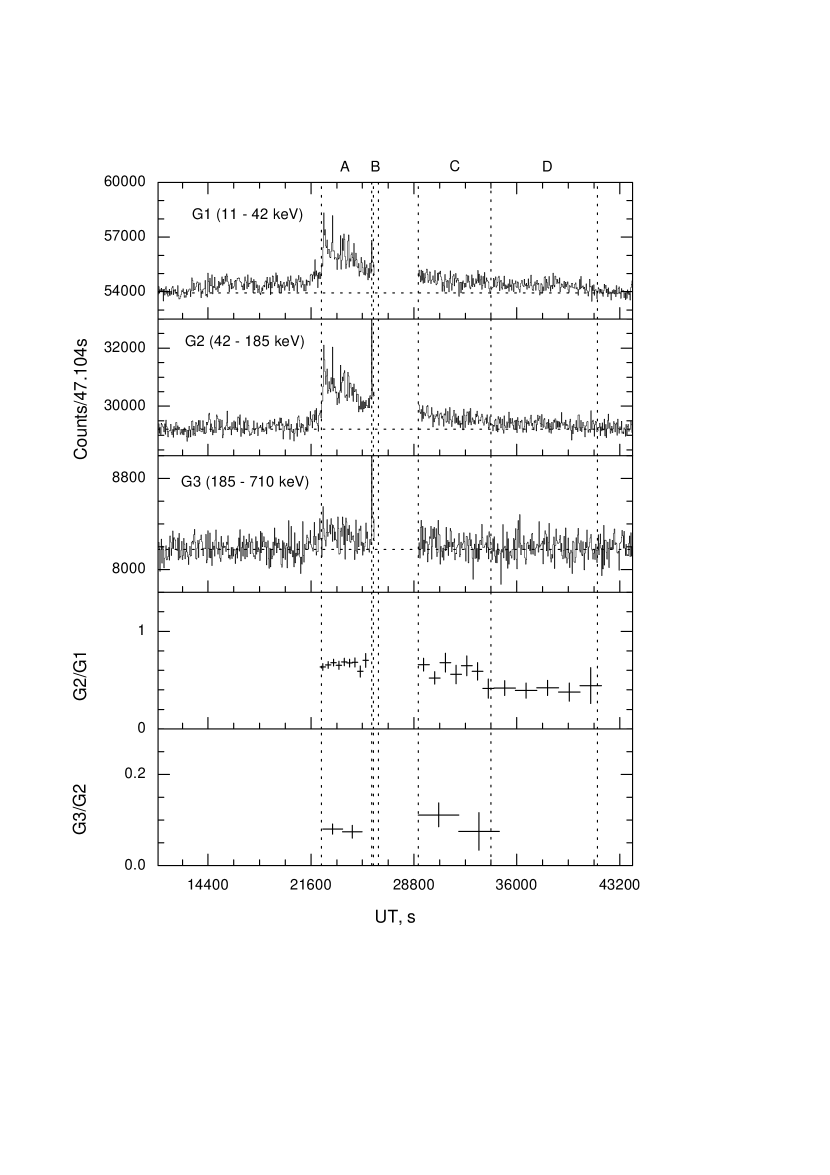
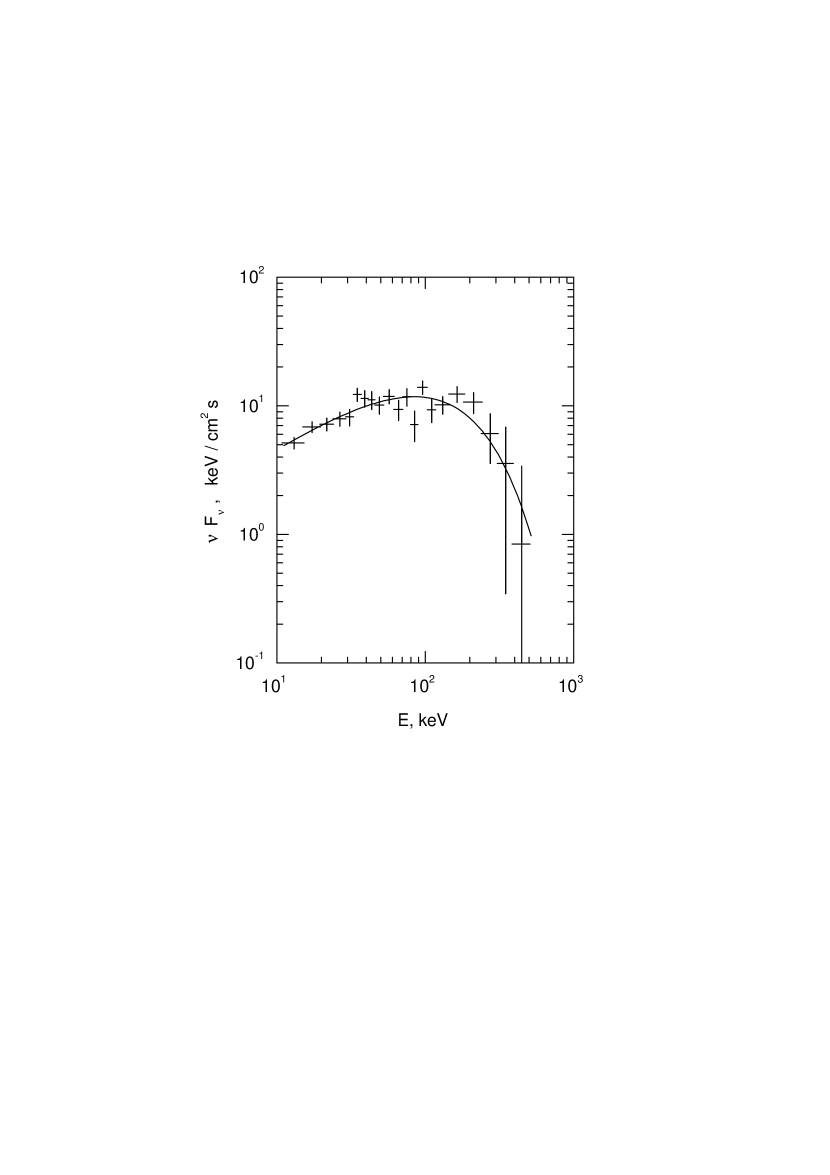
The 950325 outburst is presented in detail in figure 2. In the top three panels, the time histories in the G1, G2, and G3 windows are shown, and in the bottom panels, the hardness ratios G2/G1 and G3/G2. The letters A-D indicate the intervals where energy spectra have been analyzed. (The results of this and other analyses are summarized in table 2.) In particular, B marks the 360 s interval where multi-channel spectra were accumulated. The gap following B is the interval where the data were transferred to the onboard tape recorder. The hardness ratios display a weak but obvious spectral variability. From them, it is reasonable to assume that the multi-channel energy spectra measured in interval B, during the fading stage of the flare, also characterize the spectrum of the preceding, intense phase. The multi-channel spectrum is presented in figure 3 in units. (The spectral deconvolution procedure has been described by Terekhov et al. 1998). The solid line gives the best fit spectrum, , with for 18 degrees of freedom. This spectral shape is consistent with that of the Cyg X-1 hard state.
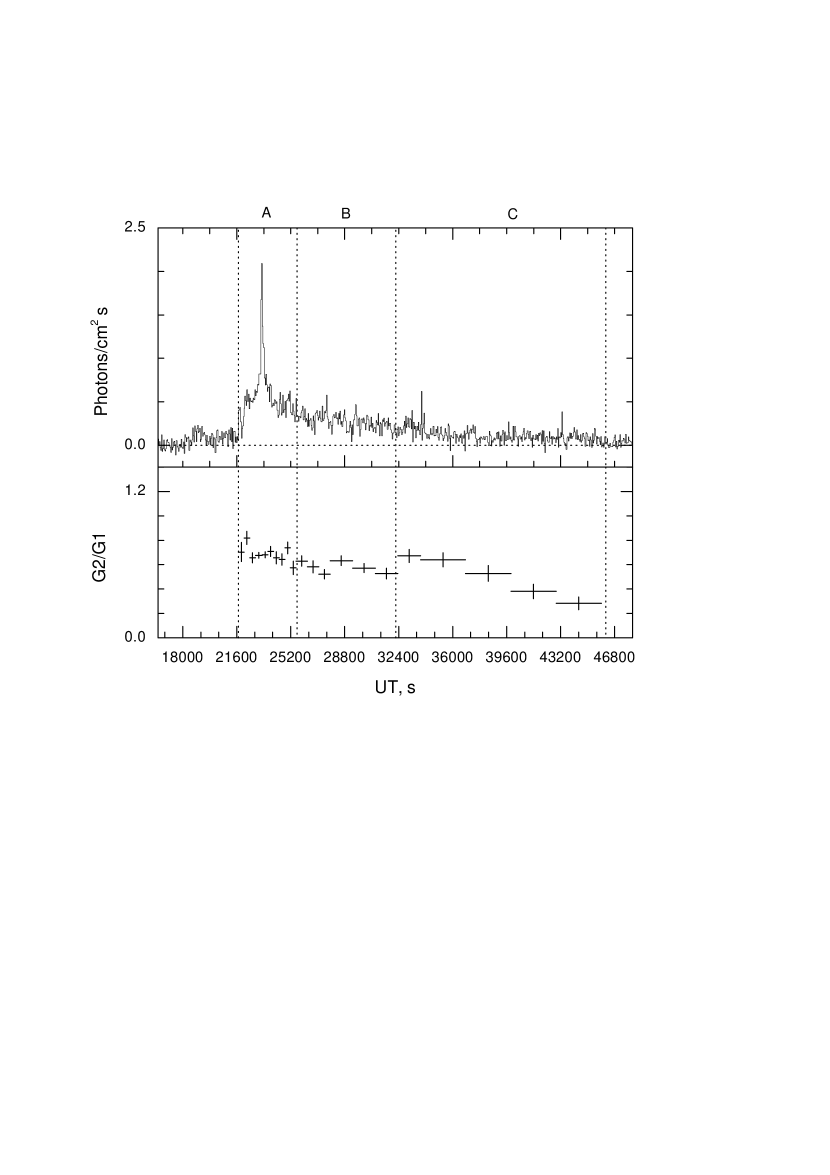
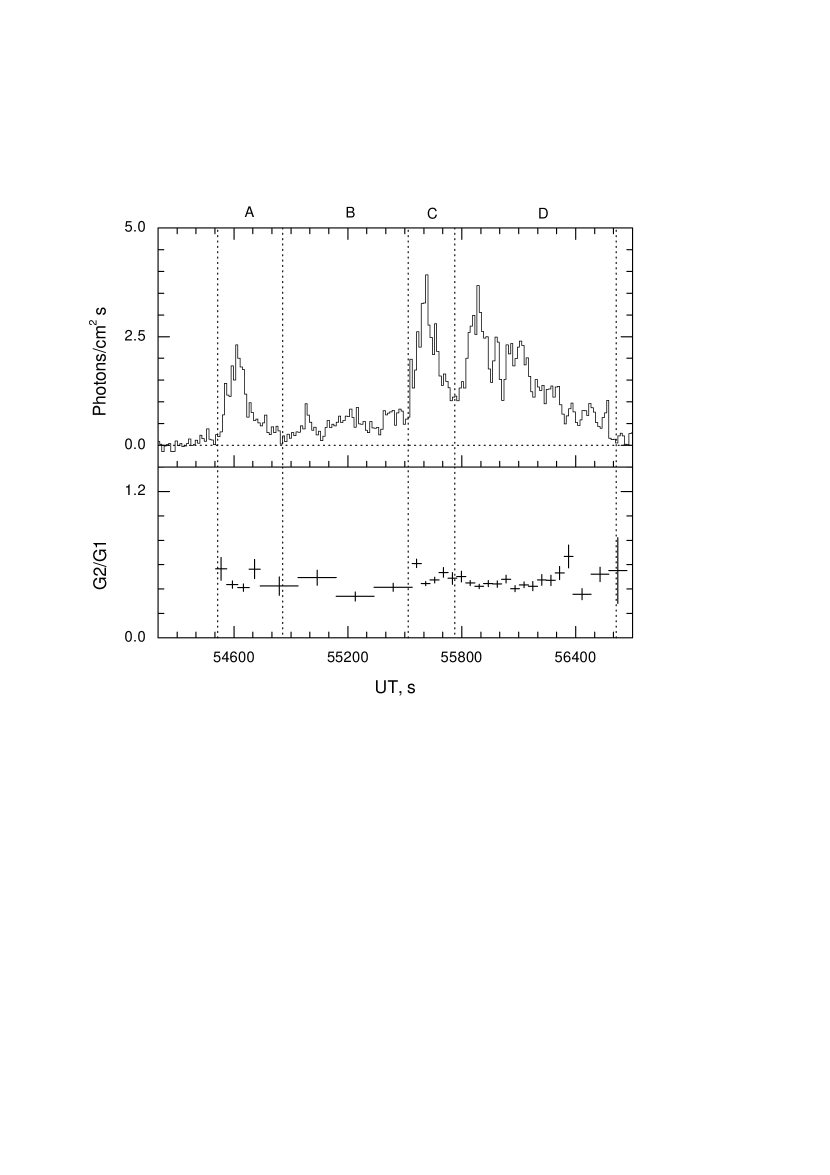
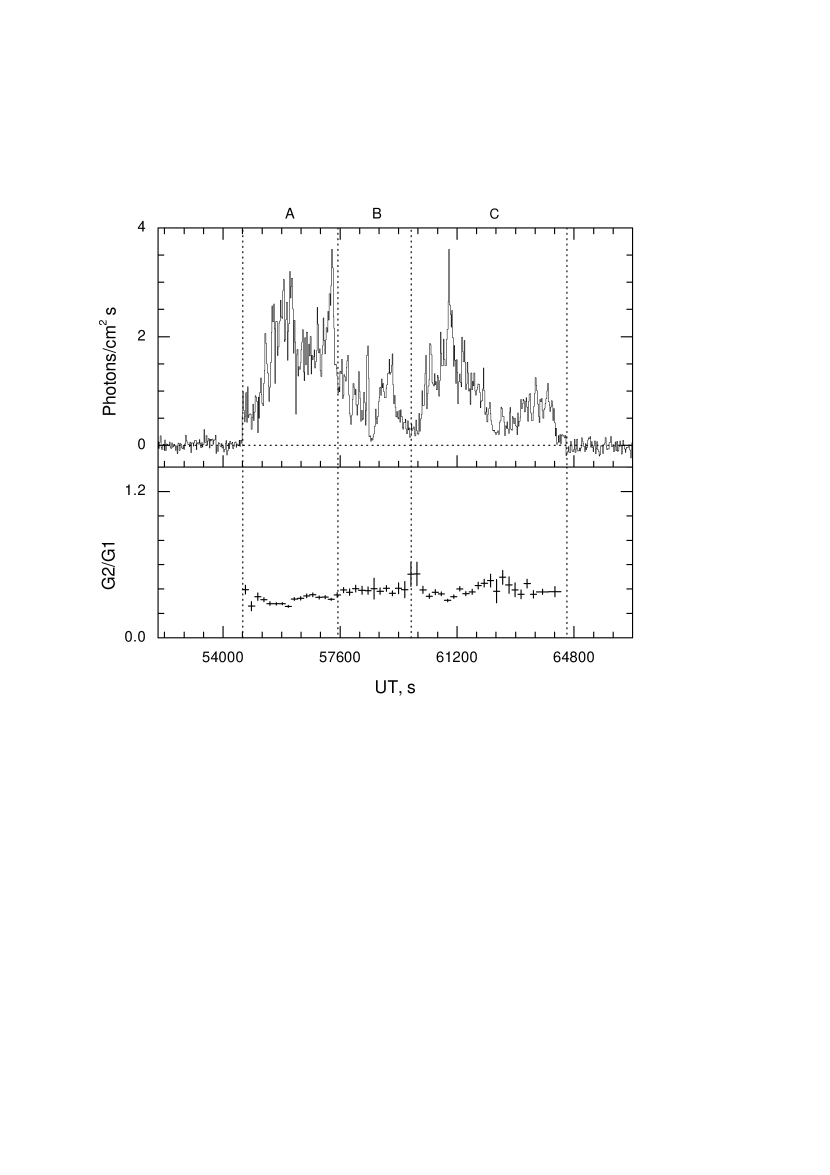
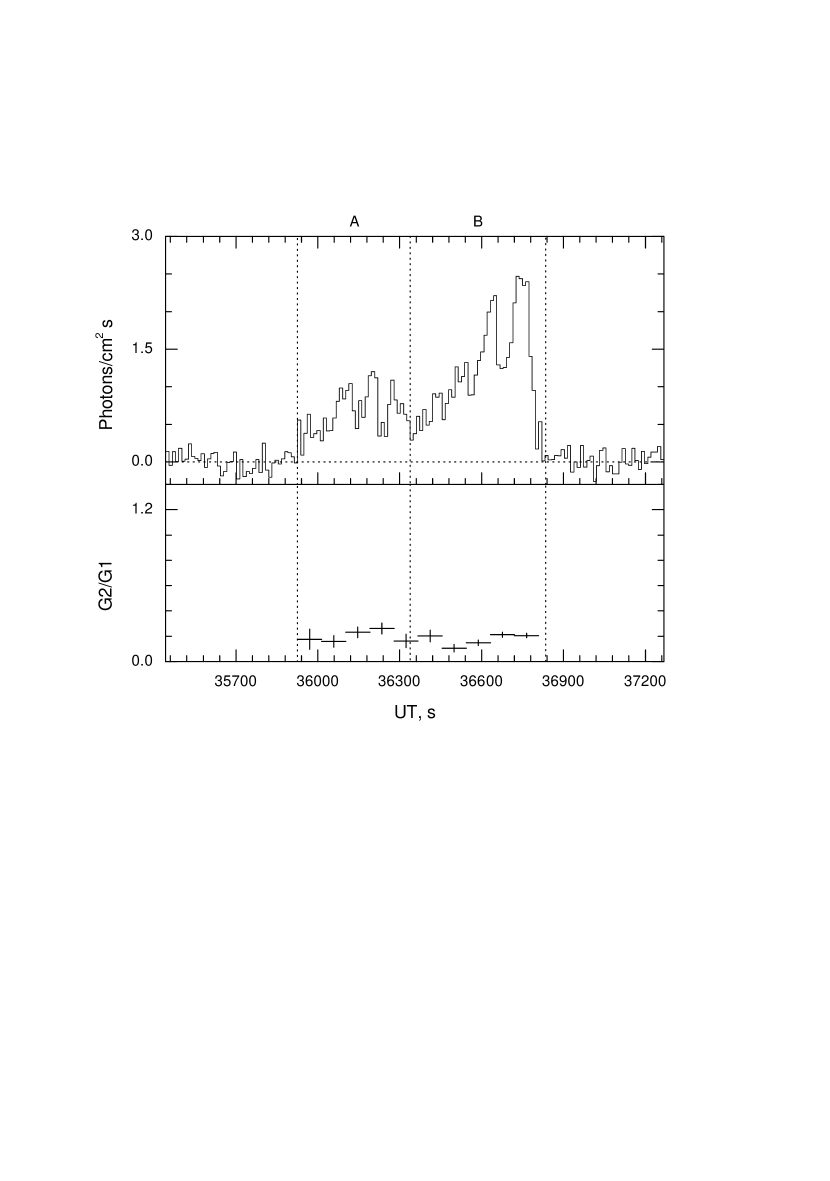
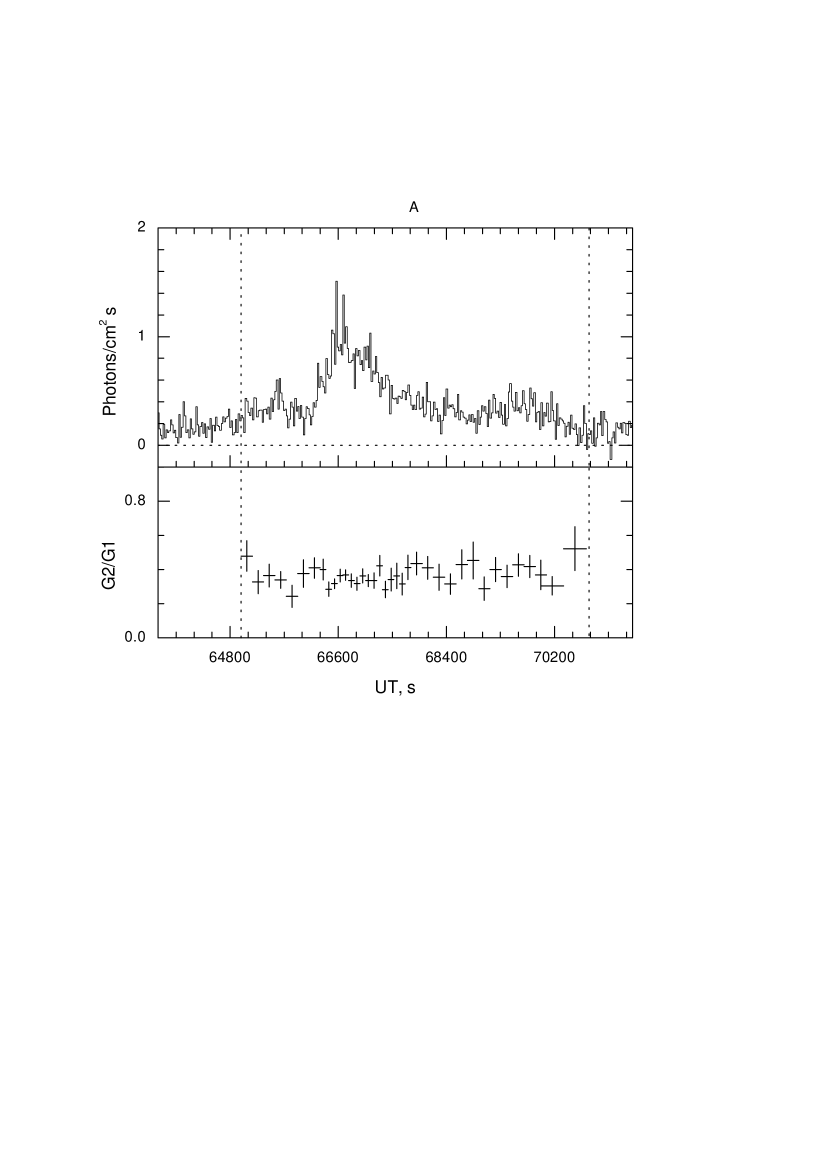
The 15 - 300 keV time histories of the other outbursts are presented in figures 4 - 9. The vertical dotted lines and letters at the top of the Konus plots indicate the intervals over which 3 channel energy spectra were accumulated to improve statistics. Fits were done with the function , and the fitting parameters are given in table 2. Ep, the peak energy, was obtained from the spectrum expressed in units. The fluences and peak fluxes, given in table 3, were calculated assuming no spectral evolution over the intervals considered.
It should be noted that an omnidirectional sensor detects an outburst from a source as a temporary increase in the count rate over an average background level. Clearly in this case that level includes any persistent flux from Cyg X-1. Thus the total flux during an outburst will be the sum of the persistent and flaring fluxes detected by Konus. However, the value of the persistent flux from Cyg X-1 at time intervals adjacent to the outburst is poorly known. Accordingly the fluences and peak fluxes in table 3 are only to be considered estimates of the outburst component.
3 Discussion
Long-term observations of Cyg X-1 in X-rays and soft gamma-rays from HEAO 3 (Ling et al. 1987), BATSE (Ling et al. 1997), Mir-Kvant (Borkus et al. 1995), and BeppoSAX (Frontera et al. 2001) have shown that the source spends most of the time in the hard state. According to BATSE data for 1991 - 1999 (McConnell et al. 2002), the hard flux in the 20 - 100 keV energy range varied between 0.2 and 0.36 photons cm-2 s-1, roughly the average value corresponding to the level in the 45 - 140 keV band identified by Ling et al. (1987). In 1999 April, several outbursts lasting up to 1000 s were found in the BATSE data (Stern et al. 2001). The peak fluxes in the 50 - 300 keV range, 0.3 - 1.1 photons cm-2 s-1, were significantly higher than the average value of . Transitions to the soft state lasting for several months were observed only a few times. According to the data of the All Sky Monitor aboard the Rossi X-ray Timing Explorer (RXTE/ASM, McConnell et al. 2002), the soft X-ray (2 - 10 keV) count rates increase from after transitions to the soft state. From the BATSE and RXTE light curves we have ascertained that outbursts 950110, 950325, 990421A and B, and 030212 occured while Cyg X-1 was in the hard state whereas outbursts 020224 and 020331 arose from the soft state.
Broadband spectral observations of Cyg X-1 from numerous spacecraft and combinations of spacecraft have been used to study comprehensively the spectral shapes at various times in order to deduce the emission mechanism and the geometry of the regions emitting and reprocessing radiation (Mir-Kvant: Borkus et al. 1995; CGRO: Ling et al. 1997; Ginga and CGRO: Gierlinski et al. 1997; RXTE: Dove et al. 1998; ASCA, RXTE, and CGRO: Gierlinski et al. 1999; BeppoSAX: Frontera et al. 2001; and CGRO and BeppoSAX: McConnell et al. 2002). The accuracy of our data is insufficient for such a thorough analysis of source models. Rather, we have focused on obtaining the essential information on a new feature of Cyg X-1 activity from limited observational data using the simplest model spectra, namely a power law, , or a power law with an exponential cutoff, . Apart from the lack of high resolution spectral data, the most serious difficulties in our data processing are connected with slow changes in the background level, especially in the low energy ranges. Background count rates in the G1 window and, to a lesser extent, in G2, are strongly affected by the activity of cosmic X-ray sources and vary, even when the Sun is quiet, by , averaged over hours and days. For this reason, for example, we do not attempt spectral fits for the long, weak onsets of outbursts 950110 and 950325.
The intense stage of each outburst was subdivided into several time intervals in some concordance with the temporal behaviour of the hardness ratio, as shown in figures 2 and 4-9. Spectral parameters for all of these intervals were determined using the following procedure. The counts accumulated in energy band Gi (i=1, 2, 3) can be represented as an integral over an energy loss spectrum
using a model photon spectral function and the detector response matrix . The resulting system of three equations with unknowns A, , and E0 was solved by the Marquardt-Levenberg method and the uncertainties in the parameters were calculated from the covariance matrix. In the case of the exponentially attenuated power law, parameters and E0 are strongly correlated. The peak energy Ep for a spectrum is a more robust characteristic. Estimates of the errors in the spectral parameters were checked by numerical simulations, i.e. by introducing Poisonnian-distributed deviations to the count rates G1, G2, and G3, applying the procedure described above, and analyzing the distributions of the spectral parameters. The results of the simulations are in very good agreement with estimates from the covariance matrix.
All of these data are collected in table 2, which includes an additional interval B* for 950325. This interval, where G1, G2, and G3 data were available, partially overlaps interval B. From this it is evident that the parameters obtained by both methods agree well to within their uncertainties. The 15 - 300 keV fluences and peak fluxes for all the outbursts are presented in table 3.
The main conclusions which can be drawn from these data are the following.
-
•
An exponential cutoff is essential when fitting outbursts arising from the hard state. The parameters and E0 for these outbursts are consistent with the values for the hard state of Cyg X-1 reported in literature.
-
•
The spectra of the 2002 soft state outbursts are softer in our energy range. The photon spectra of 020331 are well fit by a single slope power law with , which is certainly softer than any spectrum observed in the hard state. The spectra of 020224 have an intermediate shape and display a low E0 with large uncertainties in .
-
•
The hardness ratio G2/G1 varies slightly during outbursts, but it does not display any clear correlation with the luminosity. The only exception is observed in the outburst of 990421B, where the hardness decreases substantially at the peak (see Stern, Beloborodov, & Poutanen 2001)
-
•
In general, it seems that giant outbursts maintain the spectral parameters, and hence emission mechanism, of the current underlying spectral state of Cyg X-1, even though the 15 - 300 keV peak fluxes are up to ten times higher than the persistent emission fluxes. The corresponding fraction of the peak luminosity in these outbursts approaches one tenth of the Eddington luminosity for an object with .
The soft and hard states of Cygnus X-1 and other galactic black hole candidates have comparable bolometric luminosities, but different energy spectra (e.g. Ling et al. 1997; Zdziarski et al. 2002). The hard X-ray spectra of these sources are typically characterized by power law with exponential cutoff with photon index and cutoff energy keV (Phlips et al. 1996, Gierlinski et al. 1997, Dove et al. 1998), which are consistent with those in table 2 for the first four outbursts and the seventh one. Many authors have interpreted them as thermal Comptonization with optical depth and electron temperature keV (for recent studies see Maccarone & Coppi, 2002).
The model for transitions between the soft and hard states discussed in a number of recent works is based on the idea of accretion disk transformations. In the soft state the accretion proceeds via a standard optically thick accretion disk (Shakura & Sunyaev, 1973) emitting a blackbody soft X-ray peak and a nonthermal tail resulting from coronal activity in the disk. In the hard state the inner part of the disk is thought to form a hot geometrically thick corona (see e.g. Barrio, Done & Nayakshin, 2002, Poutanen, Krolik & Ryde, 1997, and references therein) with a moderate () optical depth. The outer region of the disk, beyond a few tens to one hundred gravitational radii, still remains optically thick, emitting a cooler (0.1 - 0.2 keV) and weaker blackbody component. The physical grounds for such a transformation could be a transition of the inner part of the disk into a regime balancing between ADAF and standard disk modes (Esin et al. 1998). However such a regime requires a fine tuning which would clearly be violated during giant outbursts (Stern, Beloborodov & Poutanen, 2001).
An alternative to disk accretion for the case of the hard state could be accretion of the companion wind with a near-critical angular momentum (Illarionov & Sunyaev, 1975). Then, instead of a standard optically thick disk, a small-scale disk with can appear. This scenario can naturally describe the hard state spectrum (Beloborodov & Illarionov, 2001) in terms of thermal Comptonization in the small disk within a few gravitational radii. No difficulties with the large observed variabilities arise in this model.
The absence of a clear correlation between luminosity and hardness is noteworthy. Actually, the presence of a luminosity-hardness correlation or anti-correlation depends on many details, including the geometry of the emission region, the soft radiation, and pair production. If the Comptonizing plasma is pair-dominated, then the temperature is a weak function of the luminosity: pair production provides a thermostatic effect (see, e.g. Malzac, Beloborodov, & Poutanen, 2001). The spectrum in this case is softer at higher luminosities (if the geometry is fixed), but the dependence is weak (Stern et al. 1995). A luminosity-hardness anti-correlation is expected, but we do not observe it because of statistics.
What triggers the giant outbursts? The normal time variability of Cygnus X-1 has a broad power density spectrum which probably arises from instabilities in the disk. The outbursts do not appear to display the same variability pattern; moreover, they show similar temporal behaviors in the hard and soft states, which correspond to different states of the disk. Therefore, they are unlikely to originate due to an intrinsic disk effect. The most straightforward suggestion, and the one which we adopt as a working hypothesis, is that this could be some rare eruptive phenomenon in the donor wind ejection. The typical dynamical timescale for standard disk accretion in the case of Cyg X-1 is much longer than the duration of the outbursts, so that any fluctuations in the donor ejection rate would be dilated by up to a day or more (Bisnovaty-Kogan, private communication, 2002). Direct wind accretion, on the other hand, has a dynamical timescale s, but a shorter timescale can arise from instabilities in the accreting flow (Illarionov, private communication, 2002).
Other interpretations are possible. For example, the outbursts could be attributed to the recently discovered jet of Cyg X-1 (Stirling et al. 2001) and their recurrence could be explained by its precession (Romero et al. 2002).
4 Conclusion
The outbursts reported here have durations comparable to the period of a low Earth-orbiting spacecraft, making them difficult to detect and follow from experiments aboard such spacecraft, but relatively easy for experiments which are far from Earth and do not undergo occultation and orbital background variations. Indeed, our observations of 990421A show that it continues well beyond the point at which it was Earth-occulted to BATSE, and our observations of 990421B indicate that it commenced several hundred seconds before it rose on BATSE (Stern et al. 2001). These observations point to a new use for the IPN, namely tracking long, intense flares from Galactic transients. The data from a single experiment which has little or no directional and/or spectral information are easily confused with solar X-ray and particle events, which explains why it has taken so long to determine the origin of some of the outbursts presented here. However, confirmation by a second spacecraft solves this problem and gives an annulus of position which in many cases may be sufficient to determine the origin of the emission. For several outbursts, the BATSE observations alone yield source directions which are only accurate to 17 , leaving the possibility that the source could have been Cygnus X-3. However, relatively small error ellipses may be obtained from multiple observations, and our localizations rule this possibility out conclusively.
The histories of Cygnus X-1 and GRBs have been curiously intertwined over the decades. In the early days of X-ray astronomy, the use of interplanetary spacecraft was suggested to localize sources with rapid time variations such as Cyg X-1 (Giacconi 1972). Although, to our knowledge, such measurements were never carried out on persistent X-ray sources, today the technique is the basis of the IPN, and the present observations demonstrate the feasibility of this suggestion. Later, Mason et al. (1997) pointed out that bursts from Cyg X-1 could appear in the BATSE database; BATSE has indeed triggered many times on this source. Some of the long outbursts presented here have time histories which, if compressed in time, would be virtually impossible to distinguish from those of GRBs, and their spectra are hard. These similarities suggest that accretion onto a black hole, which is believed to power both Cyg X-1 and GRBs albeit under very different circumstances, may manifest itself in similar ways in very different settings.
5 Acknowledgments
Support for the Ulysses GRB experiment is provided by JPL Contract 958056, and for Konus-Wind by a Russian Aviation and Space Agency contract and RFBR grant N 03-02-17517. We are grateful to Al Levine and the ASM/RXTE team for quick-look results on Cygnus X-1, and to Andrei Illarionov for useful discussions. This research has made use of the SIMBAD database, operated at CDS, Strasbourg, France.
References
- (1)
- (2) Barrio F.E., Done, C., & Nayakshin, S., 2002, astro-ph/0209102
- (3)
- (4) Beloborodov, A.M., & Illarionov, A.F., 2001 MNRAS 323, 167
- (5)
- (6) Bolton, C. T., 1972, Nature 235, 271
- (7)
- (8) Borkus, V. et al., 1995, Astron. Lett. 21, 794
- (9)
- (10) Bowyer, S., Byram, E. T., Chubb, T., A., & Friedman, M., 1965, Science 147, 394
- (11)
- (12) Brocksopp, C., Tarasov, A.E., Lyuty, V. M., and Roche, P., 1999, A&A 343, 861
- (13)
- (14) Cui, W., Feng, Y-X., and Ertmer, M., 2002, ApJ 564, L77
- (15)
- (16) Dove, J., Wilms, J., Nowak, M., Vaughan, B., and Begelman, M., 1998, MNRAS 298, 729
- (17)
- (18) Esin, A., Narayan, R., Cui, W., Grove, J. E., and Zhang, S-N., 1998, ApJ 505, 854
- (19)
- (20) Frontera, F., et al., 2001, ApJ 546, 1027
- (21)
- (22) Giacconi, R., 1972, ApJ 173, 79
- (23)
- (24) Gierlinski, M., et al., 1997, MNRAS 288, 958
- (25)
- (26) Gierlinski, M., Zdziarski, A., Pountanen, J., Coppi, S., Ebisawa, K., and Johnson, W., 1999, MNRAS 309, 958
- (27)
- (28) Gies, D., & Bolton, C., 1986, ApJ 304, 371
- (29)
- (30) Golenetskii, S., Aptekar, R., Mazets, E., Frederiks, Cline, T., and Hurley, K., 2002a, IAU Circ. 7940
- (31)
- (32) Golenetskii, S., Aptekar, R., Mazets, E., Frederiks, Cline, T., and Hurley, K., 2002b, GCN Circ. 1258 (http://gcn.gsfc.nasa.gov/gcn3/1258.gcn3)
- (33)
- (34) Hurley, K., Kouveliotou, C., Cline, T., Mazets, E., Golenetskii, S., Frederiks, D., and van Paradijs, J., 1999, ApJ 523, L37
- (35)
- (36) Illarionov, A.F., & Sunyaev, R.A. 1975, A&A 39, 185
- (37)
- (38) Liang, E., and Nolan, P., 1984, Space Science Rev. 38, 353
- (39)
- (40) Ling, J., Mahoney, W., Wheaton, W., and Jacobson, A., 1987, ApJ 321, L117
- (41)
- (42) Ling, J. et al., 1997, ApJ 484, 375
- (43)
- (44) Maccarone, T., and Coppi, P., 2002, astro-ph/0204235
- (45)
- (46) Malzac, J., Beloborodov, A.M., & Poutanen, J., 2001, MNRAS 326, 417
- (47)
- (48) Mazets, E., 1995, in AIP Conf. Proc. 384, Gamma-Ray Bursts - 3rd Huntsville Symposium, Eds. C. Kouveliotou, M. Briggs, & G. J. Fishman (New York: AIP), 492
- (49)
- (50) Mason, P., McNamara, B., and Harrison, T., 1997, AJ 114(1), 238
- (51)
- (52) McConnell, M., et al., 2002, ApJ 572, 984
- (53)
- (54) Petterson, J., 1978, ApJ 224, 625
- (55)
- (56) Phlips, B., et al., 1996, ApJ 465, 907
- (57)
- (58) Poutanen, J., Krolik, J., and Ryde, F., 1997, MNRAS 292, L21
- (59)
- (60) Romero, G., Kaufman Bernado, M., and Mirabel, I., 2002, A&A 393, L61
- (61)
- (62) Schmidt, M., 2002, IAU Circ. 7856
- (63)
- (64) Shakura, N. I. & Sunyaev, R. A., 1973, A&A 24, 337
- (65)
- (66) Stern, B., Poutanen, J., Svensson, R., Sikora, M., and Begelman, M., 1995, ApJ 449, L13
- (67)
- (68) Stern, B., Beloborodov, A., and Poutanen, J., 2001, ApJ 555, 829
- (69)
- (70) Stirling, A., Spencer, R., de la Force, C., Garrett, M., Fender, R. and Ogley, R., 2001, MNRAS 327, 1273
- (71)
- (72) Terekhov, M., Aptekar, R., Frederiks, D., Golenetskii, S., Il’inskii, V., and Mazets, E., 1998, in AIP Conf. Proc. 428, Gamma-Ray Bursts - 4th Huntsville Symposium, Eds. C. Meegan, R., Preece, & T. Koshut (New York: AIP), 894
- (73)
- (74) Webster, B. L., and Murdin, P., 1972, Nature 235, 37
- (75)
- (76) Zdziarski, A., Poutanen, J., Paciesas, W., and Wen, L., 2002, ApJ 578, 357
- (77)
- (78) Zhang, S., Cui, W., Harmon, A., Paciesas, W., Remillard, R., and van Paradijs, J., 1997, ApJ 477, L95
- (79)


| Date | Onset UT | Duration | Spacecraft | Underlying | Orbital phaseffThe phases were calculated using the orbital ephemeris from Brocksopp et al. (1999). Zero phase corresponds to the time of superior conjunction of the black hole. |
|---|---|---|---|---|---|
| (approx.) | (approx.) | spectral state | (at onset) | ||
| YYMMDD | s | s | |||
| 950110 | 18600 | 27500 | Ulysses aaGolenetskii et al. (2002a,b) , Konus a,ba,bfootnotemark: , BATSE ccSchmidt (2002) | hardggThe state according to BATSE data (McConnell et al. 2002). | 0.37 |
| 950325 | 14400 | 28000 | Ulysses aaGolenetskii et al. (2002a,b) , Konus a,ba,bfootnotemark: , BATSE ccSchmidt (2002) | hardggThe state according to BATSE data (McConnell et al. 2002). | 0.57 |
| 990421A | 54510 | 4870 | Ulysses , Konus, BATSE ddStern, Beloborodov, and Poutanen (2001) | hardhhThe state was derived using the online data of RXTE (http://xte.mit.edu/ASM_lc.html). | 0.38 |
| 990421BeeThis event may be a continuation of the preceding one. | 63100 | 1360 | Ulysses , BATSE ddStern, Beloborodov, and Poutanen (2001) | hardhhThe state was derived using the online data of RXTE (http://xte.mit.edu/ASM_lc.html). | 0.40 |
| 020224 | 54600 | 10000 | Ulysses aaGolenetskii et al. (2002a,b) , Konus bbMazets et al. (1995) | softhhThe state was derived using the online data of RXTE (http://xte.mit.edu/ASM_lc.html). | 0.10 |
| 020331 | 35925 | 910 | Ulysses , Konus | softhhThe state was derived using the online data of RXTE (http://xte.mit.edu/ASM_lc.html). | 0.31 |
| 030212 | 65000 | 5800 | Ulysses , Konus | hardhhThe state was derived using the online data of RXTE (http://xte.mit.edu/ASM_lc.html). | 0.16 |
| Date | Time interval | A, | E0, keV | Ep, keV | |
|---|---|---|---|---|---|
| (see figures 2, 4, 5, 7-9) | photons cm-2 s-1 keV-1 | ||||
| 950110 | A | 0.920.08 | 1.240.05 | 11110 | 853 |
| B | 0.930.12 | 1.450.07 | 13322 | 734 | |
| C | 1.070.15 | 1.810.08 | 452218 | 8417 | |
| A+B+C | 0.830.06 | 1.500.04 | 16216 | 823 | |
| 950325 | A | 0.970.09 | 1.260.05 | 11211 | 823 |
| BaaMultichannel spectrum | 0.880.23 | 1.240.15 | 11230 | 859 | |
| Bbb3 channel spectrum | 1.250.30 | 1.360.14 | 13741 | 8711 | |
| C | 0.610.12 | 1.480.11 | 15644 | 819 | |
| D | 0.940.47 | 1.800.26 | 163128 | 3319 | |
| A+C+D | 0.670.07 | 1.440.06 | 13317 | 754 | |
| 990421A | A | 1.350.92 | 1.200.39 | 8748 | 695 |
| B | 4.830.94 | 1.830.12 | 434281 | 7420 | |
| C | 9.880.74 | 1.630.05 | 30354 | 1138 | |
| D | 3.080.53 | 1.330.10 | 11119 | 753 | |
| A+B+C+D | 4.240.41 | 1.520.06 | 15620 | 722 | |
| 020224 | A | 2.281.29 | 1.100.34 | 6321 | 573 |
| B | 0.480.40 | 0.890.52 | 6432 | 712 | |
| C | 2.730.47 | 1.440.11 | 12123 | 682 | |
| A+B+C | 2.380.44 | 1.290.11 | 8813 | 621 | |
| 020331 | A | 575 | 2.500.08 | ||
| B | 1559 | 2.600.05 | |||
| A+B | 1075 | 2.550.04 | |||
| 030212 | A | 0.930.47 | 1.310.30 | 9037 | 612 |
| Date | Time interval | 15 - 300 keV fluence | 15 - 300 keV peak flux | Peak luminosity at 2 kpc | |
|---|---|---|---|---|---|
| s UT | |||||
| 950110 | 21712 - 46215 | 2.4 | |||
| 950325 | 22331 - 42635 | 1.3 | |||
| 990421A | 54514 - 56613 | 3.8 | |||
| 020224 | 54609 - 64583 | 3.7 | |||
| 020331 | 35926 - 36835 | 2.4 | |||
| 030212 | 64982 - 70775 | 1.6 | |||