2Hamburger Sternwarte, Universität Hamburg, Gojenbergsweg 112, 21029 Hamburg
Indi B: a new benchmark T dwarf ††thanks: Based on data from the SuperCOSMOS Sky Surveys and observations collected with the ESO NTT, La Silla, Chile.
We have identified a new early T dwarf only 3.6 pc from the Sun, as a common proper motion companion (separation 1459 AU) to the K5V star Indi (HD 209100). As such, Indi B is one of the highest proper motion sources outside the solar system ( 4.7 arcsec/yr), part of one of the twenty nearest stellar systems, and the nearest brown dwarf to the Sun. Optical photometry obtained from the SuperCOSMOS Sky Survey was combined with approximate infrared photometry from the 2MASS Quicklook survey data release, yielding colours for the source typical of early T dwarfs. Follow-up infrared spectroscopy using the ESO NTT and SOFI confirmed its spectral type to be T2.50.5. With =, Indi B is 1.7 magnitudes brighter than any previously known T dwarf and 4 magnitudes brighter than the typical object in its class, making it highly amenable to detailed study. Also, as a companion to a bright nearby star, it has a precisely known distance (3.626 pc) and relatively well-known age (0.8–2 Gyr), allowing us to estimate its luminosity as log L/ =, its effective temperature as 1260 K, and its mass as 40–60 . Indi B represents an important addition to the census of the Solar neighbourhood and, equally importantly, a new benchmark object in our understanding of substellar objects.
Key Words.:
astrometry and celestial mechanics: astrometry – astronomical data base: surveys – stars: late-type – stars: low mass, brown dwarfs1 Introduction
Our knowledge of the solar neighbourhood remains remarkably sketchy. Recent discoveries of very nearby (10 pc) early and mid M dwarfs (Scholz, Meusinger, & Jahreiß scholz01 (2001); Reid & Cruz reid02a (2002); Reid, Kilkenny, & Cruz reid02b (2002); Reylé et al. reyle02 (2002); Lépine, Rich, & Shara 2002a ) and late M dwarfs (Delfosse et al. delfosse01 (2001); McCaughrean, Scholz, & Lodieu mccaughrean02 (2002); Lépine et al. 2002b ) appear to vindicate predictions that up to 30% of all stars within 10 pc remain unknown (Henry et al. henry97 (1997)).
The deficiency is even larger at substellar masses. Observational evidence (Reid et al. reid99 (1999)) and theory (Chabrier chabrier02 (2002)) suggest a local space density of 0.1 per cubic parsec for brown dwarfs, i.e., twice that for main sequence stars. However, brown dwarfs are much cooler and fainter and thus harder to observe, and as a consequence, only one M9 brown dwarf (Tinney tinney96 (1996), tinney98 (1998)), a handful of L dwarfs, and 10 T dwarfs (see Burgasser et al. burgasser03 (2003) and references therein) are known at less than 10 pc from the Sun, compared to 300 stars within the same volume.
These sources are important however, as the detailed observation of very nearby stars and brown dwarfs is a key starting point for investigations of the star formation process, the stellar and substellar luminosity function, and the initial mass function. The recently discovered and categorised T dwarfs, with temperatures of 1500 K or less (Burgasser et al. burgasser02 (2002)) are particularly interesting, as they span a range of masses from just substellar down close to those of giant planets. Some 32 spectrally confirmed T dwarfs have been found to date, most of them in wide-field infrared (2MASS; Burgasser et al. burgasser02 (2002)) and optical (SDSS; Geballe et al. geballe02 (2002)) surveys. However, as substellar brown dwarfs continuously cool and decrease in luminosity throughout their lifetime, it is relatively difficult to determine their distances, ages, and masses. There are two important exceptions, Gl229 B and Gl570 D, both of which are companions to nearby stars for which distances and ages are relatively well known, and these key template objects help underpin studies of brown dwarf evolution, chemistry, and weather. It is crucial that we expand the sample of T dwarfs with well-understood physical properties, and the nearer they are to the Sun, the better, as they can be studied in more detail. In this paper, we describe the discovery of a T dwarf as as a companion to one of the nearest stars in the sky, Indi.
2 Proper motion data and optical photometry
There is ample evidence that surveys for high proper motion objects can successfully contribute to the completion of the census of the solar neighbourhood at the stellar/substellar boundary (Ruiz, Leggett, & Allard ruiz97 (1997); Scholz et al. scholz01 (2001); Reylé et al. reyle02 (2002); Reid & Cruz reid02a (2002); Reid et al. reid02b (2002); Cruz & Reid cruz02 (2002)). We have been using the SuperCOSMOS Sky Survey (hereafter SSS: Hambly et al. 2001a ; 2001b ; 2001c ), a recent scan of the entire southern sky made from UKST and ESO Schmidt plates in three passbands (, , and ), to identify new, high proper motion objects, including cool white dwarfs, M dwarfs, and L dwarfs (Scholz et al. scholz02a (2002); McCaughrean et al. mccaughrean02 (2002); Lodieu, Scholz, & McCaughrean lodieu02 (2002); Scholz & Meusinger scholz02c (2002)).
Scholz & Meusinger (scholz02c (2002)) showed that all known L dwarfs within 20 pc could be recovered in the SSS data, at least in the band. In addition, it was possible to determine proper motions for them, provided multi-epoch SSS measurements were available. We are now searching for further high proper motion brown dwarf candidates in the SSS data, applying the following selection procedure.
We considered the declination zone , where UKST , , and , and ESO Schmidt plate data are all available. Starting with the UKST data, we selected stars with which could not be identified with an object on the corresponding UKST and ESO plates within a search radius of 6 arcsec. These latter plates were normally taken about 10–15 years earlier than the corresponding UKST and plates. We then narrowed down the sample to just red objects with UKST and, using 11 arcmin SSS finding charts, we checked to see if the non-identification on the UKST and ESO plates was due to a measurement error, an extremely red colour, or a large proper motion. Objects measured only on the plate and with no clear counterparts in the other passbands were also checked using , , and data from overlapping plates. Finally, suspected extremely red (large or no measurement) sources with high proper motions derived from linear fits to the multi-epoch SSS data were examined in the near-infrared using the 2MASS database.
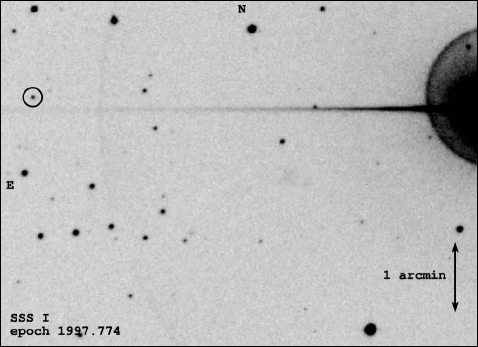
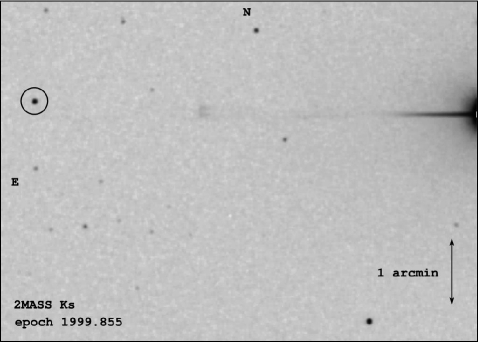
Thus, Indi B was initially found as a bright band source with a matched object on the UKST plate, but with no identification on the or ESO plates. Visual inspection of the finding charts revealed that the UKST measurement was in fact spurious, the diffraction spike of a nearby bright star. However, on an overlapping plate with an epoch difference of just two years, the source had clearly shifted. The huge computed proper motion of 4.7 arcsec/yr led us to check the 2MASS image data, which revealed a very bright infrared source at the expected position.
Finally, through a catalogue search, we ‘discovered’ Indi (HD 209100, GJ 845; spectral type K5V) about 7 arcmin away and with exactly the same large proper motion (see Figure 1). Thus, it is unequivocal that these two sources are related, i.e., that Indi B is a wide companion to Indi, and together they constitute one of the twenty nearest stellar systems in the sky. The primary star has a precise HIPPARCOS parallax yielding a distance of 3.6260.001 pc (ESA 1997), although for Indi B the uncertainty is somewhat larger due to the unknown separation between the primary and the companion along the line-of-sight: the separation in the plane of the sky is 402.3 arcsec or 1459 AU (epoch 2000.0), i.e., 0.007 pc.

3 Optical and near-infrared photometry
On the SSS plates, Indi B is seen to be very red, clearly visible in the band, but completely invisible at . Examination of the 2MASS survey data for this region confirmed Indi B to be bright in the near-infrared, but with the rather blue near-infrared colours indicative of a T dwarf, rather than an M or L dwarf.
The star Indi and its companion Indi B lie in a region of the 2MASS survey for which only the Quicklook survey data have been released to date, and therefore there are no catalogue magnitudes available. Thus we used standard aperture photometry techniques to measure the flux from Indi B at , , and . The Quicklook data are compressed with a lossy algorithm, potentially damaging any derived photometry. However, the 2MASS team (Carpenter carpenter02 (2002)) have shown that for bright sources such as Indi B, random photometric errors introduced by the compression are minimal. To check this, we measured , , and magnitudes from Quicklook images for a sample of 7 M dwarfs with roughly equivalent magnitudes and colours to Indi B, and which also have photometric measurements in the 2MASS catalogues from the uncompressed data. In this way, we confirmed that the Quicklook photometry is certainly good to better than , adequate for present purposes. Finally, we also measured a band magnitude from our SOFI spectroscopy acquisition images, yielding a result consistent with the 2MASS value to within . The optical and near-infrared photometry are shown in Table 1.
| (J2000.0) | Epoch | Magnitude | Data |
|---|---|---|---|
| 1997.771 | =16.59 | SSS | |
| 1999.666 | =16.77 | SSS | |
| 1999.855 | =12.11 | 2MASS | |
| 1999.855 | =11.59 | 2MASS | |
| 1999.855 | =11.17 | 2MASS |
4 Near-infrared classification spectroscopy
We obtained near-infrared (1–2.5 m) classification spectroscopy for Indi B using the SOFI camera/spectrometer on the ESO 3.5-m New Technology Telescope on La Silla on the night of 16–17 November 2002. The conditions were photometric and the seeing 1.0 arcsec FWHM. The instrument uses a 10241024 pixel Rockwell HAWAII array with a pixel size of 0.294 arcsec, and uses long slits for spectroscopy. A slit width of 1 arcsec was used with the two grisms covering the (blue) and (red) spectral regions respectively, at a spectral resolution of 600. Three dithered on-chip exposures of 120 seconds were obtained for each grism. Similar calibration data were obtained for a nearby bright spectral standard (CD-57 8484, spectral type G5).
The data reduction procedure was standard. Each individual spectral image was flat-fielded using a tungsten-illuminated spectral dome flat, sky-subtracted using the mean of the two other dithered images, and a one-dimensional spectrum optimally extracted. Wavelength calibration was achieved independently for each grism using a xenon arc lamp. Each spectrum was then divided by the spectral standard and multiplied back by a G5 template spectrum smoothed to the resolution of each grism. Finally, the three individual spectra for each grism were averaged and the two spectral regions combined to yield the spectrum seen in Figure 2. The total integration time is 360 seconds.
After reduction, the extracted spectrum was classified in two ways. First, we made a simple morphological comparison with template T dwarf spectra available from Burgasser et al. (burgasser02 (2002)), Leggett et al. (leggett00 (2000)), and Leggett (leggett02b (2002)). This method yielded a classification of T3. Second, we used the spectral classification indices for T dwarfs of Geballe et al. (geballe02 (2002)) and Burgasser et al. (burgasser02 (2002)), yielding mean types of T2.75 and T2.25, respectively (see Table 2). Consequently, we classify Indi B as spectral type T2.5, with half a subclass error.
| Index | Value | Type |
| Geballe et al. (geballe02 (2002)) | ||
| H2O 1.2 m | 1.919 | T2 |
| H2O 1.5 m | 2.600 | T2 |
| CH4 1.6 m | 1.367 | T3 |
| CH4 2.2 m | 1.837 | T2 |
| Burgasser et al. (burgasser02 (2002)) | ||
| H2O_A | 0.545 | T2–3 |
| H2O_B | 0.607 | T1–2 |
| CH4_A | 0.890 | T2–3 |
| CH4_B | 0.695 | T3 |
| CH4_C | 0.516 | T2–3 |
| HJ | 0.568 | T3 |
| KJ | 0.231 | T3 |
| 2.11/2.07 | 1.011 | T5 |
5 Physical properties
Given the distance to Indi B, we can determine its absolute near-infrared magnitudes as MJ=, MH=, and M=, with errors of less than . In the absence of reliable optical and thermal infrared data, we defer the direct calculation of the bolometric magnitude of Indi B to a later paper. Here, for a first order luminosity estimate, we must assume a bolometric correction, which is unfortunately not yet well-determined for early T dwarfs. Reid (reid02d (2002)) gives a BC= for the slightly earlier T2 dwarf SDSS 125401 (cf. Dahn et al. dahn02 (2002)), while an approximate interpolation between L8 and T6 in the data of Leggett et al. (leggett02 (2002); their Fig. 3) yields a BC=– for . Finally, the COND atmospheric models of Baraffe et al. (personal communication) would suggest a BC – for sources with Teff 1000–1300 K as appropriate for early T dwarfs. Thus here we assume a BC= for T2.5, which then yields Mbol= and log L/ = (20%) for Indi B, assuming Mbol= for the Sun.
Next, using the Mbol–radius relation derived by Dahn et al. (dahn02 (2002)) from theoretical models and renormalised by Reid (reid02d (2002))
we obtain a radius of 0.097 for Indi B ( 1 Jupiter radius, as is roughly true for all very late type stars, brown dwarfs, and gas giant planets supported by electron degeneracy pressure). Then, using and adopting =5771 K for the sun, we calculate an effective temperature of 1260 K ( 60 K) for Indi B, consistent with a spectral type of T2.5 (Burgasser et al. burgasser02 (2002)).
To estimate the mass of Indi B, we need an estimate of its age, as objects below the hydrogen fusion limit continuously cool and grow dimmer over their lifetimes. Fortunately, as it is a companion to a well-studied bright star, we can use age determinations for the latter as a proxy. Lachaume et al. (lachaume99 (1999)) examined several possible age dating techniques for nearby main sequence stars, and for Indi settled on a an age range of 0.8–2 Gyr, based on its rotational properties.
Using the model isochrones of Burrows et al. (burrows97 (1997)), we find that for a luminosity of log L/ =, an age range of 0.8–2 Gyr corresponds to a mass range of 40–60 , with the median age of 1.3 Gyr quoted by Lachaume et al. (lachaume99 (1999)) yielding a mass of 50 . As the mass estimate is essentially unaffected by the errors in our luminosity determination for Indi B, it appears to be a genuine brown dwarf, as expected. In addition, consistency in the suite of derived parameters is confirmed using the 1 Gyr models of Chabrier et al. (chabrier00 (2000)), where our luminosity estimate implies R=0.097 , =1270 K, and M 43 .
Finally, it is worth noting that Endl et al. (endl02 (2002)) have monitored Indi for radial velocity changes indicative of a planetary companion. They found no periodic signal in their data, but did draw attention to a long-term trend which they suggested might be due to a low-mass stellar or brown dwarf companion. Given the parameters we have determined for Indi B, it is clear that it is not the source of this long-term velocity change, but it remains possible that the Indi system is a hierarchical multiple, similar to the Gl570 ABCD system (Burgasser et al. burgasser00 (2000)). Planned HST direct imaging observations of Indi could have located close brown dwarf or giant planet companions, but unfortunately failed due to guide star acquisition problems (Schroeder et al. schroeder00 (2000)).
6 Conclusions
Through a survey for high proper motion objects, we have identified Indi B, a T2.5 dwarf, the brightest object in the T spectral class, and the nearest bona fide brown dwarf to the Sun. In combination with its accurately known distance, relatively well-known age, and large separation from its primary star, these characteristics make Indi B a new benchmark in the study of substellar objects, amenable to a wide range of detailed atmospheric and chemical observations. Urgently needed, however, are more accurate near-infrared photometry, including measurements out to the band, and spectral model fitting to derive an explicit bolometric magnitude for Indi B, and thus help calibrate the presently poorly-understand L-T dwarf boundary.
Acknowledgements.
We would like to thank Lutz Wisotzki for helping arrange the taking of near-infrared classification spectra during an unrelated NTT run on very short notice. This discovery is based on the excellent data of the SuperCOSMOS Sky Surveys at the Wide-Field Astronomy Unit of the Institute for Astronomy, University of Edinburgh and we would like to thank Nigel Hambly for his advice on the use of SSS data. We also thank the referee for some helpful comments. We have made use of data products from the Two Micron All Sky Survey, a joint project of the University of Massachusetts and IPAC, funded by NASA and the NSF, and of the VizieR catalogue access tool, CDS, Strasbourg. NL thanks the EC Research Training Network “The Formation and Evolution of Young Stellar Clusters” (HPRN-CT-2000-00155) for financial support.References
-
(1)
Burgasser, A. J. 2002,
www.astro.ucla.edu/adam/homepage/research/tdwarf - (2) Burgasser, A. J., Kirkpatrick, J. D., Cutri, R. M. et al. 2000, ApJ, 531, L57
- (3) Burgasser, A. J., Kirkpatrick, D. J., Brown, M. E. et al. 2002, AJ, 564, 421
- (4) Burgasser, A. J., Kirkpatrick, J. D., McElwain, M. W., Cutri, R. M., Burgasser, A. J., & Skrutskie, M. F. 2003, AJ, in press, astro-ph/0211117
- (5) Burrows, A., Marley, M., Hubbard, W. B. et al. 1997, ApJ, 491, 856
-
(6)
Carpenter, J. M. 2002,
www.astro.caltech.edu/jmc/2mass/v3/quicklook - (7) Chabrier, G., 2002, ApJ, 567, 304
- (8) Chabrier, G., Baraffe, I., Allard, F., & Hauschildt, P. 2000, ApJ, 542, 464
- (9) Cruz, K. L., & Reid, I. N. 2002, AJ, 123, 2828
- (10) Dahn, C. C., Harris, H. C., Vrba, F. J. et al. 2002, AJ, 124, 1170
- (11) Delfosse, X., Forveille, T., Martín, E. L., et al. 2001, A&A, 366, L13
- (12) Endl, M., Kürster, M., Els, S. et al. 2002, A&A, 392, 671
- (13) ESA 1997, Hipparcos and Tycho catalogues, ESA-SP 1200
- (14) Geballe, T. R., Knapp, G. R., Leggett, S. K. et al. 2002, AJ, 564, 466
- (15) Hambly, N. C., Davenhall, A. C., Irwin, M. J., & MacGillivray, H. T. 2001c, MNRAS, 326, 1315
- (16) Hambly, N. C., Irwin, M. J., & MacGillivray, H. T. 2001b, MNRAS, 326, 1295
- (17) Hambly, N. C., MacGillivray, H. T., Read, M. A., et al. 2001a, MNRAS, 326, 1279
- (18) Henry, T. J., Ianna, P. A., Kirkpatrick, J. D., & Jahreiß, H. 1997, AJ, 114, 388
- (19) Lachaume, R., Dominik, C., Lanz, T., & Habing, H. J. 1999, A&A, 348, 897
-
(20)
Leggett, S. K. 2002,
ftp.jach.hawaii.edu/pub/ukirt/skl/dT.spectra - (21) Leggett, S. K., Geballe, T. R., Fan, X. et al. 2000, ApJ, 536, L35
- (22) Leggett, S. K., Golimowski, D. A., Fan, X. et al. 2002, ApJ, 564, 452
- (23) Lépine, S., Rich, R. M., & Shara, M. M. 2002a, AJ, in press, astro-ph/0209284
- (24) Lépine, S., Rich R. M., Neill, J. D., Caulet, A., & Shara, M. M. 2002b, ApJ Letters, 581, L47
- (25) Lodieu, N., Scholz, R.-D., & McCaughrean, M. J. 2002, A&A, 389, L20
- (26) McCaughrean, M. J., Scholz, R.-D., & Lodieu, N. 2002, A&A, 390, L27
- (27) Reid, I. N. 2002, www-int.stsci.edu/inr/ldwarf.html
- (28) Reid, I. N., & Cruz, K. L. 2002, AJ, 123, 2806
- (29) Reid, I. N., Kilkenny, D., & Cruz, K. L. 2002, AJ, 123, 2822
- (30) Reid, I. N., Kirkpatrick, J. D., Gizis, J. E., et al. 2000, AJ, 119, 369
- (31) Reid, I. N., Kirkpatrick, J. D., Liebert, J. et al. 1999, ApJ, 521, 613
- (32) Reylé, C., Robin, A. C., Scholz, R.-D., & Irwin, M. J. 2002, A&A, 390, 491
- (33) Ruiz, M. T., Leggett, S. K., & Allard, F. 1997, ApJ, 491, 107
- (34) Scholz, R.-D., & Meusinger, H. 2002, MNRAS, 336, L49
- (35) Scholz, R.-D., Meusinger, H., & Jahreiß, H. 2001, A&A, 374, L12
- (36) Scholz, R.-D., Szokoly, G. P., Andersen, M., et al. 2002, ApJ, 565, 539
- (37) Schroeder, D. J., Golimowski, D. A., Brukardt, R. A. et al. 2000, AJ, 119, 906
- (38) Tinney, C. G. 1996, MNRAS, 281, 644
- (39) Tinney, C. G. 1998, MNRAS, 296, L42