Reproducing the entropy structure in galaxy groups
We carry out a comparison between observations and hydrodynamic simulations of entropy profiles of groups and clusters of galaxies. We use the Tree+SPH GADGET code to simulate four halos of sizes in the range, corresponding to poor groups up to Virgo-like clusters. We concentrate on the effect of introducing radiative cooling, star formation, and a variety of non-gravitational heating schemes on the entropy structure and the stellar fraction. We show that all the simulations result in a correct entropy profile for the Virgo-like cluster. With the heating energy budget of keV/particle injected at , we are also able to reproduce the entropy profiles of groups. We obtain the flat entropy cores as a combined effect of preheating and cooling, while we achieve the high entropy at outskirts by preheating. The resulting baryon fraction locked into stars is in the 25–30% range, compared to 35–40% in the case of no preheating. Heating at higher redshift, , strongly delays the star-formation, but fails to produce a sufficiently high specific entropy.
Key Words.:
clusters: cosmology; cosmic star-formation1 Introduction
Clusters of galaxies represent invaluable astrophysical laboratories for the study of the evolution of diffuse cosmic baryons and their interplay with the processes of star formation and galaxy evolution. The observational determination of scaling relations between X-ray properties, such as luminosity , gas temperature , and entropy have now demonstrated that this interplay is crucial in establishing the physical properties of the intra-cluster medium (ICM). The slope of the relation (e.g. Markevitch 1998), the amplitude of the mass–temperature relation (e.g. Finoguenov, Reiprich, Böhringer 2001b) and the gas entropy level (e.g. Ponman, Cannon & Navarro 1998; Finoguenov et al. 2002) are all at variance with respect to model predictions based on pure gravitational heating (Kaiser 1986) and call for the need of introducing extra physics to describe the thermodynamics of the ICM (e.g. Evrard & Henry 1991). The influence of the energy feedback on the resulting ICM properties caused in turn an interest in using clusters of galaxies as fossil records of the past history of star formation (e.g. Menci & Cavaliere 2000; Bower et al. 2001) and the corresponding metal production (e.g. Renzini 1997, Finoguenov, Arnaud & David 2001a, Pipino et al. 2002). Following the approach developed in a series of works (e.g. Bower 1997; Ponman, Cannon, Navarro 1999; Tozzi & Norman 2001; Borgani et al. 2001), we use the entropy to characterize the properties of the ICM. We adopt the entropy estimator [keV cm2], where is the gas temperature and is the local electron number density. So far the reproduction of the cluster properties in simulations has generally been restricted to a comparison with general scaling properties of the clusters, such as the and the relations (Bialek, Evrard & Mohr 2001; Borgani et al. 2002; Muanwong et al. 2002; Davé, Katz & Weinberg 2002; Kay, Thomas & Theuns 2002; and references therein). In this Letter we carry out a detailed comparison between the simulations, including the effect of radiative cooling and non-gravitational heating, and X-ray observations of entropy profiles in groups and clusters of galaxies. Our prime goals are to check under which conditions the shape of the observed profiles and their scatter can be reproduced and which is the effect of cooling/heating in determining both the entropy characteristics of the ICM and the amount of gas locked into the cold (stellar) phase.
2 Description of simulations and observations
We use GADGET, a fully parallel Tree+SPH code with adaptive time-stepping (Springel, Yoshida & White 2001). The version of the code used here includes the effect of radiative cooling and photo-ionizing UV background, while using an entropy-conserving implementation of the SPH with arithmetic symmetrization of the pairwise pressure force among gas particles (Springel & Hernquist 2002). We simulate four halos, having virial mass in the range , selected from a DM-only simulation of a CDM model with , , and for the baryon fraction, within a box of size (see Tornatore et al. 2002, for a detailed description of the simulations). The simulated structures encompass the mass range characteristic of moderately rich clusters to groups, where the effect of non-gravitational gas heating is expected to be more important. Following the method by Katz & White (1993), mass and force resolution is increased in the Lagrangian patch of the simulation which form by a region encompassing several virial radii of the selected halos. Resolution is progressively degraded in the outer parts, so as to save computational time, while providing a correct representation of the large-scale tidal field. In the high resolution region, we choose the kpc for the Plummer-equivalent softening scale, which is kept fixed in physical scale out to , while it is kpc fixed in co-moving scale at earlier times. Gas particles in the high-resolution region have a mass . Since finite resolution could lead to an underestimate of the fraction of gas converted into stars (e.g. Balogh et al. 2001; Tornatore et al. 2002), several runs of groups have been realized at better mass resolution, and twice as small force softening scale. Therefore, while the low-resolution group runs only provide lower limits to the fraction of gas locked into stars, the high-resolution runs are able to resolve galaxy-sized halos well below and provide numerically more reliable results on the stellar mass fraction. As such, our simulations represent among the highest-resolution attempt to characterize the gas cooling within groups and clusters of galaxies. The main characteristics of the simulations are described in Table 1, where for each structure we give the mass within overdensity , (units of ) and the number of gas particles, , within the virial radius at in the runs with gravitational heating only. Besides including only gravitational gas heating (GH in the notation of Table 1), our runs include the effects of cooling and the star formation recipe by Katz, Weinberg & Hernquist (1996), which converts dense and cold gas particles into collisionless stars (SF runs). Since no successful approach has been yet developed to include in simulations the effect of supenova (SN) energy feedback in a physically motivated and self-consistent way, we follow purely phenomenological recipes to include non-gravitational gas heating, which are described in the following. The total heating energy budget in such schemes was chosen so as to agree with observations of SN products in the diffuse ICM (Finoguenov et al. 2001a) and in stars (Renzini 1997).
| Simulation | E♭ | Line coding | ||
| Virgo; ; ; Fig.1(c) | ||||
| GH | 0.12 | — | — | dot-long dash |
| SF | 0.09 | 0.25 | — | short-long dash |
| S25-9 | 0.11 | 0.12 | 0.5 | long dash |
| S50-9 | 0.11 | 0.07 | 0.9 | dot-short dash |
| S50-3 | 0.10 | 0.18 | 0.8 | dotted |
| K75-3 | 0.10 | 0.18 | 0.75 | solid |
| Group 1; ; ; Fig.1(b) | ||||
| GH | 0.12 | — | — | dot-long dash |
| SF | 0.08 | 0.37 | — | short-long dash |
| S25-9♮ | 0.11 | 0.11 | 0.4 | long dash |
| S50-9♮ | 0.11 | 0.02 | 0.9 | dot-short dash |
| S50-3 | 0.08 | 0.26 | 0.9 | dotted |
| K75-3 | 0.07 | 0.27 | 0.75 | solid |
| Group 2; ; thick lines in Fig.1(a) | ||||
| GH | 0.13 | — | — | dot-long dash |
| SF | 0.08 | 0.37 | — | short-long dash |
| S25-9♮ | 0.11 | 0.17 | 0.4 | long dash |
| S50-9♮ | 0.12 | 0.02 | 0.9 | dot-short dash |
| S50-3 | 0.08 | 0.27 | 0.9 | dotted |
| K75-3 | 0.07 | 0.28 | 0.75 | solid |
| Group 3; ; thin lines in Fig.1(a) | ||||
| GH | 0.13 | — | — | dot-long dash |
| SF | 0.08 | 0.38 | — | short-long dash |
| S25-9♮ | 0.11 | 0.04 | 0.4 | long dash |
| S50-9♮ | 0.10 | 0.00 | 0.8 | dot-short dash |
| S50-3 | 0.06 | 0.25 | 0.6 | dotted |
| K75-3 | 0.05 | 0.26 | 0.75 | solid |
-
†
, i.e. initial baryon fraction
-
♭
keV particle-1, using
-
♮
low-resolution run
- (a)
-
Imposing a minimum entropy floor, , at some heating redshift (e.g. Tozzi & Norman 2001; Bialek et al. 2001; Borgani et al. 2002). The entropy floor is created by increasing the temperature of those gas particles having , while leaving unchanged those particles staying already at a higher adiabat. We choose here , so as to heat the diffuse gas well before a substantial amount of it can cool within collapsed halos, and , which is closer to the epoch at which star formation peaks in the proto-cluster region. We realize three series of runs, corresponding to and 50 keV cm2 at (S25-9 and S50-9, respectively) and to the higher floor value at (S50-3) (see fourth column of Table 1, for the average amount of heating received by the gas particles ending up within the halo virial regions at ).
- (b)
-
Heating with an equal amount of energy per particle, keV/particle, at (K75-3). This energy budget is comparable to that provided by the S50-3 scheme. Such a prescription leads to an enhanced non-gravitational heating in the low density gas and is characterized by a small fraction of subsequent radiative losses of the feedback energy, 20% compared to 80% in the S50-3 run. These radiative losses when subtracted from the input energy can be used as a measure of the type II SN feedback energy retained in the gas. This effect should not be confused with the result of radiative cooling to increase the mean specific energy of the remaining gas by turning its colder component into stars.
The simulations presented here neglect the influence of metal abundance on the cooling function, which correspond to the conditions in the pristine gas. While this is an oversimplification for the low-redshift ICM, it is worth wondering how the observed can be reproduced. Pipino et al. (2002) considered an iron enrichment on the precollapse ratio of stars and gas, and concluded that only 0.1 Fe⊙ abundance could be reached with a Salpeter IMF, corresponding to a mild underestimation of cooling in our simulations (a factor of 1.5 for the gas at temperature of 1 keV). Using the ratio between iron mass and stellar light Finoguenov et al. (2000) showed that high Fe abundance observed in groups and cluster cores is a result of a reduced gas fraction. Thus, before assuming an observed Fe abundance for the cooling function, one has to produce a strong deviation from self-similarity with low-metallicity cooling, as we do in this Letter. A subsequent increase of Fe abundance will further rise the minimum entropy level required for gas particles to remain in the hot phase.
The results from simulations are compared with the ASCA observations for a sample of 38 groups and clusters of galaxies, presented in Finoguenov et al. (2000, 2001a, 2002). This large sample has been assembled during ten years of telescope operation, with large spatial coverage for individual systems, possible due to low detector background and an advanced stage of the instrument calibration. The observations provide entropy, total gravitational mass, and heavy element profiles. To compare with simulations we will use entropy profiles scaled by . Under the assumption of hydrostatic equilibrium, , so that the above entropy rescaling produces overlapping profiles for different mass objects, as long as the ICM behaves in a self-similar way. As for the observed fraction of cluster baryons locked into stars, , Balogh et al. (2001) estimated it to be 5 (or 10) % from the 2MASS K-band luminosity function by Cole et al. (2001), assuming a Kennicutt (1983) (or Salpeter, 1955) initial mass function (IMF). Also, it is clear that this will represent a convergent estimate as long as the galaxy survey is deep enough to trace most part of the K-band luminosity. Quite recently, Huang et al. (2002) used the Hawaii–AAO survey to estimate the K-band galaxy luminosity function. Although this survey covers a small area, it is much deeper than the 2MASS. As a result these authors found the K-band luminosity density to be a factor two higher than that derived from the 2MASS, which would roughly imply a proportionally higher value for . Furthermore, it is also questionable whether the value for the field could be taken as representative for clusters. Owing to such uncertainties, we adopt the to range in the 10–20 per cent interval, as representative of what is currently indicated by data. Differences in the fraction of diffuse gas, , as reported in Col. 2 of Table 1, are both due to different efficiency of star formation and to the different spatial extent of the gas associated to the different heating schemes. To provide an unbiased comparison for the stellar fraction, we compare it to the initial baryon mass, by using the total mass and the initial baryon fraction.
3 Results and discussion
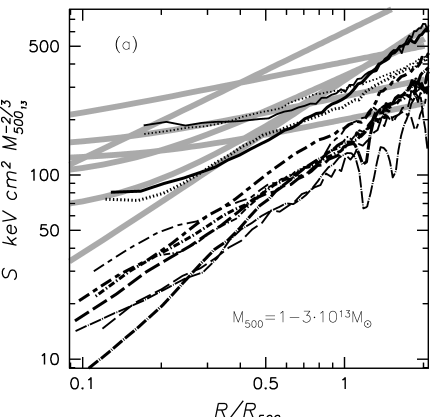
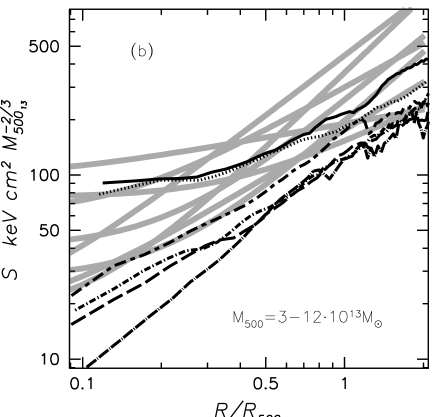
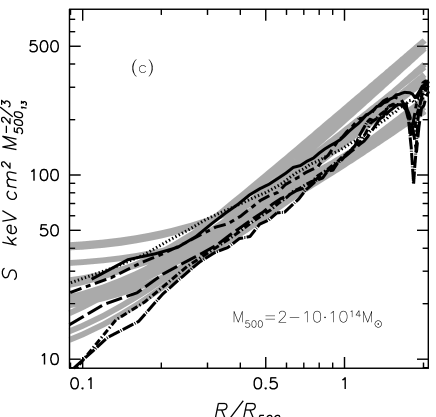
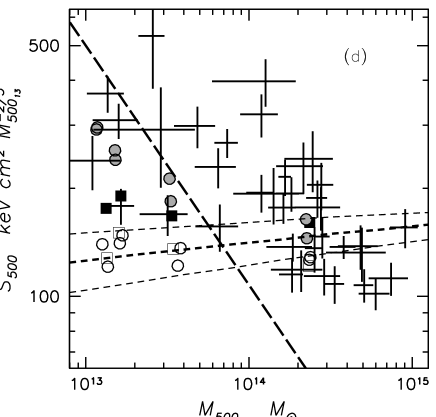
Figure 1 summarizes the comparison between the entropy properties of the ICM for simulated and observed galaxy systems. Panel (a) shows the entropy profiles for observed groups with , compared to the entropy profiles from the simulations of Group-2 and Group-3, panel (b) is for data on groups and poor clusters with and the simulation of the Group-1, panel (c) is for observed clusters with and the “Virgo” cluster simulation. Panel (d) shows the positions of real and simulated structures on the plane (Finoguenov et al. 2002; here is the entropy computed at ). Entropy profiles from simulations are plotted down to the radius which contains 100 gas particles. This criterion has been shown by Borgani et al. (2002) to avoid numerical effects and provides results which are stable against numerical resolution.
In panel (a), where we realize the best matching between the masses of simulated and observed structures, the preheating runs with reproduce all the entropy characteristics of the observational data. We note that the S50-3 and K75-3 runs are characterized by comparable amounts of both extra energy and resulting stellar fraction, despite the fact that the two heating recipes spread a different amount of energy to gas at different density. The differences between the two prescriptions come at radii exceeding , where the S50-3 approaches the entropy level produced by the gravitational heating case, while in the K75-3 run the entropy keeps increasing parallel to the GH simulations. This behavior could be attributed to the way the gas has been distributed at , before its accretion onto clusters. Assigning an equal amount of extra heating to all gas particles is somewhat equivalent to the effect produced by an accretion shock of a fixed strength. Therefore, if self-similarity of the gas holds, the effect of heating will result in a radial behavior of the entropy, which is similar to that of gravitational heating. On the contrary, the S50-3 heating has a marginal effect in increasing the temperature of low-density regions and, therefore, is less efficient in preventing the occurrence of the gravitational shock. As a result, gas undergoes roughly the same amount of gravitational heating as in the self-similar case, whose entropy level is in fact attained in the outer halo regions. At radii lower than – in Fig.1(a-b) the effect of heating is the same in both the K75-3 and the S50-3 runs. According to the energy distribution, one expects the S50-3 to achieve a higher entropy at lower radii. Yet the profiles are nearly the same. This points to an important role of cooling in equating the K75-3 and the S50-3 runs at the center. The difference between the two runs is in the cooling times at high-density regions, which are shorter for K75-3. A similarity in both the entropy profiles and cold fractions indicate that all the high-density gas has been cooled irregardless of the amount of energy put there.
Cooling has been suggested as a mechanism to increase the observed entropy level of the ICM (e.g. Voit et al. 2002, and references therein). Although, by their nature, radiative losses decrease gas entropy, low-entropy particles, which have short cooling time, , are removed from the X-ray emitting phase, thus leaving only high entropy gas, which has longer . However, our results actually show that including star formation and no extra heating produce too steep entropy profiles, an effect which is more evident in the runs of groups. This result suggests that a fair population of low-entropy particles is still left in the diffuse phase during the cooling process. Since cooling of the preheated component is negligible, a combination of preheating and cooling better matches the conditions needed for the model of Voit & Bryan (2001) to produce a plateau in the entropy profile: a required separation between the low-entropy gas, which is able to cool and the high entropy gas retained in the hot phase. At outskirts of the groups, however, as shown in Fig.1(d), the observed entropy could only be explained by runs with preheating at .
In Fig.3 we outline the difference between simulation runs in accounting at the same time for gas entropy and star fraction. As expected, the effect of including only gas cooling and star formation is an over-production of the amount of gas locked in the cold phase, while it is only marginal accounting for the observed gas entropy level. The preheating at results in a much delayed star-formation, pointing out the need of strongly reducing the energetics of preheating at that epoch. However, even with the amount of energy assigned in our runs, it is not possible to reproduce the high entropy level observed in groups.
![[Uncaptioned image]](/html/astro-ph/0212450/assets/x5.png)
Heating at performs better in reproducing the observed entropy level, while it still results in some overproduction of the stellar mass fraction. Besides the uncertainties in the observational determination of , there is also a number of physical effects, which are not included in our simulations and which should help in further alleviating gas overcooling. For instance, our preheated runs with ignore a possible additional feedback from the formation of the first stars (e.g. Madau, Ferrara & Rees 2001), which, according to our experience with the run, could delay accretion of the gas on the forming halos, both delaying the star-formation (Tornatore et al. 2002) and, in combination with the preheating, reducing the fraction of the accreted gas, which could later be available for the star-formation. As a concluding remark, one of the most important results of our analysis is that the entropy profiles in simulations do not depend only on the amount of extra energy, but also on the details of energy ejection, such as the epoch and the spatial distribution. We have demonstrated that the processes of gas accretion, recorded in the gas entropy profiles, also regulate the star-formation.
Acknowledgments. We are very grateful to Volker Springel for providing support in using GADGET, the referee, Mark Voit, for constructive comments, and Trevor Ponman and Paolo Tozzi for useful discussions. The simulations have been run on the IBM-SP3 at the Computing Centers of the Astronomical Observatory in Catania and of the University of Trieste, and on the IBM-SP4 at CINECA in Bologna, under INAF-CINECA grant.
References
- (1) Balogh, M.L., Pearce, F.R., Bower, R.G., Kay, S.T. 2001, MNRAS, 326, 1228
- (2) Bialek, J.J., Evrard, A.E., Mohr, J.J. 2001, ApJ, 555, 597
- (3) Borgani, S., Governato, F., Wadsley, J., et al. 2001, ApJ, 559, L71
- (4) Borgani, S., Governato, F., Wadsley, J., et al. 2002, MNRAS, 336, 409
- (5) Bower, R. G. 1997, MNRAS, 288, 355
- (6) Bower, R. G., Benson, A. J., Lacey, C. G., Baugh, C. M., Cole, S., Frenk, C. S. 2001, MNRAS, 325, 497
- (7) Cole, S., Norberg, P., Baugh, C.M., Frenk, C.S., Bland-Hawthorn, J., et al. 2001, MNRAS, 326, 255
- (8) Davé, R., Katz, N., Weinberg, D.H. 2002, ApJ, 579, 23
- (9) Evrard, A.E., Henry, J.P. 1991, ApJ, 383, 95
- (10) Finoguenov, A., David, L.P., Ponman, T.J. 2000, ApJ, 544, 188
- (11) Finoguenov, A., Arnaud, M., David, L.P. 2001a, ApJ, 555, 191
- (12) Finoguenov, A., Reiprich T., Böhringer, H. 2001b, A&A, 368, 749
- (13) Finoguenov, A., Jones, C., Böhringer, H., Ponman, T.J. 2002, ApJ, 578, 74
- (14) Huang, J.-S., Glazebrook, K., Cowie, L.L., Tinney, C. preprint astro-ph/0209440
- (15) Kaiser, N. 1986, MNRAS, 222, 323
- (16) Katz, N., White, S.D.M. 1993, ApJ, 412, 455
- (17) Katz, N., Weinberg, D.H., Hernquist, L. 1996, ApJS, 105, 19
- (18) Kay, S.T., Thomas, P.A., Theuns, T. 2002, MNRAS, submitted, (astro-ph/0210560)
- (19) Kennicutt, R.C. 1983, ApJ, 272, 54
- (20) Madau, P., Ferrara, A., Rees, M.J. 2001, ApJ, 555, 92
- (21) Markevitch, M. 1998, ApJ, 504, 27
- (22) Menci, N., Cavaliere, A. 2000, MNRAS, 311, 50
- (23) Muanwong, O., Thomas, P.A., Kay, S.T., Pearce, F.R. 2002, MNRAS, 336, 527
- (24) Pipino, A., Matteucci, F., Borgani, S., Biviano, A. 2002, NewA, 7, 227
- (25) Ponman, T.J., Cannon, D.B., Navarro, J.F. 1999, Nature, 397, 135
- (26) Renzini, A. 1997, ApJ, 488, 35
- (27) Salpeter, E.E. 1955, ApJ, 121, 161
- (28) Springel, V., Yoshida, N., White, S.D.M. 2001, NewA, 6, 79; http://www.MPA-Garching.MPG.DE/gadget/
- (29) Springel, V., Hernquist, L. 2002, MNRAS, 333, 649
- (30) Tornatore, L. et al. 2002, in preparation
- (31) Tozzi, P., Norman, C. 2001, ApJ, 546, 63
- (32) Voit, G.M., Bryan, G.L. 2001, Nature, 414, 425
- (33) Voit, G.M., Bryan, G.L., Balogh, M.L., Bower, R.G. 2002, ApJ, 576, 601