1 \sameaddress2 \sameaddress2
The Nature of the Low-Metallicity ISM in the Dwarf Galaxy NGC 1569
Abstract
We are modeling the spectra of dwarf galaxies from infrared to submillimeter wavelengths to understand the nature of the various dust components in low-metallicity environments, which may be comparable to the ISM of galaxies in their early evolutionary state. The overall nature of the dust in these environments appears to differ from those of higher metallicity starbursting systems. Here, we present a study of one of our sample of dwarf galaxies, NGC 1569, which is a nearby, well-studied starbursting dwarf. Using ISOCAM, IRAS, ISOPHOT and SCUBA data with the Désert et al (1990) model, we find consistency with little contribution from PAHs and Very Small Grains and a relative abundance of bigger colder grains, which dominate the FIR and submillimeter wavelengths. We are compelled to use 4 dust components, adding a very cold dust component, to reproduce the submillimetre excess of our observations.
1 Introduction
Dwarf galaxies in our local universe are ideal laboratories for studying the interplay between the ISM and star formation in low-metallicity environments (Hunter & Gallagher 1989). They are at relatively early epochs of their chemical evolution, possibly resembling distant protogalaxies in their early stages of star formation. Although only a few metal-poor galaxies have been observed in the MIR using ISO, the characteristics of the MIR dust components appear to differ remarkably from those of normal-metallicity starbursts (Madden 2000). Whether this is an abundance or composition effect is not yet clear.
For this reason, we are studying their detailed luminosity budget by modeling their spectral energy distributions (SEDs) from optical to millimeter wavelengths, thereby constructing templates to study conditions in primordial galaxies to help to constrain galaxy evolution models.
The galaxy we present here is NGC 1569. It is a HI-rich, metal-poor () dwarf irregular galaxy which lies near the galactic plane at a distance of (Israel 1988). NGC 1569 is presently in the aftermath of a massive burst of star formation (Israel 1988, Israel & De Bruyn 1988, Waller 1991) and exhibits very compact HII regions and 2 super-star-clusters (Hunter et al 2000).
2 Multi-wavelength observations
2.1 Broadband images
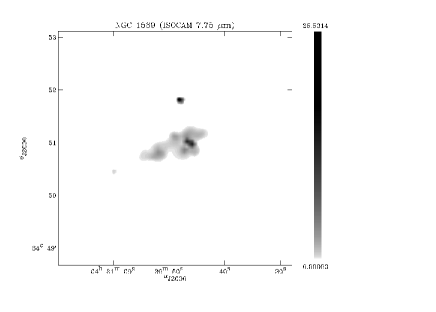
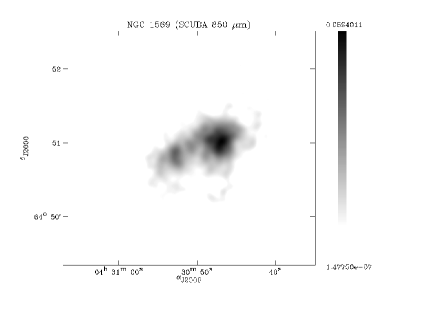
Figure 1 shows some of our broadband images of NGC 1569 with ISOCAM and SCUBA. The ISOCAM 7.75 band traces the aromatic bands (PAH) and the SCUBA band traces the cold grain continuum.
 |
|
2.2 The MIR spectrum
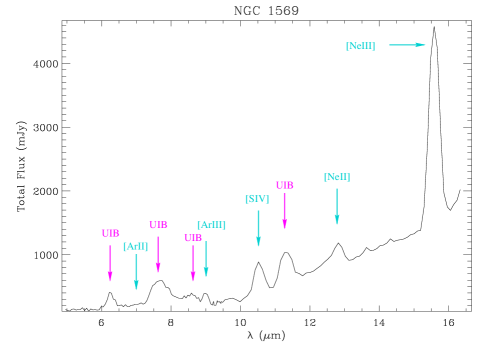
Figure 2 shows the ISOCAM CVF spectrum for NGC 1569. Compared to a normal disk galaxy, there are very strong ionic lines due to O-B stars. The ratio limits the age of the stellar clusters to 5 Myr. There are weak aromatic bands, probably due to the destruction of the carriers as a consequence of the hard penetrating radiation field in the low-metallicity environement. Moreover, there’s a very steeply rising continuum due to very small grains emission (see the the Désert et al (1990) model) which are stochastically heated.
3 Dust emissivity modeling
3.1 The Désert et al (1990) Model
The Désert et al (1990) model empirically computes the dust emissivity from near-infrared to submillimetre wavelengths. It is a coherent interpretation of both the interstellar extinction and the infrared emission. The emission originates from three different components: the PAH (Polycyclic Aromatic Hydrocarbon) which are aromatic 2-dimensional molecules producing the FUV non-linear part of the extinction curve, the VSG (Very Small Grains) which are 3-dimensional carbon grains apparently responsible for the absorption bump at 217.5 nm, the BG (Big Grains) which are 3-dimensional silicate grains explaining the NIR and visible rise of the extinction curve. Each component is described by four parameters: a minimum and maximum grain size ( and ), a power-law index, , for the size distribution and a scaling factor which is the mass abundance relative to Hydrogen (). The number density of grains of radius between and is .
3.2 Modeling the dust in NGC 1569
We model the SED of this galaxy, fitting the Désert et al (1990) dust model to our observations (broadbands and spectrum). We make the link between the stellar radiation field and the full dust spectrum by modeling the stellar populations with PEGASE (Fioc, Rocca-Volmerange, 1997) using UV to NIR data from the literature and MIR ionic lines as a further constraint. We then use our modeled stellar radiation field as input to the dust model.
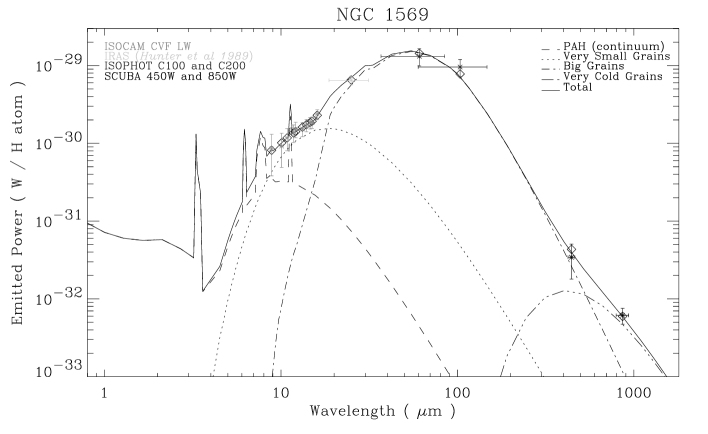
To obtain the best fit, we vary different parameters of the model: the mass abundances (), the minimum and maximum sizes ( and , except ), assuming the continuity of the size distribution, and the extinction of the synthesized radiation field. However, if we try to fit our data with only the three components, there remains a submillimetre excess we can’t explain. We decide to add a fourth component corresponding probably to Very Cold Grains (VCGs), modeled by a black body with an emissivity index to reproduce this excess and to obtain a correct fit varying the mass abundance of this component. Finally we get for 15 data points and 8 free parameters. All the parameters used are summarized in the following table and compared to the values for the Milky-Way. The best fit we obtained is shown on figure 3.
| PAH | VSG | BG | VCG | |||||
|---|---|---|---|---|---|---|---|---|
| Milky | NGC | Milky | NGC | Milky | NGC | NGC | ||
| Way | 1569 | Way | 1569 | Way | 1569 | 1569 | ||
| 4 | 4 | 12 | 37 | 150 | 47 | T | 7 K | |
| 12 | 37 | 150 | 47 | 1100 | 8500 | 1.0 | ||
| 3 | 3 | 2.6 | 2.6 | 2.9 | 2.9 | |||
4 Conclusion
The dust masses deduced from our modeling are , , , and the gas-to-dust mass ratio is . The dust mass deduce from the extinction is which is the same order of magnitude as the mass deduced from the model. Our results seem to show that the dust mass in NGC 1569 is mainly concentrated in cold dust: big grains and very cold grains which both have roughly the same mass abundance. The PAHs as well as the VSGs are very sparse, while the SED is dominated by bigger grains.
References
- [1] Désert, F.X., Boulanger F., Puget, J.L., 1990, A&A, 237, 215
- [2] Fioc, M., Rocca-Volmerange, B., 1997, A&A, 326, 950-962
- [3] Galliano, F., Madden S., Jones, A., Wilson, C., 2001, in preparation
- [4] Hunter, D.A., Gallagher III, J.S., 1989, Science, 243, 1557
- [5] Hunter, D.A., Gallagher III, J.S., Rice, W.L., Gillett, F.C., 1989, ApJ, 336, 152
- [6] Hunter, D.A., O’Connel, R.W., Gallagher, J.S., Smecker-Hane, T.A., 2000, ApJ, 120, 2383-2401
- [7] Israel, F.P., 1988, 194, 24-32
- [8] Israel, F.P., De Bruyn, A.G., 1988, 198, 109-115
- [9] Madden, S.C., 2000, New Astronomy Reviews, 44, 249
- [10] Stil, J., 1999, PhD Thesis
- [11] Waller, W.H., 1991, 370, 144-157