The Time-Variable Ultra-Luminous X-ray Sources of “The Antennae”
Abstract
We report the first results of the Chandra temporal monitoring of the ultra-luminous X-ray sources (ULXs) in the Antennae galaxies (NGC 4038/39). Observations at four different epochs, covering time scales of 2 years to 2 months, show variability in seven out of nine ULXs, confirming that they are likely to be accreting compact X-ray binaries (XRBs). The seven variable ULXs exhibit a variety of temporal and spectral behaviors: one has harder X-ray colors with decreasing luminosity, similar to the black hole binary Cyg X-1, but four other ULXs show the opposite behavior. We suggest that the latter may be black-hole binaries accreting at very high rates.
1 Introduction
At a distance of 19 Mpc (), NGC 4038/39 have long been studied as the nearest examples of a galaxy pair undergoing a major merger. Recently, high resolution HST (e.g., Whitmore et al. 1999), Chandra (Fabbiano et al. 2001), and VLA (Neff & Ulvestad 2000) observations have produced exquisitely detailed images of these galaxies, providing an in-depth probe of their young stellar population. In the X-ray band (0.1–10 keV), the first Chandra observation of this system in December 1999 (Fabbiano et al. 2001) revealed a population of extraordinarily luminous point-like sources. Nine of these sources, which have hard spectra typical of X-ray binaries (XRBs), were detected with luminosities , significantly exceeding the Eddington luminosity of a spherically accreting neutron star (Zezas et al. 2002a). This type of Ultra Luminous X-ray source (ULX) has been reported in other nearby galaxies (e.g., Makishima et al. 2000), but never in such copious numbers. ULXs have been alternatively explained with massive black hole binaries (; e.g. Fabbiano 1989; Makishima et al. 2000), young Supernova remnants (e.g. Fabian & Terlevich 1996), or beamed XRBs (King et al. 2001). The ULXs of The Antennae appear significantly displaced from nearby young stellar clusters (Zezas et al. 2002b), suggesting that a significant fraction may not have a very massive counterpart (Zezas & Fabbiano 2002).
Given their large number of ULXs and our thorough knowledge of their stellar populations, The Antennae provide an exceptional environment for studying ULXs and comparing them to the more normal XRB population. To this end, a large Chandra monitoring campaign of The Antennae is under way. Here we report our first results, by comparing three recent observations with the original December 1999 data.
2 Observations and Analysis
Table 1 summarizes the log of the four Chandra ACIS-S (Weisskopf et al. 2000) observations of the Antennae galaxies discussed in the present Letter, and lists the net exposure times after background flares screening. We corrected the astrometry of the December 2001, April 2002, and May 2002 observations, following the method of Aldcroft (2002,111http://asc.harvard.edu/cal/ASPECT/align_evt/), by using bright sources ( detections) within 4′ from the optical axis, and referring all these observations to the one of December 1999, which has an absolute astrometry good to within (Zezas et al. 2002a). From each data set, we then created images in four different bands, following the prescriptions by Zezas et al. (2002a): Full band (0.3 – 7.0) keV; soft (0.3 – 1.0) keV; medium (1.0 – 2.5) keV; and hard (2.5 – 7.0) keV. We generated weighted exposure maps for each of the resulting images222CIAO Thread: http://asc.harvard.edu/ciao/threads/spectral_weights/, assuming a 5 keV thermal bremsstrahlung model with NH= (corresponding to the galactic line-of-sight absorbing column; Stark et al. 1992), which is appropriate for the relatively hard emission of the point-like sources (Zezas et al. 2002a, b). The same model was used to calculate the source fluxes (see below). We addressed the time-dependent change of the soft effective area of ACIS-S with the model ACISABS in XSPEC333http://asc.harvard.edu/cal/Acis/Cal_prods/qeDeg/ 444http://www.astro.psu.edu/users/chartas/xcontdir/xcont.html. We found that, although differences among the last three exposures were not significant, their integrated effective areas below 1.5 keV were all a factor of two smaller than that of the December 1999 exposure.
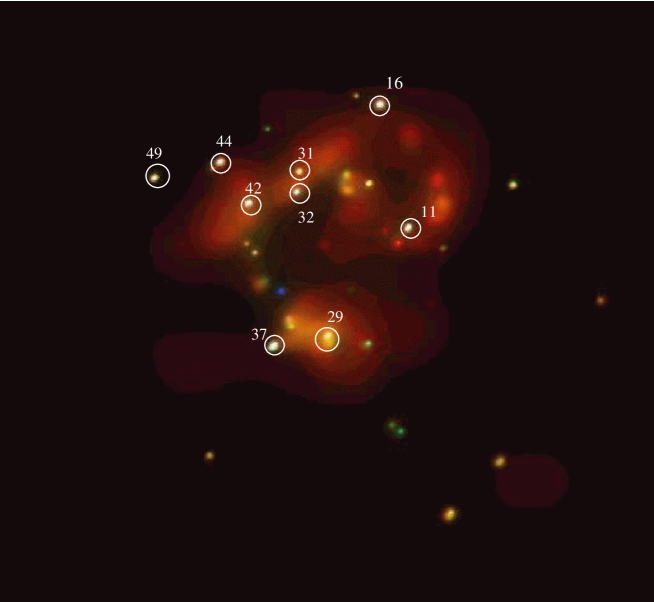
We used the CIAO wavedetect tool for source detection (above a threshold), with the same parameters as applied to the Dec 1999 observation (Zezas et al. 2002a). Exposure maps were applied, in order to correct for spatial variations in the sensitivity of the detector at the position of each source between different observations. We found that 10 of the sources are more luminous than in at least one of the observations. These sources are the ULXs discovered in the December 1999 data, plus a source that was present in those data, but at a lower luminosity. The latter is a super-soft source that is discussed in a separate Letter (Fabbiano et al., in preparation). The 9 ULXs are identified in Fig. 1. We calculated hardness ratios for each source, following the procedure and hardness ratio definitions of Zezas et al. 2002a. Comparison with the Dec 1999 data (requiring correction for the effective area degradation) and detailed spectral analysis of individual sources will be the subject of future work.
Figure 2 shows the light curves of the nine ULXs (in 10 ks bins), labeled with the source numbers from Zezas et al. (2002a; see Fig. 1). Given the error bars, variability in hour or shorter timescales is not readily detected from the binned data. A KS analysis of photon arrival times suggests variability within individual observations for five sources. The sources in the top panel appear as luminous ULXs at all four epochs, but show a variety of temporal behaviors: Source 11 appears to increase in luminosity during the December 2001 observation to reach a peak luminosity of in April 2002, and then decline to the level of in the May 2002 observation, a 70% drop in luminosity; Source 16 exhibits the opposite behavior, starting at nearly in Dec 1999, dipping to 40% of this luminosity in April 2002, and then recovering in the last observation. In contrast, Source 29, the nucleus of NGC 4039, is steady throughout. This latter source is embedded in a luminous extended emission region and has a soft spectrum, which could be due to complex emission from the nuclear starburst activity (Zezas et al. 2002b). The middle panel of Fig. 2 shows three slowly varying light curves: Sources 37 and 44 show a slight increase in luminosity from December 1999 to December 2001, and then decline steadily, while Source 42 shows a continuously declining luminosity. The maximum luminosity variation for these three sources is . The sources in the lower panel of Fig. 2 are all fainter: Source 31 has a steady luminosity of order ; Sources 32 and 49 disappear below the detection threshold of in April 2002, and reappear at the level in May 2002.
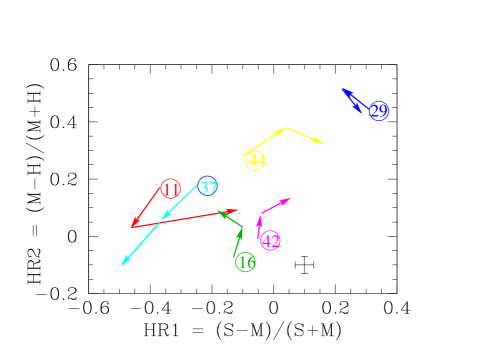
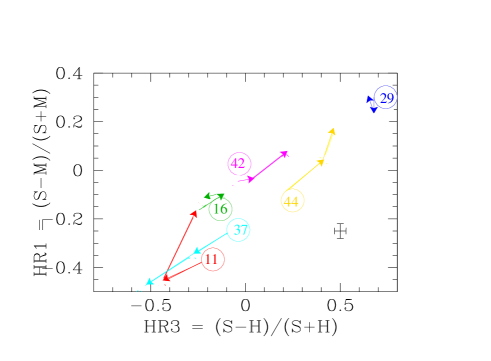
Figures 3a, b show the tracks of the six more luminous sources in two X-ray color–color diagrams. One of the five luminous variable sources (37) has colors suggesting a hardening of the spectrum with decreasing , while all others show the opposite behavior: 42 and 44 become softer, following their smoothly decreasing ; 11 and 16, who undergo a luminosity flare and a dip respectively, have respectively harder and softer colors corresponding to these events, although the color changes in 16 are marginal. Source 29 (the nucleus of NGC 4039) is the only steady source, and has consistent HR3 (S-H/S+H) colors, with a possible variation in the relative medium band emission in the April 2002 data. The other steady source (31) has consistent colors (not plotted), but significantly larger error bars. Sources 32 and 49 are too faint for meaningful color determinations; their spectra are generally consistent with those of the other variable ULXs in the December 1999 data (Zezas et al. 2002a).
3 Discussion
The above results show that all but two of the nine ULXs we detect in the Chandra monitoring observations of the Antennae galaxies are variable. Of the two non-variable ULXs, one is rather faint, and the other is the nucleus of NGC 4039. Hence, our results are consistent with widespread variability of all non-nuclear ULXs. Time variability (and when available spectral variability) suggests that XRBs are the likely counterparts, strengthening the earlier conclusion of Zezas et al. (2002a, b), which was based mainly on the hard X-ray spectra of the ULXs.
In only one case do we find the ‘canonical’ high/soft–low/hard behavior seen in Galactic black hole binaries such as Cyg X-1. This behavior has been explained with the dominance of the accretion disk emission in high state, over that of the innermost spherical hot flow that may be responsible for the power-law in the thin-disk model (Shapiro et al. 1976), in response to increased accretion rates (e.g., Esin et al. 1998; Janiuk et al. 2000). High/soft–low/hard transitions have also been observed in some ULXs in nearby galaxies, including M81 X-9 (La Parola et al. 2001), M33 X-8 at the nucleus of M33 (La Parola et al. 2002), and two ULXs in IC 342 (Kubota et al. 2001).
In four other ULXs the spectrum softens with decreasing flux. A recent RXTE monitoring study has reported this kind of behavior in a few galactic XRBs (1E 1740.7-2942, GRS 1758-258, GX 339-4, Smith et al. 2002; see also the XMM-Newton results on GRS 1758-258, Miller et al. 2002). Smith et al. invoke a two-flow thin disk plus hot halo model. They suggest that a delayed response of the disk to a drop in accretion, to which the hot halo would respond immediately, could cause this low-soft effect in sources with large accretion disks. They argue that large disks may result from Roche-Lobe overflow from a low-mass K star companion. In their picture, the standard Cyg X-1 high/soft behavior could be related to the smaller accretion disk resulting from accretion from a massive companion, that would respond faster to changes in accretion rate.
Our results are at odds with this scenario. Although ULXs have also been detected in older stellar systems (E and S0 galaxies, e.g. Angelini et al. 2001; Colbert & Ptak 2002) the similar flat X-ray luminosity functions of The Antennae and other star-forming galaxies (Zezas & Fabbiano 2002; Kilgard et al. 2002) connects the ULXs of The Antennae with the younger stellar population, suggesting more massive companions than K stars, in contradiction with the Smith et al. (2002) scenario. Instead, binaries with very high accretion rates near the black hole may emit anisotropically and explain ULXs. This can occur in two situations: during the thermal-timescale mass transfer characterizing the later stages of a massive XRB (SS433 may be an example) and during outbursts of soft X-ray transients (as seen in microquasars). While the latter may explain the ULXs in E and S0 galaxies, the former is likely to dominate in The Antennae (King et al. 2001; King 2002). The X-ray emission in such very high accretion-rate sources would consist of direct blackbody emission from the immediate vicinity of the accretor with a temperature of a few keV, and emission from the central X-rays absorbed and re-emitted by the disk with slightly lower temperatures (see e.g. Frank et al. 2002, eqs 5.44, 5.96). Thus, if the accretion rate drops slightly, the spectrum will soften, as it is essentially black body, resulting in the low/soft behavior. A similar conclusion was reached by Miller et al. (2002), in their discussion of the low/soft behavior of the galactic microquasar GRS 1758-258. It may be a relevant point that the average co-added spectrum of the Antennae ULXs resembles that of galactic microquasars (Zezas et al. 2002b). In contrast, for much lower accretion rates the central blackbody source will be too soft to contribute strongly to the X-ray spectrum, which will be dominated by the corona, and sources will follow the Cyg X-1-like low/hard behavior.
In the King et al. (2001) model, beamed radiation from a thick accretion disk, resulting from thermal time scale mass transfer, could be responsible for the ULXs. The only restriction on the companions in this model is that they should have radiative envelopes, i.e., be earlier than about A0. The suggestion that the ULXs of The Antennae are runaway binaries originating from the young star clusters (Zezas et al. 2002b) may further restrict the companion mass to later than B2, since more massive systems would have evolved off the main sequence before reaching the observed average offset from the parent cluster (Zezas & Fabbiano 2002). While a recent paper by Misra & Sriram (2002) argues that axisymmetric funnel beaming cannot enhance the apparent luminosity to ULX values, self-consistent disk modeling shows that the disk must warp, resulting in a more efficient confinement of the radiation field (see Fig. 7 of Pringle 1997). As observational support of this, the galactic microquasar GRS1915+105 reaches ULX luminosities and has an apparent luminosity well above its Eddington limit. Greiner et al. (2001) estimate a distance of 12 kpc. The observed X-ray flux implies an apparent (isotropic) luminosity of erg s-1, about 3.8 times the Eddington limit corresponding to Greiner et al’s measured dynamical mass of 14 M⊙.
4 Conclusions
We have found widespread variability of all non-nuclear ULXs in the Antennae galaxies. While one of these sources follows a Cyg X-1 like high/soft–low/hard behavior, four other sources instead become softer with decreasing luminosity. We suggest that black hole binaries with very high accretion rates could explain the low/soft correlation. In all cases beaming due to thick warped disks could boost the luminosity to super-Eddington values.
References
- Angelini, Loewenstein, Mushotzky (2001) Angelini, L., Loewenstein, M., & Mushotzky, R. F. 2001, ApJ, 557, L35
- (2) Colbert, E. J. M. & Ptak, A. F. 2002, ApJS, in press (astro-ph/0204002)
- Esin et al (1998) Esin, A., Narayan, R., Cui, W., Grove, J. E., & Zhang, S. N. 1998, ApJ, 505, 854
- Fabbiano (1989) Fabbiano, G. 1989, Ann. Rev. Ast. Ap., 27, 87
- Fabbiano et al (2001) Fabbiano, G., Zezas, A., & Murray, S. 2001, ApJ, 554, 1035
- Fabian & Terlevich (1996) Fabian, A. & Terlevich, R. 1996, MNRAS, 280, 5
- Frank et al (2002) Frank, J., King A.R., Raine, D.J., 2002, Accretion Power in Astrophysics (3rd ed; Cambridge: Cambridge University Press)
- Greiner at al (2002) Greiner, J., Cuby, J. G., McCaughrean, M. J. 2001, Nature, 414, 522
- Janiuk, Zycki & Czerny (2000) Janiuk, A., Zycky, P. T. & Czerny, B. 2000, MNRAS, 314, 364
- Kilgard et al. (2002) Kilgard, R., Kaaret, P., Krauss, M., Prestwich, A. H., Raley, M. & Zezas, A., 2002, ApJ, 573, 138
- King (2002) King, A. R. 2002, MNRAS, 335, L13
- King et al. (2001) King, A. R., Davies, M. B., Ward, M. J., Fabbiano, G., & Elvis, M. 2001, ApJ, 552, L109
- Kong et al (2002) Kong, A. K. H., Garcia, M. R., Primini, F. A., Murray, S. S., Di Stefano, R., McClintock, J. E. 2002, ApJ, 557, 738
- Kubota et al. (2001) Kubota, A., Mizuno, T., Makishima, K., Fukazawa, Y., Kotoku, J., Ohnishi, T., & Tashiro, M. 2001, ApJ, 547, L119
- La Parola et al. (2001) La Parola, V., Peres, G., Fabbiano, G., Kim, D. W., & Bocchino, F. 2001, ApJ, 556, 47
- La Parola et al. (2002) La Parola, V., Damiani, F., Fabbiano, G. and Peres, G. 2002, ApJ, in press (astro-ph/0210174)
- Makishima et al. (2000) Makishima, K. et al. 2000, ApJ, 535, 632
- Miller et al (2002) Miller, J. M., Wijnands, R., Rodriguez-Pascual, P. M., Ferrando, P., Gaensler, B. M., Goldwurm, A., Lewin, W. H. G., and Pooley, D 2002, ApJ, 566, 358
- Misra & Sriram (2002) Misra, R. & Sriram, K. 2002, preprint (astro-ph/0210457)
- Neff & Ulvestad (2000) Neff, S. G. & Ulvestad, J. S. 2000, AJ, 120, 670
- Pringle (1997) Pringle, J. E. 1997, MNRAS, 292, 136
- Shapiro, Lightman & Eardley (1976) Shapiro, S., Lightman, A., & Eardley, D. 1976, ApJ, 204, 187
- Smith, Heindl, & Swank (2002) Smith, D. M., Heindl, W. A., & Swank, J. H. 2002, ApJ, 569, 362
- Stark et al. (1992) Stark, A. A., Gammie, C. F., Wilson, R. W., Bally, J., Linke, R. A., Heiles, C., & Hurwitz, M. 1992, ApJS, 79, 77
- Weisskopf et al. (2000) Weisskopf, M., Tananbaum, H., Van Speybroeck, L. & O’Dell, S. 2000, Proc. SPIE 4012 (astro-ph 0004127)
- Whitmore et al. (1999) Whitmore, B. C., Zhang, Q., Leitherer, C., Fall, S. M., Schweizer, F. & Miller, B. W. 1999, AJ, 118, 1551
- Zezas & Fabbiano (2002) Zezas, A. & Fabbiano 2002, ApJ, 577, 726
- Zezas et al. (2001) Zezas, A., Fabbiano, G. Rots, A. H.,& Murray, S., 2002a, ApJS, 142, 239
- Zezas et al. (2001) Zezas, A., Fabbiano, G. Rots, A. H.,& Murray, S., 2002b, ApJ, 577, 710
| OBSID | Date | Net Exposure (sec) |
|---|---|---|
| 315 | 1999-12-01 | 75,533 |
| 3040 | 2001-12-29 | 63,765 |
| 3043 | 2002-04-18 | 60,816 |
| 3042 | 2002-05-31 | 67,277 |

|
|
|
|---|---|
|