Galaxy Clustering and Galaxy Bias in a CDM Universe
Abstract
We investigate galaxy clustering and the correlations between galaxies and mass in the CDM cosmological model (inflationary cold dark matter with , , , , ), using a large, smoothed particle hydrodynamics simulation (SPH, with particles in a cube). Simulated galaxies can be unambiguously identified as clumps of stars and cold gas a few kpc to a few tens of kpc across, residing in extended halos of hot gas and dark matter; the space density of the resolved galaxy population at corresponds to that of observed galaxies with luminosity . We investigate the galaxy correlation function, the pairwise velocity dispersion and mean pairwise velocity, and the second and third moments of counts-in-cells; we also investigate the galaxy-mass correlation function and the average extended mass distributions around galaxies, both of which can be measured via galaxy-galaxy lensing. For the most part, the predicted biases between galaxies and dark matter lead to good agreement with current observations, including: (1) a nearly constant comoving correlation length from to for mass-selected galaxy samples of constant comoving space density; (2) an rms bias factor at ; (3) a scale-dependent bias on small scales that transforms the curved dark matter correlation function into a nearly power-law galaxy correlation function; (4) galaxy pairwise dispersion and hierarchical skewness ratio in good agreement with observed values, and lower than values for the dark matter by ; (5) a ratio of galaxy-galaxy to galaxy-mass correlation functions consistent with recent measurements from the Red Cluster Sequence survey; and (6) a mean excess mass approximately proportional to galaxy baryon mass , in agreement with estimates from the Sloan Digital Sky Survey (SDSS). All of these clustering properties vary with galaxy baryon mass and, more strongly, with the age of a galaxy’s stellar population. The predicted dependences are in good qualitative agreement with the observed dependence of galaxy clustering and the galaxy-mass correlation function on galaxy type. The predicted ratio is lower than the SDSS estimates by a factor of for galaxies with . A test with a higher resolution (smaller volume) simulation suggests that this discrepancy is mostly a numerical artifact; if so, then the SDSS weak lensing comparison leaves little room for feedback or other astrophysical processes to reduce the stellar masses of luminous galaxies, at least given our adopted cosmological parameters. On the whole, our results show that the CDM model and the galaxy formation physics incorporated in the SPH simulation give a good account of observed galaxy clustering, but anticipated improvements in clustering and weak lensing measurements will soon test this picture in much greater detail.
1 Introduction
The clustering of galaxies has long been an essential testing ground for cosmological models and the theory of galaxy formation, with comparisons between predicted and observed clustering driving much of the progress in cosmology during the 1970s and 1980s. Such comparisons provided early support for gravitational instability as the central mechanism of structure formation (e.g., Davis, Groth, & Peebles, 1977), for initial conditions with a power spectrum redder than white noise (e.g., Gott & Rees, 1975; Gott & Turner, 1977), for a “bottom up” rather than “top down” sequence of gravitational clustering (e.g., White, Frenk, & Davis, 1983; Davis et al., 1985; Fry & Melott, 1985), for an approximately Gaussian distribution of primordial fluctuations (e.g., Gott et al., 1989; Weinberg & Cole, 1992; Bouchet et al., 1993), and for a power spectrum significantly redder than that predicted by the “standard” (, ) cold dark matter scenario (e.g., Efstathiou et al., 1990; Maddox et al., 1990; Park et al., 1994). The growth of galaxy redshift surveys has led to measurements of increasing precision and detail, and cosmological N-body simulations have developed into a powerful tool for calculating the gravitational clustering of collisionless dark matter from specified initial conditions. The main obstacle to drawing stronger inferences from the data is the dependence of theoretical predictions on both the relatively straightforward physics of gravitational clustering, which largely determines the distribution of dark matter, and the more complex physics of galaxy formation, which determines the relation between galaxies and mass, often referred to generically as “bias.”
In this paper, we study galaxy clustering and galaxy bias in a large ( particles, cube), smoothed particle hydrodynamics (SPH) simulation of a low density, inflationary cold dark matter universe with a cosmological constant (CDM). Our goals are, first, to see whether the currently leading cosmological model and “standard” galaxy formation physics as incarnated in our SPH simulation can reproduce existing observations, and, second, to give guidance for the physical interpretation of those observations and for the design of more demanding tests of the theoretical predictions. The N-body+hydro approach to ab initio predictions of galaxy bias has a substantial history, beginning with dissipative “sticky particle” simulations by Carlberg & Couchman (1989) and continuing in the early 1990s with simulations using SPH (Katz, Hernquist, & Weinberg, 1992; Evrard, Summers, & Davis, 1994) or Eulerian grid hydrodynamics (Cen & Ostriker, 1992) to model galaxy formation in a representative (but small) cosmological volume. The present paper is a direct descendant of Katz et al. (1992), but we study a different cosmological model, we incorporate improvements to the physical treatment of radiative cooling and star formation (Katz, Weinberg & Hernquist, 1996, hereafter KWH), and, above all, we take advantage of the parallel implementation of TreeSPH (Davé, Dubinski, & Hernquist, 1997) and advances in computer technology to simulate a volume more than 90 times larger than that of Katz et al. (1992), at similar resolution. Our analysis overlaps significantly with other recent studies using large volume SPH (Pearce et al., 1999, 2001; Yoshikawa et al., 2001) or Eulerian hydrodynamics (Cen & Ostriker, 2000) simulations. Relative to these investigations, we have higher mass and/or spatial resolution and a somewhat smaller simulation volume, as discussed in §2 below.
Two other approaches to ab initio predictions of bias have gained currency in recent years: high-resolution, collisionless N-body simulations that identify galaxies with “subhalos” in the dark matter distribution (e.g., Colín et al., 1999; Kravtsov & Klypin, 1999), and a hybrid method that combines N-body simulations of the dark matter component with semi-analytic treatments of the galaxy formation physics (e.g., Kauffmann, Nusser, & Steinmetz, 1997; Governato et al., 1998; Kauffman et al., 1999a, b; Benson et al., 2000a, b, 2001; Hatton et al., 2002). We will discuss comparisons of our results to those from other hydrodynamic simulations and from the high-resolution N-body and hybrid approaches as they arise. We carry out a detailed comparison between our simulation and the semi-analytic model of Benson et al. (2000a) in a separate paper that focuses on the “halo occupation distribution” (HOD) predicted by the two methods (Berlind et al., 2002). The HOD description can be used to calculate many different galaxy clustering statistics, and it helps explain the origin of bias in a physically intuitive manner (see Berlind & Weinberg 2002 and references therein). Based on this comparison, we conclude that our SPH approach and Benson et al.’s (2000a) semi-analytic method should yield similar predictions for most galaxy clustering statistics.
Here we focus mainly on the “classic” measurements of galaxy clustering — the two-point correlation function, variance of galaxy counts, and pairwise velocity moments — and on one of the simplest measures of higher-order clustering, the third moment of counts-in-cells. Large redshift surveys like the 2dF Galaxy Redshift Survey (2dFGRS) and the Sloan Digital Sky Survey (SDSS) now allow precise measurements of these quantities for multiple classes of galaxies, defined by luminosity, color, morphology, or spectral type (see, e.g., Norberg et al. 2001, 2002b; Zehavi et al. 2002, and references therein). While we cannot model these variations with galaxy type in detail — our simulation volume is far smaller than these surveys, and we do not resolve the morphology of the simulated galaxies — we can examine the predicted trends of clustering with baryon mass, stellar population age, and local environment. We concentrate on present-day clustering, but we also compute the evolution of the two-point function, which can be compared to results from deep redshift surveys and to studies of Lyman-break galaxies at (e.g., Adelberger et al., 1998, 2002). The discovery that the clustering of Lyman-break galaxies is similar to that of galaxies at , despite the weaker expected clustering of the underlying mass distribution, provides strong evidence that the bright galaxy population was highly biased at , even if galaxies roughly trace mass today.
Galaxy-galaxy weak lensing is an important new observational probe of the relation between galaxies and dark matter, measuring the galaxy-mass cross-correlation function and the extended mass distributions around galaxies of different types and in different environments. We will devote considerable attention to modeling recent observations of this phenomenon. The closest similar efforts are those of White, Hernquist, & Springel (2001), who present predictions from a hydrodynamic simulation at and , and Guzik & Seljak (2001) and Yang et al. (2002), who analyze the N-body+semi-analytic galaxy distribution of Kauffman et al. (1999a).
One strength of the hydrodynamic simulation approach is that it predicts properties of the intergalactic medium (IGM) in addition to the galaxy population. We have used the simulation analyzed here to model the phase distribution of baryons in the present day universe (Davé et al., 2001), the X-ray background (Croft et al., 2001), X-ray emission from galaxy groups (Davé, Katz, & Weinberg, 2002), and X-ray absorption by the diffuse IGM (Chen et al., 2002). In combination with other simulations, we have used it to study cooling radiation and sub-millimeter emission from young galaxies (Fardal et al. 2001, 2002), the relative importance of mergers and smooth accretion in galaxy assembly (Murali et al., 2002), and the correlations between galaxies and the Ly forest at high redshift (Kollmeier et al., 2002). The observed distributions and correlations of galaxy properties, in particular the luminosity function and the Tully-Fisher (1977) relation, are also essential tests of the galaxy formation model, and any discrepancies with these observations can provide insight into the model’s failings. We will consider these characteristics of the galaxy population in a separate paper (Katz et al., in preparation), though the comparison to observed galaxy-galaxy lensing measurements will bring up some of the same issues here. We proceed to a description of our numerical methods in §2, to predictions of galaxy clustering in §3, and to the galaxy-mass correlation function and comparison to lensing measurements in §4. We recap our findings and discuss their implications in §5.
2 Simulating Galaxy Formation
2.1 Simulation
We employ a hydrodynamic simulation of a CDM model with , , , , inflationary spectral index , and a power spectrum normalization . This model is consistent with most available observational constraints (Bahcall et al., 1999; Jaffe et al., 2001), including COBE normalization (Bennett et al., 1996), cluster masses (Eke, Cole, & Frenk, 1996), cosmic shear (Hoekstra, Yee, & Gladders 2002, and references therein), the deuterium abundance in high-redshift Lyman limit systems (Tytler, Fan, & Burles, 1996; Burles & Tytler, 1997, 1998), the Hubble diagram of Type Ia supernovae (Riess et al., 1998; Perlmutter et al., 1999), and the flux power spectrum of the Ly forest (Croft et al., 1999, 2002; McDonald et al., 2000).
Our initial conditions represent a random (comoving) cube, realized with gas and dark matter particles in a triply periodic volume, yielding particle masses of and , respectively. These initial conditions are evolved from redshift using Parallel TreeSPH (Davé, Dubinski, & Hernquist, 1997). We soften the gravitational force via a (comoving) spline kernel, equivalent to a Plummer softening of . For particle timesteps we use the criteria described by KWH and Quinn et al. (1997), setting the tolerance parameter (defined in these papers) to 0.4. The simulation was evolved to on the Cray T3E at SDSC and finished on the SGI Origin 2000 at NCSA.
We include radiative cooling for primordial composition gas as described by KWH. The tests in Weinberg et al. (1997) show that photoheating by an ionizing background artificially suppresses the formation of low mass galaxies in a simulation of this resolution, but that a simulation evolved without an ionizing background produces much the same galaxy population (above its resolution limit) as a higher resolution simulation with an ionizing background. Though Weinberg et al. (1997) considered an CDM model rather than CDM, we expect their conclusions to carry over to this model, and we therefore evolve the simulation with no ionizing background.
We incorporate star formation using the algorithm described and tested by KWH. This algorithm converts cold, dense gas into collisionless stars at a rate governed by the local dynamical and cooling timescales, returning supernova feedback as thermal energy to the surrounding medium. The tests in KWH and Weinberg et al. (1997) show that the resulting galaxy population is insensitive to the one free parameter of the algorithm and is similar to that identified using cold gas in a simulation without star formation; it is gravity, gas dynamics, and radiative cooling that determine where galaxies form and how massive they will be. A radical change to the star formation or feedback algorithm might alter the galaxy population in a significant way, but provided that it gave the same relative masses and ages of the galaxies (more precisely, that it preserved their rank order), it would not affect the clustering results presented here, except for the absolute values of mass-to-light ratios discussed in §4.
Our numerical approach is similar to those used by Pearce et al. (1999, 2001) and Yoshikawa et al. (2001), but we have opted for a somewhat smaller volume and larger particle number, and consequently higher resolution. Pearce et al. use particles in a cube, so our mass resolution is higher by (though the ratio of SPH particle masses is only 2.9 because Pearce et al. use a lower value of ). The gravitational softening of the Pearce et al. simulation is similar to ours at ( vs. our ), but larger at higher redshift, since they keep the softening fixed in physical coordinates at . The mass resolution of the Yoshikawa et al. (2001) simulation is similar to that of Pearce et al. ( particles in a cube), and the (Plummer equivalent) gravitational softening is , constant in comoving coordinates. The most important methodological difference is that we convert cold gas into collisionless stars, while Pearce et al. and Yoshikawa et al. “decouple” cold gas from hot gas when computing SPH densities but leave the cold gas subject to SPH forces and dissipation. Despite the differences in numerical resolution, input physics, and implementation details, we find quite good agreement with these previous investigations where our results overlap, as discussed in §3. The cosmological parameters of the three CDM simulations are similar but not identical. (Pearce et al. investigate an model in addition to CDM.)
Cen & Ostriker (2000) have investigated galaxy clustering and bias in the CDM model with a Eulerian mesh simulation of a volume. The initial mass resolution of this simulation is higher than ours, but the force resolution is much lower, with individual mesh cells . Because the simulation does not track individual galaxies within high density regions, Cen & Ostriker examine stellar mass weighted clustering statistics rather than the galaxy number weighted statistics that we investigate here. Nonetheless, our conclusions about galaxy bias on the scales resolved by the Cen & Ostriker simulation are qualitatively similar, as discussed in §3.
2.2 Galaxy Identification
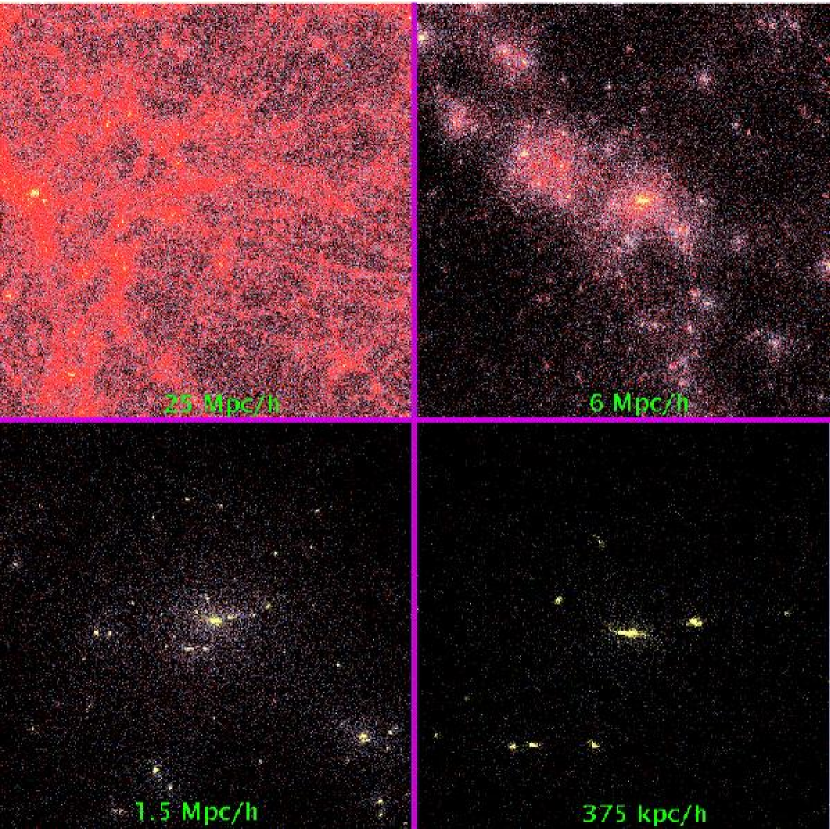
Figure 1 illustrates the state of the simulation at , showing dark matter, gas, and star particles projected through the entire volume in a quarter of the box, and in expanded views 6, 1.5, and 0.375 on a side centered on the most massive system in our volume. The star particles are clumped into groups of extremely high overdensity, from a few kpc to a few tens of kpc across. Dark halos with the mass scale of galaxy groups and clusters contain many such dense clumps in addition to a smooth distribution of hot gas. Figure 1 shows that there is virtually no ambiguity in identifying the galaxies in this simulation; one simply needs an automated algorithm that picks out the distinct clumps of stars and cold gas. The algorithm that we use is Spline Kernel Interpolative DENMAX 111http://www-hpcc.astro.washington.edu/tools/SKID/ (SKID), which selects gravitationally bound groups of particles that are associated with a common local density maximum (see KWH). SKID selects essentially the same population of objects that one would pick out by eye from a representation like Figure 1.

Figure 2 shows the baryonic mass function of the simulated galaxy population at , 1, and 0, where represents the total mass of a galaxy’s stars and associated cold (K) gas. The number of galaxies steadily increases with time, though the rate of new galaxies forming is dramatically slower for than for . We will discuss the luminosity function and Tully-Fisher relation in a separate paper (Katz et al., in preparation), and we have elsewhere compared predictions of the luminosity function from higher resolution simulations (of smaller volumes) to measurements of the Lyman-break galaxy population (Weinberg et al. 1999, 2002). The dashed vertical line in Figure 2 marks the mass of 60 SPH particles, and all of the simulated mass functions turn over shortly below this threshold. Our tests using a suite of simulations of different resolution show that galaxies below this threshold have underestimated masses or may be missed entirely, while the masses and locations of galaxies above this threshold are generally robust (see Weinberg et al. 1999). The dotted line shows the mass function at from a higher resolution (, ), smaller volume ( cube) simulation having particles and the same cosmological parameters, analyzed in the same way; a comparison with the solid line clearly shows that the turnover below the demarcated mass limit is due to numerical effects. We therefore adopt a baryon mass of as our completeness limit, and we analyze the clustering only of galaxies above this threshold. Note that the mass function comparison also suggests that the lower resolution simulation may overestimate the baryon masses of the largest galaxies, a point that we will return to in §4.
Out of 4632 total SKID-identified galaxies at , 2571 satisfy our completeness criterion. At and 4, the corresponding fractions are 2011/4012, 1034/2488, 420/1177, and 104/384. The sample of all galaxies with will be referred to as our “complete sample” of galaxies. At , the space density of the complete sample, , corresponds to that of observed galaxies brighter than about (Blanton et al., 2001), where is the characteristic luminosity of the Schechter (1976) function fit.
3 Galaxy Clustering
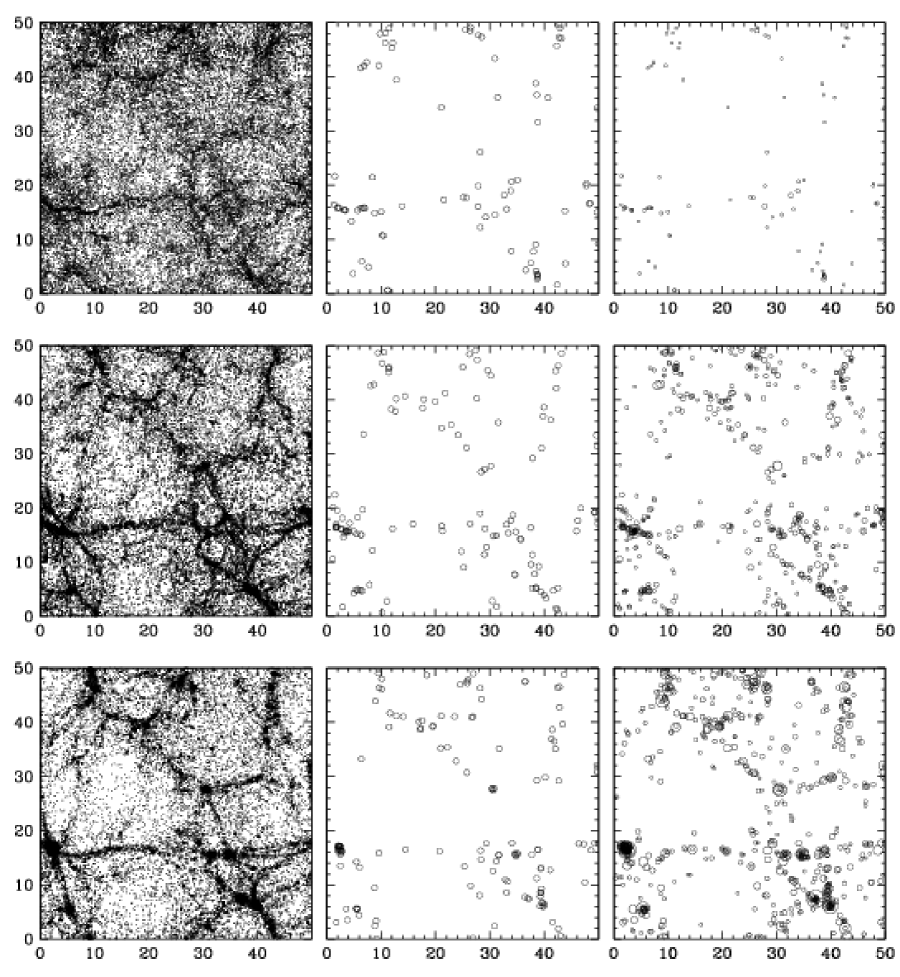
Figure 3 illustrates the evolution of structure in a thick slice of the simulation volume, running from (top) to (middle) to (bottom). The left hand panels show the dark matter distribution, which exhibits the usual behavior seen in N-body simulations: a steady increase of contrast between growing filaments and emptying voids, and fragmentation of filaments into increasingly massive clumps. The middle column shows the clustering of a subset of galaxies with nearly constant comoving space density, namely the 420 resolved galaxies at and the 500 most massive galaxies at and . We will refer to this subset below as our “ sample.” The evolution of galaxy clustering is markedly different from that of the dark matter. The network of filaments and voids is already present at , with nearly the full contrast that it achieves by . The principal change in the clustering of this sample is on small scales, with the collapse of some extended structures into tight clumps.
The right column of Figure 3 shows the full resolved galaxy population at the three redshifts, with a point size that reflects the galaxy baryon mass. Here one can see the increase in the number of resolved galaxies (from 420 to 2011 to 2571), the growth in the average mass of these galaxies, and the preferential location of the most massive galaxies in dense systems at . The changing number density and size of points makes it difficult to gauge the evolution of clustering strength visually, but we will see below that the correlation function of this complete galaxy sample stays nearly constant from to .
3.1 The Two-Point Correlation Function
| Survey | Reference | ||
|---|---|---|---|
| All Simulated | |||
| Simulated | |||
| 200 Most Massive | |||
| Stromlo-APM | Loveday et al. (1995) | ||
| CfA2/SSRS2aaBased on figure 3 of the Marzke et al. (1995) analysis of CfA2 and SSRS2. | 5.8 | 1.8 | Marzke et al. (1995) |
| LCRS | Jing, Mo & Börner (1998) | ||
| Durham/UKST | Ratcliffe et al. (1998) | ||
| ESP | Guzzo et al. (2000) | ||
| 2dFGRSbbWe quote values for the volume-limited sub-sample with , close to the value of found by Norberg et al. (2002a) for the 2dFGRS. | Norberg et al. (2001) | ||
| SDSSccWe quote values for the full flux-limited sample. For a volume limited sample with , close to the Blanton et al. (2001) value of for the SDSS, Zehavi et al. (2002) find and . | Zehavi et al. (2002) | ||
| PSCzddNote that these are IRAS-selected galaxies and therefore preferentially late types. | Jing, Börner, & Suto (2002) |
The two-point correlation function is the most well studied measure of galaxy clustering, in part because it is relatively straightforward to estimate from angular or redshift survey data, in part because it contains complete statistical information on fluctuations in the linear regime if these fluctuations are Gaussian, and, perhaps most of all, because its observed form is remarkably simple. For most galaxy samples, the correlation function is well described by a power law,
| (1) |
on scales (Totsuji & Kihara, 1969; Peebles, 1974; Gott & Turner, 1979). However, the values of and, to a lesser extent, , depend on the luminosity, color, and type of the sample galaxies (e.g., Guzzo et al. 1997; Norberg et al. 2001, 2002b; Zehavi et al. 2002, and numerous references therein). We list determinations of and from a number of recent redshift surveys in Table 1. While the varying values of and partly reflect statistical uncertainties, they arise mainly from the different selection criteria of the samples from which they are measured. In most cases, the values quoted in Table 1 are derived from flux-limited galaxy samples, and the weighting of galaxies of different luminosities depends on the specific procedure adopted for estimating . The quoted values for the 2dFGRS are derived from a volume-limited sample of galaxies with absolute magnitudes close to the characteristic magnitude obtained for 2dFGRS galaxies. The quoted values for the SDSS are from a flux-limited sample, but they are similar to those obtained for a volume-limited sample with absolute magnitudes close to . The difference between the 2dFGRS and SDSS correlation lengths, vs. (or for the volume-limited sample) presumably reflects the difference between blue and red selection.
Early N-body simulations showed that gravitational clustering produces an approximate power-law , especially if the initial power spectrum has a slope (Gott, Turner, & Aarseth, 1979). However, the much higher precision correlation functions calculated with modern simulations show significant departures from a power-law for CDM or power-law initial spectra (e.g., Jenkins et al. 1998 and references therein). The origin of these departures can be understood in analytic models of matter clustering (Hamilton et al., 1991; Peacock & Dodds, 1996; Ma & Fry, 2000; Seljak, 2000; Scoccimarro et al., 2001). Thus, the observed power-law form of requires either special features in the primordial power spectrum or scale-dependent bias between the galaxy and dark matter correlation functions at the present day.

Figure 4 illustrates the evolution of in our simulation from to . The top panel shows results for the complete galaxy sample, i.e., all galaxies above our resolution threshold at the corresponding redshift, corresponding to the right hand column of Figure 3. As noted in §2.2, there are 420, 1034, 2011, and 2571 galaxies satisfying this criterion at , 2, 1, and 0, respectively. Since the strength of galaxy clustering depends on mass (see §3.2 below), it is useful to identify samples of specified space density for comparison to observations. The middle panel shows results for the 500 most massive galaxies present at each redshift (except at , where it contains only the 420 galaxies above the resolution threshold). The ranking of each galaxy is based on its total mass of stars and cold (K) gas. The comoving space density of this sample, , is similar to that of galaxies today (Blanton et al., 2001) and similar to (but slightly higher than) the space density of Lyman-break galaxies in the spectroscopic samples of Adelberger et al. (1998). We therefore refer to this as our “-sample,” illustrated by the middle column of Figure 3. At , the baryon mass threshold for this sample is . The bottom panel of Figure 4 shows the dark matter .
In each panel of Figure 4, we show as a reference the power-law fit to the SDSS correlation function found by Zehavi et al. (2002). Comparison of our predictions to results from a flux-selected observational sample rests on the implicit assumption that the luminosity of a galaxy is an approximately monotonic function of its mass, and we use the SDSS result in preference to the 2dFGRS result of Norberg et al. (2001) because this assumption seems more applicable to the -band selection used in the SDSS. Lyman-break galaxy samples at are selected in the rest-frame UV, where the instantaneous star formation rate is more important than the stellar mass in determining galaxy luminosity; however, in our simulations, these star formation rates are fairly well correlated (though not perfectly so) with baryon mass (Weinberg et al., 2002).
The main source of statistical error in our predictions is the finite number of coherent structures present in our simulation volume. We estimate the error bars on the correlation function and on other statistical quantities that we compute later by applying jackknife resampling to the eight octants of the simulation cube. Specifically, we create eight jackknife subsamples by deleting each of the eight octants of the cube in turn, and we estimate for each subsample; to avoid boundary effects that would complicate estimation and reduce our effective volume, we identify pairs using the full periodic cube and assign each pair to an octant based on the position of one of its particles. The error bar assigned to the value of at is
| (2) |
where is the estimate in subsample , is the estimate from the full cube, and . This approach is similar to using the dispersion among the values of from the eight octants (in which case one would divide by to get the error on the mean), but it is more robust because each of the subsamples is closer in size to the full sample. Zehavi et al. (2002) use this method to estimate statistical errors on the observed correlation functions of SDSS galaxies. The jackknife error estimates automatically incorporate the contribution from galaxy shot noise in addition to the finite number of structures, but the latter usually dominates by a large factor over the former (which would be represented by “Poisson error bars”).
The striking difference between the evolution of galaxy and dark matter correlation functions in Figure 4 is similar to that found in previous studies based on hydrodynamic simulations, semi-analytic calculations of galaxy formation, and high-resolution N-body simulations that identify galaxies as “sub-halos” within larger virialized objects (Katz, Hernquist, & Weinberg, 1999; Colín et al., 1999; Kauffman et al., 1999b; Cen & Ostriker, 2000; Benson et al., 2001; Pearce et al., 2001; Somerville et al., 2001; Yoshikawa et al., 2001). As Figure 3 shows, galaxies (at least those massive enough to be resolved by our simulation) form at special locations in the density field, and at high redshift they already trace out the network of filaments nascent in the dark matter distribution. The dark matter correlation function grows in time as mass moves into this network from the surrounding regions, but the structure traced by galaxies stays relatively unchanged, and the galaxy correlation function is only weakly dependent on redshift.


Figure 5 quantifies these points in terms of the parameters and , which we determine from power-law fits to the correlation functions over the full range plotted in Figure 4, . (Note that our figures plot the point for each radial separation bin at the computed mean separation of pairs in that bin.) For some sparse, high-redshift samples, the smallest radial bins have no pairs, in which we case we start the fit at slightly larger . We use the jackknife error bars on the points to weight the fit and determine its statistical errors. We do not incorporate the covariance of the errors; in principle, we could estimate the full error covariance matrix by the jackknife method, but in practice such estimates are noisy and not easy to use. Treating the errors as independent causes us to underestimate the statistical uncertainty in . The dark matter correlation functions are not well described by a power law at , where the fits have d.o.f. of , so the derived values of and are sensitive to the radial range selected for the fit. Power-law fits to the galaxy correlation functions are nearly always adequate, and they usually have d.o.f. less than one () because we have ignored the covariance of the errors in .
Figure 5 shows steady growth of the comoving correlation length of the dark matter, as expected. The correlation length of the complete galaxy sample, on the other hand, starts at at , declines to a minimum of at , and climbs again to by . The sample has a higher correlation length than the complete sample at , , though the correlation lengths of the two samples converge at higher redshift as the threshold approaches our completeness threshold. Correlation lengths for a sample with a higher mass threshold, the 200 most massive galaxies at each redshift, are higher still, at , with only a slight decline towards higher redshift. The values of for the galaxy correlation functions range from 1.75 to 2.05, with a tendency for larger for the more massive galaxy samples or at higher redshifts. At high redshift, the dark matter correlation function is close to a power law, but a quite shallow one. As the scale of non-linear structure grows, it produces a “bulge” in the dark matter (see Fig. 4), which drives the correlation function away from a power law and steepens the effective value of .
The slow evolution of the galaxy correlation length in Figure 5 agrees with results from the KPNO wide-area survey (Postman et al., 1998), which yields (comoving) at , and from the CNOC-2 redshift survey, which shows little evolution of the comoving out to (Carlberg et al., 1999). However, the value of depends significantly on galaxy mass and age (see Figure 7 below), so caution is required when interpreting results of surveys that may select different types of galaxies at different redshifts. The predicted correlation length at , , agrees very well with the value measured from spectroscopic samples of Lyman-break galaxies (Adelberger et al. 2002; we have transformed from their cosmology to our cosmology using the ratio of angular diameter distances at ), though the slope is steeper than the observed value of . Similar values of for Lyman-break galaxies have been obtained using semi-analytic galaxy formation models (Governato et al., 1998; Kauffman et al., 1999b; Benson et al., 2001; Somerville et al., 2001) and other hydrodynamic simulations (Cen & Ostriker, 2000; Pearce et al., 2001; Yoshikawa et al., 2001). The value of from our simulation is somewhat larger than the estimate (including a factor 2.2 correction for finite box size effects) derived by Katz, Hernquist, & Weinberg (1999) from a simulation of an cube, but a difference of this sort is expected because the mass resolution threshold of our present simulation is a factor of eight higher, and correlation strength increases with galaxy mass.
Perhaps the most significant result of this section is the power-law form of the galaxy correlation function at . The dark matter correlation function shows the curvature found in previous N-body studies (e.g., Jenkins et al. 1998), and it is inconsistent with a pure power law. We demonstrate this point explicitly in Figure 6, where we plot the ratio of the dark matter, complete galaxy, and -galaxy correlation functions to a power law that has the observed logarithmic slope. The dark matter correlation function rises above this power law at and falls well below it at . (The departure from a power law is somewhat less prominent than that in Jenkins et al.’s [1998] CDM simulation because we adopt and instead of and .) The correlation function of the complete sample, on the other hand, follows the power law almost perfectly. The situation for the sample is less clear; here shows a rise at reminiscent of that shown by the dark matter, but within our statistical errors, the is adequately described by a power law with .
The correlation length of the sample, , is smaller than the SDSS value of , and slightly below the value found for blue-selected galaxies in the 2dFGRS. The slope is steeper than the observed value of . The low amplitude appears to be partly an artifact of the particular realization of CDM initial conditions in our simulation volume. We have run particle-mesh N-body simulations (using the code of Park [1990]) of these initial conditions and of four equivalent volumes with different random realizations, and we find that the dark matter correlation length of this realization is a factor of 1.2 lower than that derived from the average correlation function of the other four realizations ( vs. ), simply by chance. There is also a systematic effect of missing power on scales larger than . With PM simulations of volumes, we find a further increase in the mean by a factor of 1.1, and a slightly shallower slope ( over the range , vs. for the realization of the SPH simulation). Unfortunately, we do not know just how these differences in the dark matter translate to the galaxy , but the statistical and systematic effects in our volume are large enough that we do not presently regard the quantitative discrepancies between the predicted and observed for galaxies as significant. The statistical uncertainties can be reduced by using the halo occupation distribution derived from the SPH simulation to populate a larger volume N-body simulation, as discussed by Berlind et al. (2002).
Berlind & Weinberg (2002) show that the key requirements for obtaining a power-law in a CDM model are reducing the efficiency of galaxy formation in the most massive (group and cluster scale) halos and suppressing pair counts in the lowest mass halos by keeping fluctuations about the mean occupation number well below the Poisson level (see also Jing, Mo & Börner 1998; Seljak 2000; Peacock & Smith 2000; Scoccimarro et al. 2001). The galaxy population in our simulation satisfies both of these requirements, a point that we discuss in detail elsewhere (Berlind et al., 2002). Our conclusion that including galaxy formation physics removes most of the discrepancy between the predicted correlation function of dark matter and the observed correlation function of galaxies agrees with conclusions derived from other studies based on semi-analytic modeling (Kauffman et al., 1999a; Benson et al., 2000a, b; Somerville et al., 2001), high resolution N-body simulations (Colín et al., 1999), and numerical hydrodynamics (Pearce et al., 1999, 2001; Cen & Ostriker, 2000; Yoshikawa et al., 2001).
3.2 Correlation Functions of Sub-populations
| Subsample | ||
|---|---|---|
| All | ||
| Old | ||
| Young | ||
| High mass | ||
| Low mass | ||
| High density | ||
| Low density |

As mentioned in §3.1, the galaxy correlation function is known to vary significantly with galaxy luminosity, color, and morphology (e.g., Davis & Geller 1976; Hamilton 1988; Loveday et al. 1995; Guzzo et al. 1997; Willmer, da Costa & Pellegrini 1998). The most comprehensive recent examinations are the studies of luminosity and color dependence for SDSS galaxies by Zehavi et al. (2002) and the studies of luminosity and spectral type dependence for 2dFGRS galaxies by Norberg et al. (2001, 2002b). Zehavi et al. (2002) find a steady increase of correlation amplitude with luminosity, going from magnitudes fainter than to magnitudes brighter, and they find that red galaxies have a higher amplitude and steeper correlation function than blue galaxies, in agreement with earlier studies of the difference between clustering of early type (red) and late type (blue) samples. Norberg et al. (2001) find a somewhat different luminosity dependence for the -selected 2dFGRS galaxies, with little dependence of clustering amplitude on luminosity below but a strong dependence at higher luminosities. Norberg et al. (2002b) find that the correlation amplitude varies strongly with galaxy spectral type, analogous to the usual dependence on morphological type, and that the luminosity dependence is present within each spectral type class. Galaxies with early spectral types have a somewhat steeper correlation function than those with late spectral types, though the difference in slope is not as striking as that for the SDSS red and blue galaxy samples.
Our simulation volume is too small and our computation of galaxy properties too simple to allow detailed comparisons to these observations, but we can examine qualitative trends. The color and spectral type of a galaxy depends largely on the age of its stellar population, and morphology is also known to correlate strongly with population age. For our simulated galaxy population, we define a galaxy’s age by the epoch at which it formed half of its stars. While this approach necessarily brings our heuristic star formation algorithm into play, the details of this algorithm should have little effect on the conclusions presented here, since we will use only the relative ages of the simulated galaxies.
Figure 7a shows the correlation functions of the older (dashed line) and younger (dotted line) halves of the complete galaxy sample, compared to the correlation function of the complete sample (solid line). The correlation amplitude exhibits a clear dependence on galaxy age; the older galaxies have a correlation length of and the younger galaxies have . The fitted slopes of the correlation functions are nearly identical, and 1.82, respectively. (Values of and for all sub-populations appear in Table 2.) These results are in good qualitative agreement with the spectral type dependence found by 2dFGRS; relative to the SDSS results, they reproduce the observed color dependence of correlation amplitude but not the observed change of slope.
Figure 7b compares the correlation functions of the more massive (dashed) and less massive (dotted) halves of the complete sample. While the more massive galaxies have a higher at all separations, the difference is marked only below . Power-law fits yield nearly identical correlation lengths, , but significantly different slopes ( vs. ). Table 1 shows that does rise significantly if one takes the 500 most massive () or 200 most massive () galaxies, and in combination with Figure 7b it suggests that this mass dependence sets in at roughly the space density of galaxies. The 2dFGRS results show a transition of this sort (Norberg et al., 2001), though the SDSS results show a steadier dependence of clustering amplitude on luminosity (Zehavi et al., 2002).
Figure 7c shows the effect of dividing the galaxy sample based on local density, computed by smoothing with a spline kernel (the same form used in the SPH calculation) whose radius is adjusted to always enclose 16 galaxies within the smoothing volume. Since is itself a measure of overdensity at radius , it is no surprise that this division produces the most marked change in the correlation function. The enhancement of persists to scales much larger than the typical smoothing radius because of the bias of locally dense regions towards overdense large scale environments (Kaiser 1984; see Mann, Peacock, & Heavens 1998 and Narayanan, Berlind, & Weinberg 2000 for discussions in the context of N-body models). The observed dependence of galaxy morphology on local density (e.g., Dressler 1980; Postman & Geller 1984) should therefore lead to a large scale bias in the clustering of early-type galaxies.
To summarize the results of this and the previous section, we find that our simulated galaxy population reproduces many of the features of observed galaxy correlation functions: a power-law form with down to separations , an increase of correlation strength with mass that becomes more pronounced at high masses, and a higher correlation amplitude for galaxies with older stellar populations. The trends of clustering strength with galaxy mass and age agree with the predictions from semi-analytic models (Kauffman et al., 1999a; Benson et al., 2000a; Somerville et al., 2001) and other hydrodynamic simulations (Cen & Ostriker, 2000; Pearce et al., 2001; Yoshikawa et al., 2001). The predicted correlation lengths are somewhat low and the slope for galaxies slightly too steep in comparison to the SDSS results, but our N-body experiments suggest that these discrepancies are largely explained by the truncation of power at the scale of our box and by a lower than average clustering amplitude in the particular CDM initial conditions used in our simulation.
3.3 Pairwise Velocities

Peebles (1980), Davis & Peebles (1983), and Bean et al. (1983) describe the techniques now commonly used in correlation function analyses of galaxy redshift surveys. Starting from , the correlation as a function of projected and line-of-sight separations, one integrates over to obtain the projected correlation function , which can be easily inverted to obtain the real space 3-d correlation function . The full can be calculated, approximately, by a convolution of with the galaxy pairwise velocity distribution (see Fisher [1995] for a careful discussion of this approximation and its relation to the linear theory approximation of Kaiser [1987] and Hamilton [1992]). This distribution is specified by its first and second moments and , and by a functional form, usually assumed (on both theoretical and observational grounds) to be exponential. The pairwise dispersion can be inferred from in a fairly robust fashion, though it is sensitive to the presence of rare, rich clusters in the survey volume (Mo, Jing, & Börner, 1993). The mean pairwise velocity can in principle be deduced as well, given sufficiently good data (see, for example, the analysis of Fisher et al. 1994); at larger separations, it can also be measured directly in galaxy peculiar velocity surveys (Ferreira et al., 1999).
Figure 8 shows the mean pairwise velocity (top) and pairwise velocity dispersion (bottom) at (left) and (right). At , the mean pairwise velocity of the galaxies is higher than that of the dark matter, at all separations . Although galaxies and dark matter feel the same gravitational forces and therefore have similar large scale velocity fields, pair-weighted statistics like and are also sensitive to spatial bias; in this case, the preferential location of galaxies in overdense regions with high inflow velocities boosts . The mean pairwise velocities of the sample are higher than those of the complete sample, but the difference is of marginal statistical significance.
By (top left), the bias of the galaxy mean pairwise velocities has largely disappeared, in correspondence with the small spatial bias at (see Figure 4, and Figure 9 below). The complete and galaxy samples again exhibit similar , with velocities of the sample being slightly higher. There is a much sharper difference, however, between the older and younger halves of the complete sample (circles and squares in Figure 8), with the older galaxies having nearly twice the value of on scales of one to several . This difference reflects the preference of older galaxies for denser environments with larger inflow velocities.
The pairwise dispersion of the complete galaxy sample is below that of the dark matter both at and at . The sample’s pairwise dispersion is similar to that of the dark matter at and below it at . All of the galaxy samples show a peak in at , roughly the half-mass radius of the richest groups. While one might expect suppression of the galaxy pairwise dispersion to go hand-in-hand with spatial anti-bias, our results show that the story is not so simple. For example, the correlation function of the sample at is positively biased at all separations (Figure 6), but its pairwise dispersion is lower than that of the dark matter and nearly identical to that of the (more weakly clustered) complete galaxy sample. As emphasized by Berlind & Weinberg (2002) and Sheth et al. (2001), the pairwise dispersion is influenced by factors that do not affect (or even affect it with opposite sign), making it sensitive to details of the relation between galaxies and their surrounding dark matter halos. While is not sensitive to galaxy baryon mass (at least in the comparison presented here), it is highly sensitive to stellar population age: the older half of the complete sample has a substantially higher pairwise dispersion than the younger half because of the location of older galaxies in more massive virialized structures.
The pairwise dispersion of the complete and galaxy samples agrees reasonably well with the values at found in the CfA2, LCRS, and SDSS redshift surveys (Marzke et al., 1995; Jing, Mo & Börner, 1998; Zehavi et al., 2002). However, the sensitivity of to rare, rich clusters is reflected in the large jackknife error bars of Figure 8, so we cannot take this agreement as a major triumph of the simulation. The scale-dependence in Figure 8 contrasts with the rather flat inferred from the observations, but for the same reason we do not view this as a serious discrepancy. We can conclude from Figure 8 that the predicted difference between dark matter and galaxy pairwise dispersions makes it easier to understand the relatively low observed value of , and that the predicted difference between old and young galaxies naturally accounts for the factor of difference in derived for red and blue galaxies in the SDSS (Zehavi et al., 2002) and the factor difference in derived from optical redshift surveys (as cited above) and from the IRAS PSCz catalog (as analyzed by Jing, Börner, & Suto 2002).
Our conclusion that the galaxy pairwise dispersion at is significantly lower than that of the dark matter agrees with the results of Pearce et al. (2001), based on a hydrodynamic simulation, and Benson et al. (2000a), based on populating N-body halos according to semi-analytic prescriptions. We also agree fairly well with these calculations in terms of the amplitude of the pairwise dispersion, at , and the shape of , though our pairwise dispersion drops somewhat more rapidly at . Kauffman et al. (1999a), also using N-body halos and semi-analytic galaxy models, find only a slight difference between the dark matter and galaxy pairwise dispersions, and their predicted amplitude at is . Benson et al. (2000a) argue that the difference between their results and Kauffmann et al.’s arises because their (Benson et al.’s) semi-analytic model places fewer galaxies in high dispersion halos. Since the halo occupation of our simulation agrees well with that of the Benson et al. (2000a) models (Berlind et al., 2002), we think that the same explanation applies to our results. We agree with Kauffman et al. (1999a) with respect to the mean pairwise velocity (not examined by the other groups), with both calculations showing little difference between the galaxies and the dark matter at . While age divisions (or color divisions) were not examined in these other studies, the tendency to find older, redder galaxies in more massive halos appears to be a generic prediction of both hydrodynamic and semi-analytic calculations, so we expect the strong age-dependence of and to be a fairly generic result.
3.4 Moments of Galaxy Counts


Moments of the galaxy count distribution in spherical (or other) cells provide an alternative to correlation functions for characterizing galaxy clustering. The -th central moment of the galaxy counts is closely related to the -point correlation function averaged over the cell volume. As pointed out by Szapudi & Szalay (1993), for a discrete galaxy distribution it is convenient to work with factorial moments such as and (where is the number of galaxies within a cell or sphere), since these automatically remove Poisson shot noise contributions and can therefore be related to the moments of an underlying continuum distribution in a straightforward way.
The ratio of rms galaxy count fluctuations to rms mass fluctuations provides a simple and robust measure of galaxy bias, and the value of for spheres of radius is the number most often quoted as the “bias factor” of the galaxy distribution. Figure 9 shows and as a function of redshift, with
| (3) |
and the moments evaluated using spheres placed randomly in the simulation volume. At the bias factors are similar for and , with for the complete galaxy sample, 1.22 for the sample, and 1.40 for the 200 most massive galaxies. Figures 5–8 show that the simulated galaxies do not trace the mass in detail and that galaxy clustering depends on age and luminosity, but our complete galaxy sample is, in an rms sense, nearly unbiased at .
As shown earlier in terms of , the galaxy bias starts high and declines with redshift as the dark matter clustering catches up. For the complete sample, at . At redshifts , the bias factor is significantly larger at than at , presumably reflecting the different behavior of in the non-linear and linear regimes. Fry (1996) discusses an analytic model in which the galaxy population is born at some redshift with a bias factor but thereafter moves with the same velocity as the dark matter and conserves number (see also Tegmark & Peebles 1998). In this case the bias factor at redshift is given by , where is the linear growth factor at redshift . Open circles in Figure 9 show the prediction of this model, normalized to the bias factor of the 500-galaxy sample at . The actual bias factor of this sample declines significantly faster than the number-conserving model predicts, even though the sample contains 500 galaxies at all redshifts, presumably because mergers drive down the number of pairs in dense regions and galaxies that form at are born in less biased environments. Somerville et al. (2001) obtain a similar result with semi-analytic modeling.
Discussions of the third moment of the count distribution often focus on the hierarchical ratio . For spherical cells and a linear power spectrum , the dark matter has to second order in perturbation theory, independent of sphere radius and power spectrum amplitude and nearly independent of (Juszkiewicz, Bouchet, & Colombi, 1993). If the galaxy density contrast is a local function of the matter density contrast, , then the relation between and (representing the galaxy and mass moments, respectively) depends on both the linear bias factor and a second bias factor that characterizes the second derivative at (Fry & Gaztañaga, 1993; Juszkiewicz et al., 1995). The behavior of and the relation between and becomes more complicated in the fully non-linear regime where second-order perturbation theory breaks down, but it remains the case that is only weakly dependent on scale and that the ratio depends on the non-linearity of the relation between galaxy and mass densities.
Figure 10 shows the hierarchical ratio defined in terms of factorial moments,
| (4) |
at . For the complete galaxy sample, for , rising to at . These values are slightly below those of the dark matter distribution. Ratios for the more massive, sample are lower still; these galaxies are more clustered in an rms sense, but they are less “skewed” in the sense measured by . As emphasized by Colombi et al. (2000), the statistical and systematic errors in measurements of from a volume this size are substantial, and our jackknife error bars are large. Thus, while the predicted value of for the complete galaxy sample agrees well with the value that Gaztañaga & Frieman (1994) infer by de-projecting the APM angular count moments, we cannot claim this as a major success. (The recent analyses of angular clustering in the SDSS by Gaztañaga [2002] and Szapudi et al. [2002] suggest that the APM numbers should be adjusted upward by .) However, the relative values of for the different populations should be more robustly predicted, and our simulation indicates that galaxies comparable to those in the complete sample should have a hierarchical ratio slightly below that of the dark matter, and that should be smaller for more massive galaxies. The most striking result in Figure 10 is the strong scale-dependence of for young galaxies, a prediction that should be testable with the SDSS and 2dFGRS surveys in the near future.
4 Galaxy-Mass Correlations
Advances in wide-field CCD imaging have opened a new window on the relation between galaxies and mass: weak lensing measurements of the galaxy-mass cross-correlation function. This statistic can be derived from galaxy-galaxy lensing analyses, which measure the mean shear profile around a sample of foreground galaxies using the tangential distortion of background galaxies (Tyson et al., 1984; Brainerd, Blandford, & Smail, 1996; dell’Antonio & Tyson, 1996; Griffiths et al., 1996; Hudson et al., 1998; Fischer et al., 2000; Hoekstra, Yee, & Gladders, 2001; McKay et al., 2001; Smith et al., 2001; Wilson et al., 2001b). Alternatively, one can correlate the mass map derived from the ellipticity correlation function of faint galaxies with the light map of brighter, foreground galaxies in the same images (Wilson, Kaiser, & Luppino, 2001a). In addition, cosmic shear measurements are beginning to yield measurements of the matter correlation function itself (for specified ), with impressively good agreement among independent surveys (see Mellier et al. 2001; Hoekstra, Yee, & Gladders 2002; and references therein), allowing for the comparison of galaxy and mass fluctuation amplitudes.

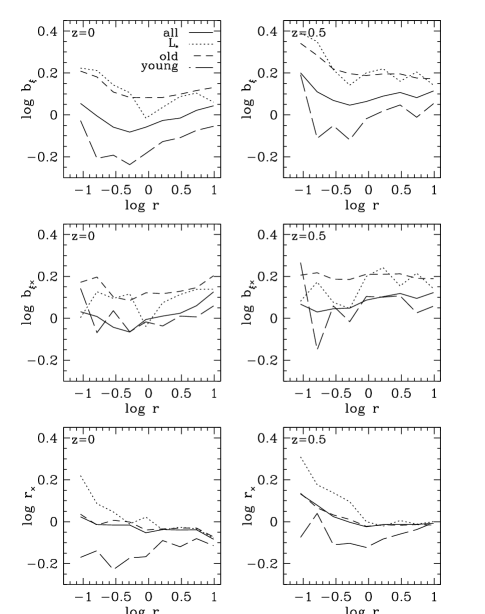
Figure 11 shows the galaxy-mass cross correlation function for the complete galaxy sample and for the subsamples divided by age (top), mass (middle), and local density (bottom). We define , where and and are the galaxy and mass (dark + baryonic) overdensities; we compute it by counting galaxy-particle pairs, with particles weighted by mass. While the form of at small is connected to the typical galaxy halo profile, the connection is rather loose because the galaxies are not isolated and the samples contain objects with a range of halo virial radii (points emphasized by Guzik & Seljak (2001), White, Hernquist, & Springel (2001), and Yang et al. (2002)). We use the same format in Figure 11 and Figure 7, and the two figures bear a striking resemblance to each other. To a first approximation, the galaxy-mass correlation function has the same shape as the galaxy-galaxy correlation function, similar amplitude, and similar dependence on galaxy age, baryon mass, and environment. However, the variations of for different subsamples are smaller than the variations of , as one would expect, given that the mass distribution stays the same regardless of the galaxy subsample.
With measurements of , , and the mass correlation function , one can define two “bias functions,” and The ratio corresponds to a “correlation coefficient” as defined by, e.g., Tegmark & Bromley (1999), though here we work in terms of correlation functions rather than power spectra. In the case of linear, deterministic bias, where at all positions , and would be equal to and independent of scale, and would equal unity. Figure 12 plots , , and for the complete galaxy sample, the sample, and the older and younger halves of the complete sample. We will focus on the results, but because measurements of these quantities come from deep imaging surveys, we also show the simulation predictions at , which are qualitatively similar.
The complete sample has , but there is a broad minimum around , with . It is precisely this mild scale-dependence of that transforms the curved dark matter correlation function into a power-law galaxy correlation function (see Figure 6). The sample has higher , roughly flat (though noisy) at , and climbing towards small . The old galaxies have similar to that of the sample, while the young galaxies have low with a scale-dependence similar to that of the complete sample.
The scale-dependence of is generally weaker than that of . At , values of are similar to those of for the corresponding sample, except in the case of the young galaxies, which have and thus . This “anti-correlation” arises because the young galaxies tend to avoid the higher mass halos, which contribute significantly to . The complete, , and old galaxy samples have at large scales and at small scales. While a correlation coefficient defined in terms of smoothed density fields, e.g. , must lie in the range , the same is not true for , which is defined by ratios of correlation functions. The high values of at small reflect the location of a significant fraction of galaxies (especially in the sample) near the central density maxima of dark matter halos. Galaxy-mass and galaxy-galaxy pairs involving these central galaxies boost and , respectively, relative to the values expected if galaxies traced mass within halos. There is no corresponding boost to , and since , it tends to rise above unity on scales where central galaxies make major contributions to the correlation functions (for related discussions, see Seljak 2000 and Berlind & Weinberg 2002).
Hoekstra, Yee, & Gladders (2001) measure a ratio of galaxy-mass and galaxy-galaxy fluctuations that is directly analogous to , though it is defined in compensated apertures rather than annuli . In our terminology, their results imply for our flat, cosmology (converted from their for using their equation 14), with no detectable scale-dependence in the range . This result is intermediate between that of our complete and galaxy samples at . (The median redshift of the Hoekstra et al. lens sample is , where the bias should be intermediate between our and values.) While we have not modeled the Hoekstra et al. procedure in detail, our prediction of a mild positive bias with no substantial scale dependence and a bias factor similar to that applying on larger scales appears to be fully compatible with their results. The approximate scale-independence of also agrees with Wilson et al.’s (2001a) finding of similar shapes for the galaxy-galaxy and galaxy-mass angular correlation functions. It is difficult for us to compare the amplitude of to Wilson et al.’s result, in part because they weight galaxies by flux, and in part because they interpret their measurement in terms of a value of assuming that their (red, luminous) lens galaxy population traces the mass. The existence of positively and negatively biased samples with approximately scale-independent in Figure 11 demonstrates that a constant ratio does not, on its own, justify this assumption.


One can also use galaxy-galaxy lensing to infer the average mass within a sphere of radius centered on a sample galaxy, an approach emphasized by McKay et al. (2001). (Note that this measurement makes no attempt to distinguish mass that “belongs” to the central galaxy from mass that “belongs” to its neighbors or to the common halo of its group or cluster; all mass counts, and it may be counted multiple times for different galaxies.) Figure 13a shows the average mass profile from to in five different bins of galaxy baryon mass, each a factor of two in width. We express the mass in terms of an equivalent circular velocity , which would be constant in the case of a singular isothermal sphere, though of course few galaxies would have any tracers in circular rotation at these large radii. We use the excess mass , subtracting the mean value , because it is the excess mass that is constrained by lensing, but the difference is negligible on the scale of these plots.
For the lowest mass galaxies, , the mean circular velocity curve is fairly flat at out to , but it rises at larger radii because these galaxies typically reside in groups whose characteristic circular velocities are larger than those of the galaxies themselves. Conversely, the highest mass galaxies have a mean circular velocity curve that falls all the way out to , because these massive galaxies typically reside at the centers of potential wells whose mass profiles (baryon + dark) are steeper than isothermal. Intermediate mass ranges have intermediate behavior, with falling profiles at small changing to flat or rising profiles at . Dashed and dotted curves show for the older and younger halves, respectively, of the sample. At small radii (), the circular velocity is the same for the two subsamples, but the preferential location of older galaxies in more massive groups manifests itself as a higher at larger radii.
Figure 13b plots the ratio of the aperture mass to galaxy baryon mass (which is approximately equal to the stellar mass), as a function of . From bottom to top, solid points connected by solid lines show results for , 100, 260, 500, and . We use rather than to facilitate comparison to McKay et al.’s (2001) analysis of galaxy-galaxy lensing in the SDSS. We average in the order appropriate for such a study, computing the mean value of the excess mass in bins of , dividing by the mean of the bin, and plotting the result for each bin at the value of the mean . Note that this ratio counts all excess mass within radius , including that associated with neighboring galaxies, but divides by the baryon mass of the central galaxy only. For the curve is essentially flat — on average, a galaxy’s baryon mass is proportional to the total mass in a sphere around it. For larger , the ratio rises towards smaller , which makes sense if the apertures around these galaxies start to include more mass that “belongs” to their richer neighbors. Dotted and dashed lines are computed for the older and younger halves of the galaxies in each bin, at . For , the older galaxies have substantially higher , by a factor , analogous to the factor difference that McKay et al. (2001) find for elliptical and spiral subsamples. At higher masses, there is little difference in age between the older and younger halves of the sample (essentially all massive galaxies are old), and the systematic difference in narrows.
Figure 14 compares our predictions to the results of McKay et al. (2001), who estimate by fitting isothermal spheres to their measured shear profiles in four wide bins of galaxy luminosity. They find that is roughly independent of galaxy luminosity in the Sloan , , , and bands. To convert to for comparison with our predictions, we draw on the results of Kauffman et al. (2002), who estimate ratios of stellar mass to observed luminosity by fitting population synthesis and dust extinction models to SDSS galaxy spectra and colors. The trend of mean stellar mass-to-light ratio with galaxy luminosity is well described by the relations , with (2.65,0.375) in , (2.29,0.375) in , (2.06,0.35) in , and (1.57,0.275) in , where , 1.51, 2.05, and in the four bands, respectively (Blanton et al. 2001, for , ).222Kauffmann et al.’s Figure 14 plots median values and interquartile ranges in bins of absolute magnitude. Since it is the mean that matters for our purposes, we have computed these means using the tabulated distributions kindly provided by G. Kauffmann, excluding the 10% tails of the distributions so that the mean is not distorted by extreme values that may be a result of poor model fits. Our conclusions would not be substantially different if we instead used the median values plotted by Kauffman et al. (2002). These relations fit the Kauffman et al. (2002) results to within for galaxies within two magnitudes of , though they break down outside of this range. We take the values of from McKay et al.’s Table 2, convert to , and divide by the value of at the central luminosity of each bin (which McKay et al. compute using the same galaxy weights that enter the lensing analysis). In Figure 13b, triangles, squares, hexagons, and circles show results derived from the , , , and band mass-to-light ratios, respectively. Results in the four bands are not independent because they rely on the same lensing data, but the generally good agreement among them suggests that there are no major systematic errors in the population synthesis and dust extinction modeling. The data points come in four groups reflecting the four luminosity bins, though the band points do not reach the highest values because of the higher in band. The solid line in Figure 14 shows the simulation result for all galaxies (same as the middle solid line of Fig. 13b).
The predicted and observationally inferred values of agree well in the lowest mass bin, but at higher masses the observational points lie above the simulation predictions, by a factor on average. We have treated our galaxies as entirely stellar, and we have ignored the light “missed” by SDSS Petrosian luminosities (see Strauss et al. 2002), but accounting for these effects would reduce the discrepancy by only . We conclude that the baryon masses of our simulated galaxies are on average too high by a factor , for , provided that the Kroupa (2002) stellar IMF assumed in Kauffmann et al.’s (2002) population synthesis modeling is indeed universal across galaxy types and evolutionary stages. Other hints of a similar discrepancy include the high overall fraction of stellar mass in the simulation (Davé et al., 2001) and the relatively high stellar mass-to-light ratios required to match the observed galaxy luminosity function (Katz et al., in preparation).
We believe that these excessive galaxy baryon masses are largely numerical in origin. A comparison of two simulations of the same volume, one with the same resolution as the simulation analyzed here and one with a mass resolution eight times higher, shows that the same galaxies are on average more massive in the lower resolution simulation, by at the completeness limit rising to a factor at masses of several (Fardal et al., in preparation; one can see hints of this effect in the mass function comparison of Figure 2). The higher baryon masses at low resolution probably arise from the overestimated cooling rate of hot gas particles in the vicinity of cold, dense clumps (Pearce et al., 1999; Croft et al., 2001). An alternative formulation of SPH that performs better in the presence of contact discontinuities between cold and hot phases indeed leads to lower galaxy baryon masses, typically by a factor (Springel & Hernquist, 2002). Empirically, we find that the relation provides a fairly accurate scaling between masses in the “low resolution” and “high resolution” simulations. The dashed curve in Figure 14 shows the effect of applying this empirical scaling. It represents our best guess at the results we would obtain from a particle simulation of the same volume. Comparison to still higher resolution simulations at suggests that this is sufficient to yield numerically converged baryon masses, but we have not yet been able to carry out such a test at .
Clearly, there are still systematic uncertainties in the observational results (the weak lensing measurements themselves and the scaling) and in the numerical convergence of the simulation predictions. However, the resolution-corrected predictions and the observationally inferred mass ratios agree well at log and 11.7, with a factor gap at the intermediate mass scale log. The sharp drop between the second and third groups of observational data points is somewhat surprising, at least given the smooth predicted trend, so a full assessment of the comparison should await improved observational estimates, which should be available soon. Nonetheless, the current level of overall agreement does not leave much room for additional astrophysical processes, such as AGN feedback or stronger stellar feedback, to substantially reduce the baryon masses of galaxies with . We would probably predict lower values of (and thus require some suppression of baryon mass) if we adopted lower or higher , without changing the assumed or shape. However, for our adopted cosmological parameters, the lensing comparison suggests that this simulation already incorporates the astrophysics needed to understand the baryon masses of luminous galaxies, within the current numerical and observational uncertainties. The constraints from galaxy-galaxy lensing complement those from the Tully-Fisher relation and the luminosity function, which we will discuss elsewhere (Katz et al., in preparation).
5 Summary and Discussion
For the full population of galaxies with , our simulation predicts a bias factor of unity at . Beneath this rms similarity of fluctuation amplitudes, however, lie numerous differences between the galaxy and dark matter distributions, in terms of present-day structure and the evolution of that structure.
1. The bias defined by rms fluctuations or by correlation functions is strongly redshift dependent. If we choose a galaxy population of fixed comoving space density (above a redshift-dependent baryon mass threshold), then the galaxy correlation function stays approximately constant from to , so that bias is initially large and declines towards unity as the dark matter catches up to the galaxies (see Figure 4).
2. The bias is scale-dependent in the non-linear regime, and this scale dependence itself depends on redshift. At , the galaxy correlation function is depressed below the dark matter correlation function at and boosted above it at . As a consequence, the galaxy correlation function is well described by a power law (of slope ), while the dark matter correlation function is not (see Figure 6). The dark matter correlation function is shallower at high redshift while the galaxy correlation function slope is roughly constant, so the rms bias factors at and start to diverge at (see Figure 9).
3. The correlation amplitude depends on galaxy baryon mass, with only a slight difference between the more and less massive halves of the complete sample (Figure 7b) but significant increases of and result if we select the 500 or 200 most massive galaxies in the simulation volume (Figures 5 and 9, Table 2).
4. The dependence of the correlation amplitude on stellar population age is more striking than the dependence on baryon mass. The correlation functions of the older and younger halves of the complete sample have almost identical slopes, but their correlation lengths differ by nearly a factor of two (Figure 7, Table 2).
5. At , the pairwise velocity dispersion of galaxies is lower than that of the dark matter, by (Figure 8). There is a large difference between the pairwise dispersions of old and young galaxies, with the preferential location of old galaxies in dense environments making about twice as high at . The mean pairwise velocity is similar for galaxies and dark matter at , but the denser environments of older galaxies again cause a higher . At , the positive spatial bias of the galaxy population makes the mean pairwise velocity higher than that of the dark matter, though the pairwise dispersion remains somewhat lower.
6. The skewness of galaxy count fluctuations, as quantified by the hierarchical ratio , is lower than that of the dark matter by (Figure 10). The ratio and its scale dependence vary with galaxy baryon mass and age, in a fairly complex way.
7. The galaxy-mass cross-correlation function depends on galaxy mass and age in much the same way that the galaxy-galaxy correlation function itself does, though the trends are weaker because the mass distribution is the same in all cross-correlations (Figure 11). For each class of galaxies, the bias function defined by the ratio is roughly scale-independent, even when it is significantly different from unity, though it can be somewhat different in amplitude and shape from the analogous bias function (Figure 12).
8. The average extended mass distributions around galaxies depend significantly on baryon mass and age (Figure 13). The distribution around a typical high mass galaxy falls more steeply than an isothermal distribution, so that circular velocity curves decline from out to . For low mass galaxies, on the other hand, the average mass profile is shallower than isothermal at , where the individual galaxy halos begin to encounter the environment of a typical surrounding group. This effect is much more pronounced for old galaxies than for young galaxies. The ratio of mean aperture mass to galaxy baryon mass is roughly independent of baryon mass for apertures ranging from to , though the ratio is higher for the galaxies with the lowest . The ratio is higher for old galaxies than for young galaxies, again demonstrating the preferential location of old galaxies in dense environments.
For the most part, the dark matter clustering of the CDM model and these biases of the galaxy population lead to good qualitative and, where we have adequate statistics for comparison, quantitative agreement with observed galaxy clustering. The predicted galaxy correlation function is a power law of the observed slope and approximately the observed amplitude (see further discussion below). The redshift-independence of the comoving correlation length agrees with measurements from Lyman-break galaxy surveys at (Adelberger et al., 1998, 2002) and from deep redshift surveys extending to (Postman et al., 1998; Carlberg et al., 1999). The predicted dependence of clustering strength on baryon mass and population age agrees with the trends as a function of luminosity, color, and spectral type found in the 2dFGRS and SDSS (Norberg et al., 2001, 2002b; Zehavi et al., 2002). The predicted value of the hierarchical ratio agrees with measurements from angular clustering catalogs (Gaztañaga & Frieman, 1994; Gaztañaga, 2002; Szapudi et al., 2002). The value and scale-independence of the bias inferred from the ratio of galaxy-galaxy and galaxy-mass correlation functions agrees with recent observational estimates (Hoekstra, Yee, & Gladders, 2001). The dependence of the galaxy-mass correlation function on population age parallels the dependence on galaxy type found by McKay et al. (2001), and the aperture mass is approximately proportional to galaxy baryon mass, as McKay et al. (2001) also find.
There are three quantitative discrepancies between our predictions and existing measurements, two fairly subtle and one more substantial. First, the power law slope of for the -galaxy sample (the 500 most massive galaxies in the box at ) is slightly too steep, compared to observed values of , and there are hints of a departure from a power law at . Second, the correlation length of this sample, , is low compared to the value measured for -selected galaxies with in the SDSS (Zehavi et al., 2002), though it is consistent with the value found for -selected galaxies in the 2dFGRS (Norberg et al., 2001). Because of the still-limited size of our simulation volume, these discrepancies are of marginal statistical significance, and the N-body tests discussed in §3.1 imply that the low correlation length, at least, is a consequence of the lower than average fluctuation amplitude in the particular realization of CDM initial conditions used here.
The more serious quantitative discrepancy is the ratio of aperture mass to galaxy baryon mass . For , the simulation prediction agrees with the result derived by combining McKay et al.’s (2001) values of with Kauffmann et al.’s (2002) stellar mass-to-light ratios, but at higher the predicted ratios are lower than the observationally inferred values by factors of , implying that the galaxy baryon masses in the simulation are too high (Figure 14). As discussed in §4, we believe that this discrepancy is mostly numerical in origin, since our internal resolution tests (Fardal et al., in preparation) and comparisons between different SPH implementations (Springel & Hernquist, 2002) suggest that galaxy baryon masses are indeed overestimated by about this factor in this mass range, relative to a simulation with higher resolution or more accurate treatment of the interface between hot and cold gas phases. A comparison between our best guess at resolution-corrected results and the McKay et al. (2001) data points yields fairly good agreement in the average values of , which leaves little room for additional astrophysical processes, such as more aggressive feedback, to substantially suppress gas cooling and star formation in this galaxy mass range. Consistent with this conclusion, Yang et al. (2002) find that the N-body + semi-analytic models of Kauffman et al. (1999a), which do include much stronger stellar feedback, predict ratios that are too low (by a factor ) relative to those of McKay et al. (2001). As emphasized by Guzik & Seljak (2002) and Seljak (2002a, b), the constraints from galaxy-galaxy lensing measurements complement those from the galaxy luminosity function and the Tully-Fisher and fundamental plane relations because they suffer different systematic uncertainties and have different sensitivity to astrophysical and cosmological parameters. For example, lowering while keeping other parameters (including the linear power spectrum) fixed would tend to lower while having relatively little impact on the luminosity function (though galaxy formation, and hence galaxy luminosities, would still be affected by the different timescales and baryon-to-dark matter ratios of the lower model). The weak lensing constraints will become considerably more powerful as the precision and detail of the measurements improves.
Where we have been able to compare, our results generally agree well with those of other hydrodynamic simulations (Pearce et al., 1999, 2001; Cen & Ostriker, 2000; Yoshikawa et al., 2001), high resolution N-body simulations that identify galaxies with sub-halos (Colín et al., 1999; Kravtsov & Klypin, 1999), and combined N-body + semi-analytic models (Kauffmann, Nusser, & Steinmetz, 1997; Governato et al., 1998; Kauffman et al., 1999a, b; Benson et al., 2000a, b, 2001). All of these methods make qualitatively similar predictions for the evolution of the galaxy correlation function, the bias between galaxies and mass at the present day, the dependence of that bias on galaxy type, and the relative amplitude of dark matter and galaxy pairwise dispersions. This agreement suggests that these aspects of galaxy clustering and bias arise from robust aspects of the physics of galaxy formation that all of these methods treat correctly, or at least similarly. Our conclusions about and galaxy-mass correlations are for the most part new, but we do not expect them to be fundamentally different from the predictions of other methods.
Returning to the main goals of the paper, we find that the combination of a CDM cosmology with standard ideas about galaxy formation is, on the whole, remarkably successful at reproducing observed galaxy clustering and galaxy-galaxy lensing measurements. In terms of physical interpretation, the simulation analysis offers a number of insights. It shows that the detailed relation between the galaxy and dark halo populations can account for the difference between the predicted correlation function of dark matter and the observed power law form of the galaxy correlation function, and between the predicted pairwise velocity dispersion of the dark matter and the observed, lower dispersion of galaxies. It shows that the observed dependence of galaxy clustering on galaxy properties emerges naturally from the dependence of galaxy mass and population age on environment — basically, older and more massive galaxies form in regions that collapse early and are today biased with respect to the overall mass distribution. It shows that values of and can emerge even when galaxies do not trace mass in detail. The quantitative discrepancies discussed above may also prove instructive, as the observations improve and the uncertainties in the simulations themselves are more thoroughly understood.
Our analysis makes a number of predictions that can be tested with future data, or with future analyses of existing data. Our quantitative comparison to the observed type dependence of galaxy clustering has been limited by our finite simulation volume, which prevents us from predicting the clustering of rare classes of galaxies. However, it would be straightforward to test the quantitative predictions presented in, for example, Figure 7 by taking an observed sample above a luminosity threshold that yields the same space density as our complete sample and dividing it in two based on luminosity or color (or, better still, on the basis of stellar mass and population age, using techniques like those of Kauffman et al. 2002). The predicted evolution of the mean pairwise velocity and pairwise dispersion (Figure 8) can be tested with upcoming large redshift surveys like the DEEP and VIRMOS-VLT programs. The systematic variations of with galaxy luminosity and age (Figure 10) can be tested with the 2dFGRS and SDSS. The most informative comparisons will probably come from improved measurements of galaxy-galaxy lensing and cosmic shear, which will allow detailed tests of the trends predicted in Figures 12 and 13.
On all of these fronts, observational efforts are advancing at a staggering pace. Comparisons between more comprehensive data and improved theoretical predictions over the next few years should tell us whether our understanding of dark matter clustering and the physics of galaxy formation is indeed complete, at least in terms of features that have major quantitative impact, or whether there are still important ingredients missing from our theoretical recipe.
References
- Adelberger et al. (1998) Adelberger, K. L. , Steidel, C. C., Giavalisco, M., Dickinson, M., Pettini, M., & Kellogg, M. 1998, ApJ, 505, 18
- Adelberger et al. (2002) Adelberger, K. L. , Steidel, C. C., Shapley, A., & Pettini, M. 2002, ApJ, in press, astro-ph/0210314
- Bahcall et al. (1999) Bahcall, N., Ostriker, J. P., Perlmutter, S., & Steinhardt, P. J. 1999, Science, 284, 1481
- Bean et al. (1983) Bean, A. J., Ellis, R. S., Shanks, T., Efstathiou, G., & Peterson, B. A. 1983, MNRAS, 205, 605
- Bennett et al. (1996) Bennett, C. L., Banday, A. J., Gorski, K. M., Hinshaw, G., Jackson, P., Keegstra, P., Kogut, A., Smoot, G. F., Wilkinson, D. T., & Wright, E. L. 1996, ApJ, 464, L1
- Benoist et al. (1996) Benoist, C., Maurogordato, da Costa, L. N., Cappi, A., & Schaeffer, R. 1996, ApJ, 472, 452
- Benson et al. (2000a) Benson, A. J., Baugh, C. M., Cole, S., Frenk, C. S., & Lacey, C. G. 2000a, MNRAS, 316, 107
- Benson et al. (2000b) Benson, A. J., Cole, S., Frenk, C. S., Baugh, C. M., & Lacey, C. G. 2000b, MNRAS, 311, 793
- Benson et al. (2001) Benson, A. J., Frenk, C. S., Baugh, C. M., Cole, S., & Lacey, C. G. 2001, MNRAS, 327, 1041
- Berlind et al. (2002) Berlind, A. A., Weinberg, D. H., Benson, A. J., Baugh, C. M., Cole, S., Davé, R., Frenk, C. S., Jenkins, A., Katz, N., & Lacey, C. G. 2002, ApJ, submitted
- Berlind & Weinberg (2002) Berlind, A. A., & Weinberg, D. H. 2002, ApJ, 575, 587
- Bertschinger (1998) Bertschinger, E. 1998, ARA&A, 36, 599
- Blanton et al. (2001) Blanton, M.R. et al. 2001, AJ, 121, 2358
- Blumenthal et al. (1984) Blumenthal, G. R., Faber, S. M., Primack, J. R., & Rees, M. J. 1984, Nature, 311, 517
- Bond et al. (1991) Bond, J. R., Cole, S., Efstathiou, G., & Kaiser, N. 1991, ApJ, 379, 440
- Bouchet et al. (1993) Bouchet, F. R., Strauss, M. A., Davis, M., Fisher, K. B., Yahil, A., & Huchra, J. P. 1993, ApJ, 417, 36
- Bower (1991) Bower, R. J. 1991, MNRAS, 248,, 332
- Brainerd, Blandford, & Smail (1996) Brainerd, T. G., Blandford, R. D., & Smail, I. 1996, ApJ, 466, 623
- Burles & Tytler (1998) Burles, S., & Tytler, D. 1998, ApJ, 499, 699
- Carlberg & Couchman (1989) Carlberg, R. G. & Couchman, H. M. P. 1989, ApJ, 340, 47.
- Carlberg et al. (1999) Carlberg, R., et al. 1999, Phil. Trans. R. Soc. Lond. A, 356, 167
- Cen & Ostriker (1992) Cen, R., & Ostriker, J. P. 1992, ApJ, 399, L113
- Cen & Ostriker (2000) Cen, R. & Ostriker, J. P. 2000, ApJ, 538, 83
- Chen et al. (2002) Chen, X., Weinberg, D. H., Katz, N., & Davé, R. 2002, ApJ, submitted, astro-ph/0203319
- Colín et al. (1999) Colín, P., Klypin, A. A., Kravtsov, A. V., & Khokhlov, A. M. 1999, ApJ, 523, 32
- Colombi et al. (2000) Colombi, S., Szapudi, I., Jenkins, A., & Colberg, J. 2000, MNRAS, 313, 711
- Croft et al. (2001) Croft, R. A. C., Di Matteo, T., Davé, R., Hernquist, L., Katz, N., Fardal, M., & Weinberg, D. H. 2001, ApJ, 557, 67
- Croft et al. (1999) Croft, R. A. C., Weinberg, D. H., Pettini, M., Katz, N., & Hernquist, L. 1999, ApJ, 520, 1
- Croft et al. (2002) Croft, R. A. C., Weinberg, D. H., Bolte, M., Burles, S., Hernquist, L., Katz, N., Kirkman, D., Tytler, D. 2002, ApJ, in press, astro-ph/0012324
- Davé et al. (2001) Davé, R., Cen, R., Ostriker, J. P., Bryan, G. L., Hernquist, L., Katz, N., Weinberg, D. H., Norman, M. L., & O’Shea, B. 2000, ApJ, 552, 473
- Davé, Dubinski, & Hernquist (1997) Davé, R., Dubinski, J., & Hernquist, L. 1997a, NewAst, 2, 277
- Davé, Katz, & Weinberg (2002) Davé, R., Katz, N., & Weinberg, D. H. 2002, ApJ, 579, 23
- Davis et al. (1985) Davis, M., Efstathiou, G., Frenk, C. S., & White, S. D. M. 1985, ApJ, 292, 371
- Davis & Geller (1976) Davis, M. & Geller, M. J. 1976, ApJ, 208, 13
- Davis, Groth, & Peebles (1977) Davis, M., Groth, E. J., & Peebles, P. J. E. 1977, ApJ, 212, L107.
- Davis & Peebles (1983) Davis, M. & Peebles, P. J. E. 1983, ApJ, 267, 465
- de Lapparent, Geller, & Huchra (1988) de Lapparent, V., Geller, M.J., & Huchra, J.P. 1988, ApJ, 332, 44
- dell’Antonio & Tyson (1996) dell’Antonio, I. P. & Tyson, J. A. 1996, ApJ, 473, L17
- Burles & Tytler (1997) Burles, S., & Tytler, D. 1997, AJ, 114, 1330
- Diaferio et al. (1999) Diaferio, A., Kauffmann, G., Colberg, J. M., & White, S. D. M. 1999, MNRAS, 307, 537
- Dressler (1980) Dressler, A. 1980, ApJ, 236, 351
- Efstathiou et al. (1990) Efstathiou, G., Kaiser, N., Saunders, W., Lawrence, A., Rowan-Robinson, M., Ellis, R. S., & Frenk, C. S. 1990, MNRAS, 247, 10P
- Evrard, Summers, & Davis (1994) Evrard, A.E., Summers, F.J., & Davis, M. 1994, ApJ, 422, 11
- Eke, Cole, & Frenk (1996) Eke, V., Cole, S., & Frenk, C. S. 1996, MNRAS, 282, 263
- Falco et al. (1999) Falco, E. E., Kurtz, M. J., Geller, M. J., Huchra, J. P., Peters, J., Berlind, P., Mink, D. J., Tokarz, S. P., Elwell, B. 1999, PASP, 111, 438
- Fardal et al. (2001) Fardal, M. A., Katz, N., Gardner, J. P., Hernquist, L., Weinberg, D. H. & Davé, R. 2001, ApJ, 562, 605
- Fardal et al. (2002) Fardal, M. A., Katz, N., Weinberg, D. H., Davé, R., & Hernquist, L. 2002, ApJ, in press, astro-ph/0107290
- Ferreira et al. (1999) Ferreira, P. G., Juszkiewicz, R., Feldman, H. A., Davis, M., & Jaffe, A. H. 1999, ApJ, 515, L1
- Fischer et al. (2000) Fischer, P., et al. 2000, AJ, 120, 1198
- Fisher (1995) Fisher, K. B. 1995, ApJ, 448, 494
- Fisher et al. (1994) Fisher, K.B., Davis, M., Strauss, M.A., Yahil, A., & Huchra, J.P. 1994, MNRAS, 267, 927
- Frenk et al. (1988) Frenk, C. S., White, S. D. M., Davis, M., & Efstathiou, G. 1988, ApJ, 327, 507
- Fry (1996) Fry, J. N. 1996, ApJ, 461, L65
- Fry & Gaztañaga (1993) Fry, J. N., & Gaztañaga, E. 1993, ApJ, 413, 447
- Fry & Melott (1985) Fry, J. N., & Melott, A. L. 1985, ApJ, 292, 395
- Gardner et al. (1997) Gardner, J. P., Katz, N., Hernquist, L., & Weinberg, D. H. 1997, ApJ, 484, 31
- Gaztañaga (2002) Gaztañaga, E. 2002, ApJ, 580, 144
- Gaztañaga & Frieman (1994) Gaztañaga, E. & Frieman, J. A. 1994, ApJ, 437, L13
- Ghigna et al. (1998) Ghigna, S., Moore, B., Governato, F., Lake, G., Quinn, T., & Stadel, J. 1998, MNRAS, 300, 146
- Giovanelli, Haynes & Chincarini (1986) Giovanelli, R., Haynes, M. P., & Chincarini, G. L. 1986, ApJ, 300, 77
- Gott et al. (1989) Gott, J. R. et al. 1989, ApJ, 340, 625
- Gott & Rees (1975) Gott, J. R. & Rees, M. J. 1975, A&A, 45, 365
- Gott & Turner (1977) Gott, J. R. I. & Turner, E. L. 1977, ApJ, 216, 357
- Gott & Turner (1979) Gott, J. R. & Turner, E. L. 1979, ApJ, 232, L79
- Gott, Turner, & Aarseth (1979) Gott, J. R., Turner, E. L., & Aarseth, S. J. 1979, ApJ, 234, 13
- Governato et al. (1998) Governato, F., Baugh, C.M., Frenk, C.S., Cole, S., Lacey, C.G., Quinn, T.R. & Stadel, J. 1998, Nature, 392, 359
- Griffiths et al. (1996) Griffiths, R. E., Casertano, S., Im, M., & Ratnatunga, K. U. 1996, MNRAS, 282, 1159
- Guzik & Seljak (2001) Guzik, J., & Seljak, U. 2001, MNRAS, 321, 439
- Guzik & Seljak (2002) Guzik, J., & Seljak, U. 2002, MNRAS, 335, 311
- Guzzo et al. (1997) Guzzo, L., Strauss, M. A., Fisher, K. B., Giovanelli, R., & Haynes, M. P. 1997, ApJ, 489, 37
- Guzzo et al. (2000) Guzzo, L. et al. 2000, A&A, 355, 1
- Hamilton (1988) Hamilton, A. J. S. 1988, ApJ, 331, L59
- Hamilton (1992) Hamilton, A. J. S. 1992, ApJ, 385, L5
- Hamilton et al. (1991) Hamilton, A. J. S., Matthews, A., Kumar, P., & Lu, E. 1991, ApJ, 374, L1
- Hatton et al. (2002) Hatton, S., Devriendt, J. E. G., Ninin, S., Bouchet, F. R., Guiderdoni, B., & Vibert, D. 2002, MNRAS, submitted
- Hoekstra, Yee, & Gladders (2001) Hoekstra, H., Yee, H. K. C., & Gladders, M. D. 2001, ApJ, 558, L11
- Hoekstra, Yee, & Gladders (2002) Hoekstra, H., Yee, H. K. C., & Gladders, M. D. 2002, ApJ, 577, 595
- Hudson et al. (1998) Hudson, M. J., Gwyn, S. D. J., Dahle, H., & Kaiser, N. 1998, ApJ, 503, 531
- Jaffe et al. (2001) Jaffe, A., et al. 2001, Phys Rev Lett, 86, 3475
- Jenkins et al. (1998) Jenkins, A., Frenk, C. S., Pearce, F. R., Thomas, P. A., Colberg, J. M., White, S. D. M., Couchman, H. M. P., Peacock, J. A., Efstathiou, G., & Nelson, A. H. (The Virgo Consortium) 1998, ApJ, 499, 20
- Jing, Mo & Börner (1998) Jing, Y. P., Mo, H. J., & Börner, G. 1998, ApJ, 494, 1
- Jing, Börner, & Suto (2002) Jing, Y. P., Börner, G., & Suto, Y. 2001, ApJ, 564, 15
- Juszkiewicz, Bouchet, & Colombi (1993) Juszkiewicz, R., Bouchet, F. R., & Colombi, S. 1993, ApJ, 412, L9
- Juszkiewicz et al. (1995) Juszkiewicz, R., Weinberg, D. H., Amsterdamski, P., Chodorowski, M., & Bouchet, F. R. 1995, ApJ, 442, 39
- Kaiser (1984) Kaiser, N. 1984, ApJ, 284, L9
- Kaiser (1987) Kaiser, N. 1987, MNRAS, 227, 1
- Katz, Hernquist, & Weinberg (1992) Katz, N., Hernquist, L., & Weinberg, D. H. 1992, ApJ, 399, L109
- Katz, Weinberg & Hernquist (1996) Katz, N., Weinberg D. H., & Hernquist, L. 1996, ApJS, 105, 19 (KWH)
- Katz, Hernquist, & Weinberg (1999) Katz, N., Hernquist, L., & Weinberg D. H. 1999, ApJ, 523, 463
- Kauffman et al. (2002) Kauffmann, G., et al., MNRAS, in press, astro-ph/0204055
- Kauffmann & White (1993) Kauffmann, G. & White, S. D. M. 1993, MNRAS, 261, 921
- Kauffmann, Nusser, & Steinmetz (1997) Kauffmann, G., Nusser, A., & Steinmetz, M. 1997, MNRAS, 286, 795
- Kauffman et al. (1999a) Kauffmann, G., Colberg, J. M., Diaferio, A., & White, S. D. M. 1999a, MNRAS, 303, 188
- Kauffman et al. (1999b) Kauffmann, G., Colberg, J. M., Diaferio, A., & White, S. D. M. 1999b, MNRAS, 307, 529
- Kennicutt (1998) Kennicutt, R. C. 1998, ApJ, 498, 541
- Kollmeier et al. (2002) Kollmeier, J. A., Weinberg, D. H., Davé, R., & Katz, N. 2002, ApJ, submitted, astro-ph/0209563
- Kravtsov & Klypin (1999) Kravtsov, A. V. & Klypin A. 1999, ApJ, 520, 437
- Kroupa (2002) Kroupa, P. 2002, Science, 295, 82
- Loveday et al. (1995) Loveday, J., Maddox, S. J., Efstathiou, G., & Peterson, B. A. 1995, ApJ, 442, 457
- Ma & Fry (2000) Ma, C., & Fry, J. N. 2000, ApJ, 543, 503
- Maddox et al. (1990) Maddox, S. J., Efstathiou, G., Sutherland, W. J., & Loveday, J. 1990, MNRAS, 242, L43
- Mann, Peacock, & Heavens (1998) Mann, R. G., Peacock, J. A., & Heavens, A. F. 1998, MNRAS, 293, 209
- Marzke et al. (1995) Marzke, R. O., Geller, M. J., da Costa, L. N., & Huchra, J. P. 1995, AJ, 110, 477
- McDonald et al. (2000) McDonald, P., Miralda-Escudé, J., Rauch, M., Sargent, W. L. W., Barlow, T. A., Cen, R. & Ostriker, J. P. 2000, ApJ, 543, 1
- McKay et al. (2001) McKay, T. A., et al. 2001, unpublished, astro-ph/0108013
- Mellier et al. (2001) Mellier, Y., van Waerbeke, L., Maoli, R., Schneider, P., Jain, B., Bernardeau, F., Erben, T., & Fort, B. 2001, in Deep Fields, Proc. of ESO/ECF/STScI Workshop, ed. S. Cristiani, A. Renzini, R. E. Williams, (Springer), p. 252
- Mo, Jing, & Börner (1993) Mo, H. J., Jing, Y. P., & Börner, G. 1993, MNRAS, 264, 825
- Murali et al. (2002) Murali, C., Katz, N., Hernquist, L., Weinberg, D. H., & Davé, R. 2002, ApJ, 571, 1
- Narayanan, Berlind, & Weinberg (2000) Narayanan, V. K., Berlind, A. A., & Weinberg, D. H. 2000, ApJ, 528, 1
- Norberg et al. (2001) Norberg, P., et al. 2001, MNRAS, 328, 64
- Norberg et al. (2002a) Norberg, P., et al. 2002a, MNRAS, 336, 907
- Norberg et al. (2002b) Norberg, P., et al. 2002b, MNRAS, 332, 827
- Park (1990) Park, C. 1990, MNRAS, 242, L59
- Park et al. (1994) Park, C., Vogeley, M. S., Geller, M. J., & Huchra, J. P. 1994, ApJ, 431, 569
- Peacock & Dodds (1996) Peacock, J. A., & Dodds, S. J. 1996, MNRAS, 280, L19
- Peacock & Smith (2000) Peacock, J. A., & Smith, R. E. 2000, MNRAS, 318, 1144
- Pearce et al. (1999) Pearce, F. R., Jenkins, A., Frenk, C. S., Colberg, J. M., White, S. D. M., Thomas, P. A., Couchman, H. M. P., Peacock, J. A., & Efstathiou, G. 1999, ApJ, 521, L99
- Pearce et al. (2001) Pearce, F. R., Jenkins, A., Frenk, C. S., White, S. D. M., Thomas, P. A., Couchman, H. M. P., Peacock, J. A., & Efstathiou, G. 2001, MNRAS, 326, 649
- Peebles (1974) Peebles, P. J. E. 1974, A&A, 32, 197
- Peebles (1980) Peebles, P. J. E. 1980, The Large Scale Structure of the Universe (Princeton: Princeton University Press)
- Perlmutter et al. (1999) Perlmutter, S. et al. (The SCP Collaboration) 1999, ApJ, 517, 565
- Postman & Geller (1984) Postman, M., & Geller, M. J. 1984, ApJ, 281, 95
- Postman et al. (1998) Postman, M., Lauer, T. R., Szapudi, I., & Oegerle, W. 1998, ApJ, 506, 33
- Quinn et al. (1997) Quinn, T., Katz, N., Stadel, J. & Lake, G. 1997, unpublished, astro-ph/9710043
- Ratcliffe et al. (1998) Ratcliffe, A., Shanks, T., Parker, Q. A., & Fong, R. 1998, MNRAS, 296, 173
- Riess et al. (1998) Riess, A. et al. 1998, AJ, 116, 1009
- Schechter (1976) Schechter, P. 1976, ApJ, 203, 297
- Scoccimarro et al. (2001) Scoccimarro, R., Sheth, R. K., Hui, L., & Jain, B. 2001, ApJ, 546, 20
- Seljak (2000) Seljak, U. 2000, MNRAS, 318, 203
- Seljak (2002a) Seljak, U. 2002a, MNRAS, 334, 797
- Seljak (2002b) Seljak, U. 2002b, MNRAS, submitted, astro-ph/0203117
- Sheth et al. (2001) Sheth, R. K., Hui, L., Diaferio, A., & Scoccimarro, R. 2001, MNRAS, 326, 463
- Smith et al. (2001) Smith, D. R., Bernstein, G. M., Fischer, P., & Jarvis, M. 2001, ApJ, 551, 643
- Somerville & Primack (1999) Somerville, R. S. & Primack, J. R. 1999, MNRAS, 310, 1087
- Somerville et al. (2001) Somerville, R. S., Lemson, G., Sigad, Y., Dekel, A., Kauffmann, G., & White, S. D. M. 2001, MNRAS, 320, 289
- Springel & Hernquist (2002) Springel, V., & Hernquist, L. 2002, MNRAS, 333, 649
- Strauss et al. (2002) Strauss, M.A., et al. 2002, AJ, 124, 1810
- Summers, Davis, & Evrard (1995) Summers, F. J., Davis, M., & Evrard, A. E. 1995, ApJ, 454, 1
- Szapudi & Szalay (1993) Szapudi, I. & Szalay, A. S. 1993, ApJ, 408, 43
- Szapudi et al. (2002) Szapudi, I. et al. 2002, ApJ, 570, 75
- Tegmark & Peebles (1998) Tegmark, M., & Peebles, P. J. E. 1998, ApJ, 500, L79
- Tegmark & Bromley (1999) Tegmark, M., & Bromley, B. C. 1999, ApJ, 518, L69
- Totsuji & Kihara (1969) Totsuji, H. & Kihara, T. 1969, PASJ, 21, 221
- Tucker et al. (1997) Tucker, D. L., Oemler, A., Kirshner, R. P., Lin, H., Schectman, S. A., Landy, S. D., Schecter, P. L., Muller, V., Gottlober, S., & Einasto, J. 1997, MNRAS, 285, L5
- Tully & Fisher (1977) Tully, R. B. & Fisher, J. R. 1977, A&A, 54, 661
- Tyson et al. (1984) Tyson, J. A., Valdes, F., Jarvis, J. F. & Mills, A. P. 1984, ApJ, 281, L59
- Tytler, Fan, & Burles (1996) Tytler, D., Fan, X.M., & Burles, S. 1996, Nature, 381, 207
- Weinberg & Cole (1992) Weinberg, D. H., & Cole, S. 1992, MNRAS, 259, 652
- Weinberg et al. (1997) Weinberg, D. H., Hernquist, L., & Katz, N. 1997, ApJ, 477, 8
- Weinberg et al. (2002) Weinberg, D. H., Hernquist, L., & Katz, N. 2002, ApJ, 571, 15
- Weinberg et al. (1998b) Weinberg, D. H., Katz, N., & Hernquist, L. 1998b, in Origins, eds. J. M. Shull, C. E. Woodward, & H. Thronson, (ASP: San Francisco), 21
- Weinberg et al. (1999) Weinberg, D. H., Davé, R., Gardner, J. P., Hernquist, L., & Katz, N. 1999 in Photometric Redshifts and High Redshift Galaxies, eds. R. Weymann, L. Storrie-Lombardi, M. Sawicki & R. Brunner (ASP: San Francisco), 341341341
- White, Hernquist, & Springel (2001) White, M., Hernquist, L., & Springel, V. 2001, unpublished, astro-ph/0107023
- White et al. (1987) White, S. D. M., Davis, M., Efstathiou, G., & Frenk, C. S. 1987, Nature, 330, 451
- White, Frenk, & Davis (1983) White, S. D. M., Frenk, C. S., & Davis, M. 1983, ApJ, 274, L1
- Willmer, da Costa & Pellegrini (1998) Willmer, C. N. A., da Costa, L. N., & Pellegrini, P. S. 1998, AJ, 115, 869
- Wilson, Kaiser, & Luppino (2001a) Wilson, G., Kaiser, N., & Luppino, G. A. 2001a, ApJ, 556, 601
- Wilson et al. (2001b) Wilson, G., Kaiser, N., Luppino, G. A., & Cowie, L. L. 2001b, ApJ, 555, 572
- Yang et al. (2002) Yang, X., Mo, H. J., Kauffmann, G., & Chu, Y. 2002, MNRAS, submitted, astro-ph/0205546
- Yoshikawa et al. (2001) Yoshikawa, K., Taruya, A., Jing, Y. P., & Suto, Y. 2001, ApJ, 558, 520
- Zehavi et al. (2002) Zehavi, I., et al. 2002, ApJ, 571, 172