Far-Ultraviolet & H Spectroscopy of SNR 0057-7226 in the SMC H II Region N66
Abstract
N66/NGC 346 is the largest and brightest H II region in the Small Magellanic Cloud and contains at least one known supernova remnant SNR 00577226. Optical emission from the remnant is overwhelmed by the bright photoionized emission from the nebula, but the remnant has been detected by way of far ultraviolet absorption lines. Here we present data from the Far Ultraviolet Spectroscopic Explorer (FUSE) satellite showing strong O VI and C III emission from a position at the edge of SNR 00577226. We also present high-resolution, long-slit H spectra across N66 showing high- and low-velocity emission corresponding closely to the X-ray boundaries of the supernova remnant. We use these FUV and optical data to determine the physical parameters of the shock and interaction geometry with N66. We find that ionizing photons from the many massive cluster stars nearby likely affect the ionization balance in the post-shock gas, hindering the production of lower-ionization and neutral species. We discuss the importance and inherent difficulty of searching for supernova remnants in or near bright H II regions and suggest that the far ultraviolet provides a viable means to discover and study such remnants.
1 Introduction
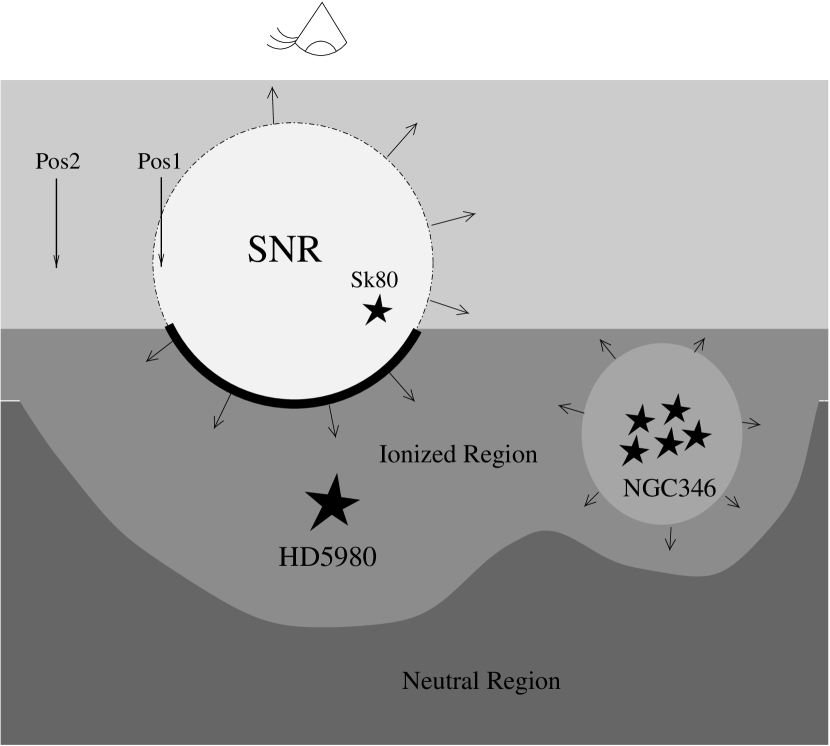
The giant H II region N66 is the largest, brightest star forming region in the Small Magellanic Cloud (SMC). The populous star cluster NGC 346 embedded in the nebula is home to several dozen early type stars including a dozen of spectral types O7 and earlier. Two arcminutes to the east lies the massive, luminous WN+OB system HD 5980 which underwent a luminous blue variable (LBV) outburst in 1994 (Koenigsberger et al., 1995; Barbá et al., 1995). These stars are the main source of ionization in the nebula.
N66 also contains at least one known supernova remnant (SNR), SNR 00577226. Einstein X-ray observations showed a bright source in N66 tentatively identified as a SNR (Inoue, Koyama, & Tanaka, 1983; Wang & Wu, 1992). Radio observations by Mills et al. (1982) showed bright, extended, thermal emission at 408, 843 and 5000 MHz corresponding to the H II region, but no clear sign of the SNR. Optical observations also showed only the extremely bright nebular emission but no filamentary structure associated with the SNR. However, Chu & Kennicutt (1988) discovered faint, high-velocity H emission in a long-slit spectrum across N66 and suggested the existence of a SNR. Subsequently, Ye, Turtle, & Kennicutt (1991) subtracted smoothed H data from 843 MHz radio continuum observations and revealed a remnant 3.2′ (55 pc at an SMC distance of 59 kpc) in diameter and confirmed the remnant SNR 00577226. X-ray spectroscopy of SNR 00577226 with ASCA (Yokogawa et al., 2000) showed that the spectrum can be modeled as a hot thermal plasma.
High-resolution X-ray observations of N66 with the Chandra X-ray Observatory (Nazé et al., 2002) show a 130″100″ region of extended, center-bright, thermal emission corresponding to the SNR. These high-resolution data show SNR 00577226 to have relatively uniform surface brightness and no clear temperature gradient from center to rim. Difference imaging techniques applied to recent radio observations (Filipović et al., 2003) at 1.42, 2.37, and 4.80 GHz (20, 13 and 6 cm) show SNR 00577226 to be a non-thermal, limb-brightened shell with a spectral index of approximately =0.17 (S). The X-ray and radio emitting regions are similar in extent at a resolution of 20″. Hence, the Ye, Turtle, & Kennicutt (1991) estimate of angular size is probably too large, and the X-ray/radio SNR is roughly 36 28 pc in extent. Thus, SNR 00577226 may be a member of the “mixed morphology” class of SNRs (Rho & Petre, 1998), with a radio shell and filled-center X-ray emission, although the presence of HD 5980 along the sight line confuses the situation. Nazé et al. (2002) resolve X-ray emission from HD 5980 itself for the first time, and note similarities with the galactic object Carinae, which has diffuse surrounding X-ray emission (Seward & Mitchell, 1981).
Nazé et al. (2002) mention a possible association of HD 5980 and SNR 00577226, but FUV absorption studies have clearly determined that HD 5980 is behind the SNR. FUV observations toward HD 5980 show the expected Galactic and SMC absorption at 0 km s-1 and 150 km s-1, respectively, as well as high-velocity absorption indicating the receding shell of an intervening SNR. Absorption at 300 km s-1 was found in IUE spectra by de Boer & Savage (1980); this was later confirmed by Fitzpatrick & Savage (1983) who suggested an intervening SNR. Koenigsberger et al. (2001) detected absorption systems at 300 and 330 km s-1 in C IV, N V and several other ions in high-resolution HST STIS spectra. They also see very weak components at 20 and 50 km s-1, possibly consistent with the approaching side of the remnant if indeed these features are real. Hoopes et al. (2001) also see absorption at 300 km s-1 in C III and O VI in FUSE observations of HD 5980 and conclude that the star must lie behind the receding shell of SNR 00577226. Hoopes et al. (2001) also find that a FUSE spectrum of Sk80 (AV232), an O7Ia star 1′ southeast of HD 5980 but also seen in projection within the X-ray emission, shows none of the high-velocity absorption seen toward HD 5980. Since Sk80 lies closer to the X-ray edge of the remnant, we might expect a lower line-of-sight velocity for SNR gas in this sight line. However, the O VI absorption profile near the SMC systemic velocity (150 km s-1) is indistinguishable from that of HD 5980. Thus, Sk80 must either lie within or in front of the remnant.
Far-ultraviolet (FUV) observations are useful in the study of SNRs. Several strong emission lines including C IV 1548,1550, N V1238,1242, and especially O VI 1032,1038 are good shock diagnostics and are produced in regions where the temperature is lower than typical X-ray producing regions and higher than regions of bright optical emission (Sutherland & Dopita, 1993). O VI emission, in particular, arises in gas at temperatures near K–a condition almost never reached by photoionization–and is thus a sensitive tracer of shock-heated material.
In this paper we present a FUSE observation of emission at the X-ray edge of SNR 00577226 that shows strong emission in O VI 1032,1038 and C III 977. We also present new longslit echelle observations showing high- and low-velocity material in H across the face of SNR 00577226. The observations are described in §2. In §3, we discuss the SNR kinematics as revealed by the optical and FUV data. In §4, we compare the O VI, C III, and H measurements with the predictions of shock models to derive shock velocity, preshock density and ram pressure at one location in the SNR. Using the same models with the FUV absorption data of Hoopes et al. (2001) and Koenigsberger et al. (2001), we derive similar values for material on the sight line toward HD 5980. We propose a physical picture for SNR 00577226 in relation to N66. Finally we discuss the implications these observations have for the detection of SNRs in bright nebulae and OB associations. A summary is presented in §5.
2 Observations
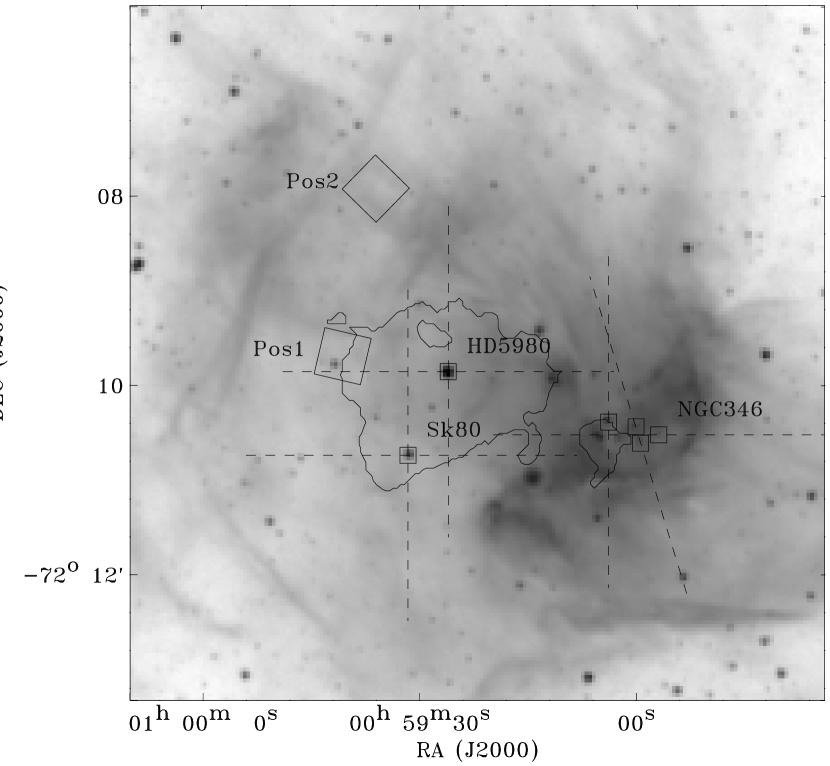
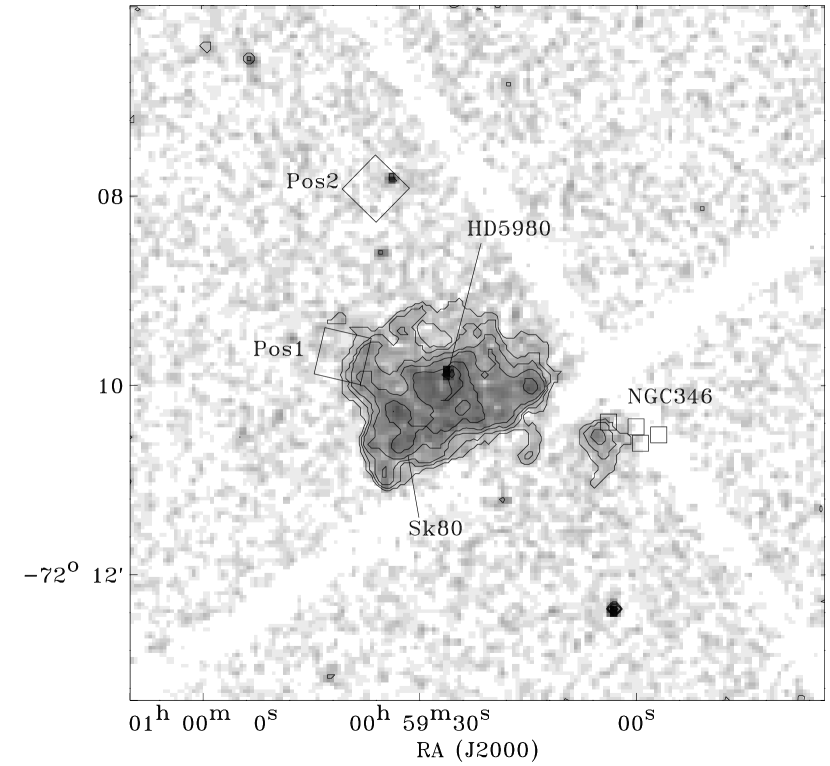
Figure 1 shows images of SNR 00577226 and its surroundings. The left panel shows an H+[N II] emission-line image taken with the Curtis Schmidt Telescope at CTIO in 1999, December. These data are described more thoroughly by Danforth et al. (2002). The right panel shows a recent X-ray image of NGC 346 from the Chandra X-ray Observatory, obtained courtesy of Nazé et al. (2002). These data show SNR 00577226 clearly as a bright, extended source. Unfortunately, the ACIS detector gaps partially obscure the southwestern edge of the SNR and some of the core of NGC 346 itself.
2.1 FUSE Observations
Six stars within N66/NGC 346 are part of the FUSE Hot ISM Team program and are marked with small boxes in Figure 1. Four of these targets are within the crowded core of the cluster itself. The cluster targets were observed with the 4″20″ MDRS aperture. The remaining two (HD 5980 and Sk80) lie about two arcminutes to the east of the cluster in projection toward SNR 00577226 and were observed with the 30″30″ LWRS aperture.
FUSE has three spectral apertures (Moos et al., 2000); the LWRS and the MDRS apertures are centered 209″ from each other. Thus, while the MDRS aperture was being used to observe stars in NGC 346, the LWRS aperture fell serendipitously on other parts of the sky. In one case (P20305, henceforth Position 1), the LWRS aperture fell 75″ east of HD 5980 on the eastern X-ray edge of SNR 00577226. This spectrum shows bright emission lines of C III 977.020 and O VI 1031.926, 1036.617. A very faint continuum underlies the bright emission lines at a flux level of erg s-1 cm-2 Å-1. In another case (P20302, henceforth Position 2) the LWRS aperture fell in a region north of HD 5980 outside the boundaries of the SNR’s X-ray emission. This sight line shows a weak continuum spectrum similar to that at Position 1. We use this sight line to characterize the FUV background of N66. The FUSE observations are summarized in Table 1. Figure 1 shows the positions of the FUSE LWRS apertures for Positions 1 and 2 as large boxes.
The third FUSE aperture, the 12520″ HIRS aperture, lies halfway between the other apertures. In several observations of stars in NGC 346 the HIRS aperture fell on X-ray bright regions of SNR 00577226. However, no flux was detected in these spectra. Since the HIRS aperture has less than 3% of the collecting area of LWRS for detecting diffuse emission, this negative result is consistent.
FUSE has four independent spectral channels (in FUSE nomenclature, LiF1, LiF2, SiC1, and SiC2), and because of thermal effects onboard the spacecraft, relative channel alignments shift in a complicated manner (Moos et al., 2000; Sahnow et al., 2000). This can cause significant complications for diffuse source observations (cf. Blair, Sankrit, & Tulin, 2002). The spacecraft guides on the LiF1 channel, which also has the highest FUV throughput near 1035Å. The other three channels tend to drift as much as 8″ over the course of a few orbits with respect to LiF1 if no realignments are made. For this reason, we use only LiF1 data for stellar targets whenever possible. LiF1 does not cover wavelengths below 987Å. Thus we use the lower-throughput SiC2 channel to observe C III 977. All four channels cover the 1035Å region containing O VI, so a direct comparison of C III and O VI is possible. The six stellar datasets were reduced using the methods described by Danforth et al. (2002) and references therein. Spectral resolution in these data is 15–20 km s-1.
The LWRS data were reduced using calfuse v2.0.5 and observations were combined by channel. The region around 1032Å was examined in all four channels to determine the relative shifts that exist in the wavelength solutions relative to LiF1. We increased the signal-to-noise ratio by coadding the two LiF channels to create a composite O VI spectrum. This does not significantly degrade the spectral resolution, which for an aperture-filling extended source is 0.34Å (106 km s-1 at 1032Å). O VI flux is present in the two SiC channels as well and closely resembles that in the LiF channels, but with lower S/N. The two SiC channels were coadded for the C III emission. Figure 2 shows these data in comparison to Position 2 which sampled a sight line outside the SNR.
2.2 CTIO 4-m Echelle Spectra
Seven longslit echelle spectra of the N66 region were obtained on the 4-m Blanco telescope at the Cerro Tololo Interamerican Observatory (CTIO) during 2000 December and 2001 December. These observations are summarized in Table 2 and the slit positions are shown in Figure 1 as dashed lines. For both observing runs, a 79 line mm-1 echelle grating and long-focus red camera were used. The decker was opened to its maximum extent giving a useful slit length on the sky of 35. The slit width was set to 165. The cross-dispersing grating was replaced with a flat mirror and an order-separating filter (=6580Å, =150Å) was used to isolate the spectral region around the H line. [N II] 6548,6583 also falls within the spectral range sampled.
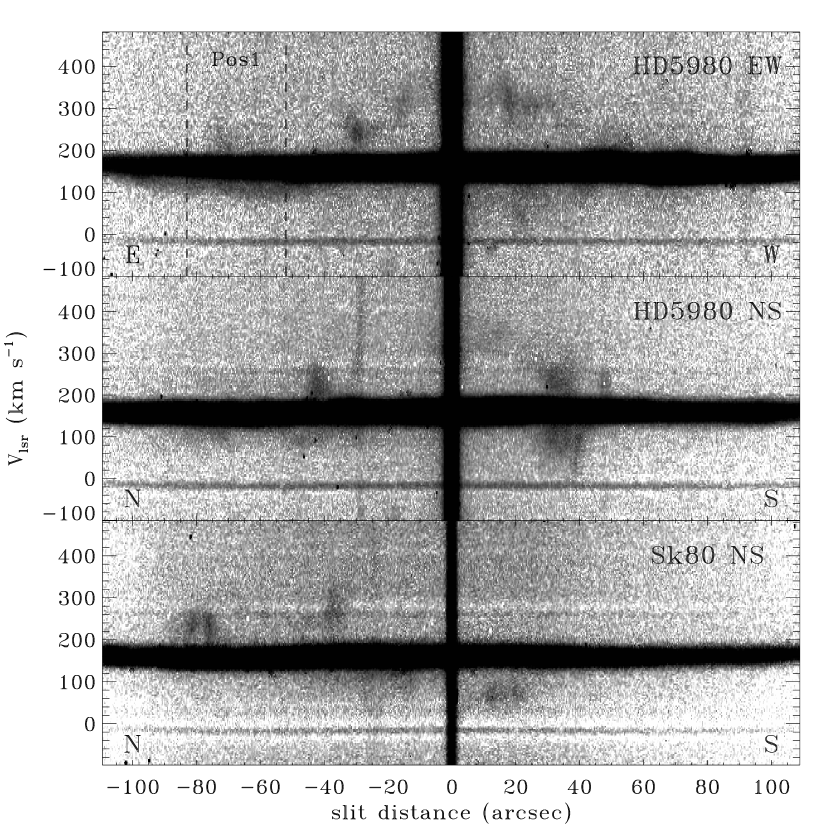
Data reduction was performed with IRAF111IRAF is distributed by the National Optical Astronomy Observatories, operated by the Association of Universities for Research in Astronomy, Inc., under cooperative agreement with the National Science Foundation. using the quadproc and longslit packages. Trim, bias and dark current calibration were performed first. The images were next processed to remove the tilt of the CCD axis with respect to the slit. This rendered the stellar spectra horizontal along a row. Thorium-Argon lamp spectral lines were traced and fit to correct for curvature in the cross-dispersion direction and provide a dispersion solution. Final wavelength calibration was performed using the terrestrial airglow lines present in the observations themselves. The result is a rectified spectrum with dispersion along the x-axis and the spatial dimension along the y-axis. The calibrated data cover 35 of sky at a spatial resolution of 1″ (0267 pix-1) and spectral resolution of 10 km s-1 (0.082Å pix-1 = 3.7 km s-1 pix-1). We present three of the spectra in two-dimensional format in Figure 3, where the wavelength scale has been converted to velocity.
3 Analysis
3.1 FUV Emission
The LWRS aperture of Position 1 lies 75″ east of HD 5980 and coincides with the edge of bright, soft X-ray emission (Figure 1). Strong O VI emission is seen in both lines of the doublet as well as C III 977.02 (Figure 2). We detect no other lines in the FUSE wavelength range (905–1187Å) besides airglow. In addition to the emission lines, a faint continuum is seen in the Position 1 spectrum (F erg s-1 cm-2 Å-1). The spectrum is consistent with an early-type star and shows many of the same ISM absorption features seen in other FUSE spectra. The unidentified star in the LWRS aperture visible in the optical image (Figure 1) is not the source of the FUV continuum. It does not appear in FUV UIT (Å) images of the region (Parker et al., 1998) and is of spectral type A or later.
In contrast to Position 1, there are no O VI and C III emissions detected at Position 2. This aperture fell an arcminute northeast of the edge of the SNR in a field empty of bright stars, UV-bright or otherwise. However, a similar stellar continuum can be seen in this spectrum. The faint continuum observed at both positions is due to dust-scattered starlight from the many FUV-bright sources nearby. A similar effect at longer UV wavelengths was seen in IUE spectra of other regions in the SMC (Blair et al., 1989).
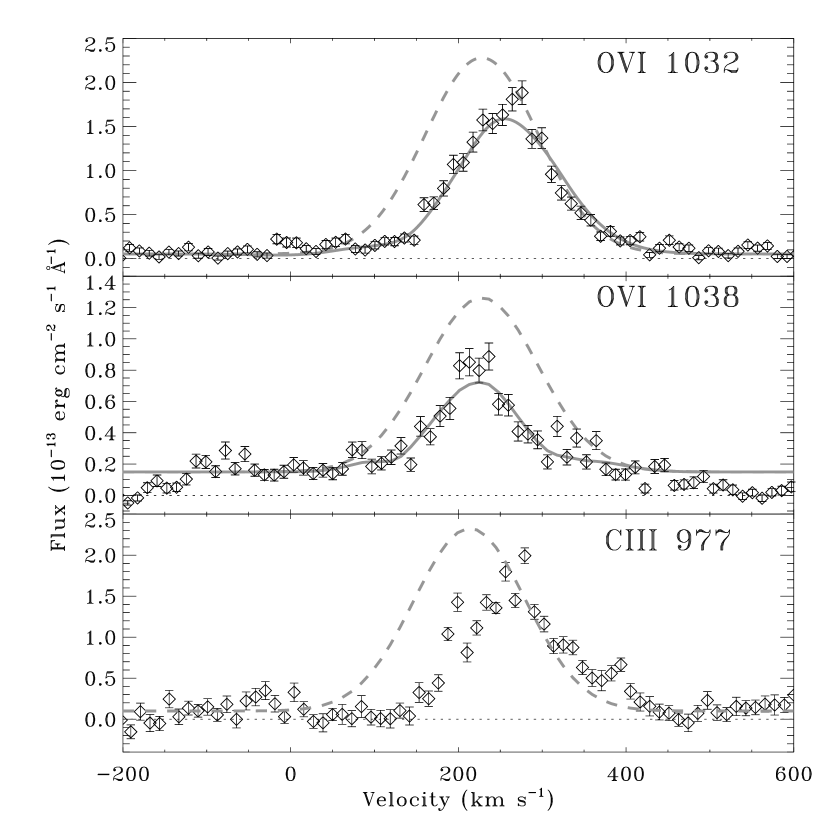
Any emission from the SNR will suffer absorption from the intervening SMC and Galactic ISM. Fortunately, there is little molecular hydrogen absorption in the vicinity of 1032Å; the only ISM absorption comes from SMC and Galactic O VI. We use the continuum-normalized O VI absorption profile of Sk80 (Danforth et al., 2002, their Figure 80) as our absorption model. A Gaussian profile divided by the absorption model was convolved with a 106 km s-1 aperture function. The Gaussian parameters were varied and the resulting models were fit to the observed 1032 line profile. The best fit parameters were: =228 km s-1, FWHM=159 km s-1, and peak flux=2.23 erg s-1 cm-2 Å-1. The total flux of the intrinsic Gaussian function is 1.27 erg s-1 cm-2 compared with an observed flux of 8.68 erg s-1 cm-2. Both the fit to the data and the intrinsic Gaussian profile are shown in the top panel of Figure 4.
The O VI 1032 line should be twice the intensity of the 1038 line in the absence of resonance scattering and self-absorption. However, this ratio can vary as a function of velocity within the line profile. The observed 1032/1038 ratio is close to two on the blue-shifted side of the line but becomes significantly higher on the red-shifted wing. Since SMC and Galactic O VI absorption affect both lines in a proportional manner, we conclude that resonance scattering and self-absorption is minimal but that significant absorption from molecular hydrogen—5-0(P1)H2 1038.156 and 5-0(R2)H2 1038.690—affects the weaker line.
We can characterize the 1038 emission using the intrinsic emission profile determined from the 1032 line. In this case, the absorption model was allowed to vary; a simulated molecular absorption spectrum was calculated with the FUSE spectral simulator code fsim and the Sk80 1032 O VI absorption profile (scaled by a square root) was multiplied in. (Since in the optically thin limit, .) The resulting model was multiplied by the intrinsic Gaussian profile determined above and convolved with the aperture function to simulate the observed 1038 line.
We first fit the 1038 emission using two molecular hydrogen components: a Galactic component (Shull et al., 2000) (v=0 km s-1, N(H2)=, b=5 km s-1, T=150 K) and an SMC component (v=115 km s-1, N(H2)=, b=15 km s-1, T=400 K) slightly modified from Tumlinson et al. (2002). However, this did not produce enough absorption on the red side of the emission. A third component, representing swept-up material from the SNR at v155 km s-1 improves the fit (Figure 4, middle panel), but requires an unphysically large turbulent velocity for a good fit. There could be many components at a range of velocities in the turbulent, post-shock gas which might account for the enhanced absorption. No such high-velocity components are seen by Tumlinson et al. (2002).
The C III 977 emission is strongly affected by resonance scattering and self-absorption. The FUSE spectrum shows that the Galactic and SMC components are saturated (Danforth et al., 2002). Therefore we do not attempt to fit the observed C III profile. The measured flux, 6.3 erg s-1 cm-2, is a lower limit to the intrinsic flux. Overlaying the derived O VI 1032 profile (Figure 4, bottom panel) provides a first order assessment of how this line might be affected if its intrinsic line width is similar to O VI.
Apart from O VI and C III (and geocoronal airglow), there are no other lines detected. In a spectrum of the Cygnus Loop, a typical middle-aged SNR, the next brightest lines to O VI and C III were [Ne V] 1146 and S IV 1063,1074 at 5% of the observed O VI flux (Blair, Sankrit, & Tulin, 2002). Such weak emission would not be detected in the spectrum of SNR 00577226, especially considering the lower abundances of these elements in the SMC.
3.2 H and [N II] Emission
The seven echelle observations cut across much of the N66 nebulosity in Figure 1 including the core of NGC 346 and the outlying regions. Three spectra cross significant portions of the SNR and show faint high- and low-velocity emission. The data show both H and [N II] emission at a velocity resolution of 15 km s-1.
We find the nebula itself to be surprisingly quiescent on the large scale given the violence of strong stellar winds and ongoing star formation. The bright nebular emission can be fit with a single-component Gaussian with vlsr=157.7 km s-1, FWHM=34.7 km s-1. Assuming a temperature of K in the photoionized gas, we derive a bulk turbulence of 23.8 km s-1(b=14.3 km s-1). This degree of turbulence is typical of Magellanic H II regions but much lower than that seen in giant H II regions such as 30 Doradus and nebulae in M101 and M33 (Chu & Kennicutt, 1994; Smith & Weedman, 1973, 1971, 1970). The thermal FWHM of [N II] is narrower than that of H by the square root of the ratio of their ionic masses (i.e. by =3.7). Thus [N II] emission is a more sensitive probe of velocity structure than H. However, these lines are usually much weaker than H, particularly in the low-nitrogen SMC ISM, and are often completely undetectable in SMC echelle spectra. Four of the echelle spectra (both HD 5980 pointings, NGC 346-WB3+4 and NGC 346-WB6) have usable [N II] data. These show km s-1 and a =22.8 km s-1. Assuming a temperature of 104 K, we derive a bulk turbulence of 17.5 km s-1 (b=10.5 km s-1), also typical for ordinary Magellanic H II regions.
The two spectra which cut through NGC 346 show an expansion feature bounded by the bright H rim visible in Figure 1 surrounding the cluster core. (NGC 346-WB1 samples the same region as the latter two spectra, but has a high sky brightness masking any [N II] emission.) The data show a maximum expansion velocity of 14 km s-1. This expansion is presumably driven by the stellar winds of the stars located within the bubble. The NGC 346 expansion feature is also detected in the H data, but only in that a pair of Gaussians are needed to fit the broad H profile, rather than a single component. Meanwhile, the east-west HD 5980 data cut through N66C, a compact H II region to the west of HD 5980 and north east of the cluster core. The [N II] data reveal an expansion feature here with km s-1.
High- and low-velocity H emission appear in the four echelle observations which cross SNR 00577226 (HD 5980 NS and EW, Sk80 NS and EW). Three of these spectra are shown in Figure 3; the fourth spectrum (Sk80 EW) is of low signal-to-noise and intersects only the edge of the remnant. The faint, higher velocity emission in these spectra arises in shocks associated with the SNR. It is weaker than the photoionized nebular emission by a factor of 70 and has a very low signal to noise ratio. The SNR emission is quite patchy: blobs with widths of 10″ (3 pc) are seen in the position-velocity diagrams (Figure 3).
We find high-velocity features all across the face of SNR 00577226 with higher velocity emission typically toward the center suggesting an expanding shell. The fastest emission is at v335 km s-1 about 15″ (4 pc) south of HD 5980 (this is also the region of peak X-ray brightness). If the systemic velocity of the SNR is taken to be the same as the N66 ISM, this gives an expansion velocity of km s-1, consistent with strong O VI production by the shock front.
The H emission from the approaching side of the SNR is also seen in Figure 3, though it is even fainter than the receding side. In the few cases where the blue-shifted material is discernible from the Gaussian wings of the bright nebular emission, we see velocities as low as v km s-1. As with the receding side of the SNR, the material with the largest velocity offsets tends to be closest to the center of the remnant.
Approximate spectrophotometry was performed on the echelle data using a flux-calibrated H+[N II] image of N66 obtained from Kennicutt & Hodge (1986). Comparing profiles from the image with wavelength-integrated intensity along the slit gave a conversion factor of 4.5 erg s-1 cm-2 count-1. We use this value to measure fluxes and surface brightnesses for different patches of SNR emission in the spectra (Figure 3). A Gaussian profile was fit to the main nebular emission (v158 km s-1) over a range along the slit and divided from the data. A background level was then subtracted and the remaining counts within a wavelength (velocity) range - were summed. The summed counts were converted into a total flux. Surface brightness was determined by dividing the total flux by the area covered by the extraction region (). Typical observed surface brightnesses were erg s-1 cm-2 arcsec-2 with a standard deviation of 50%.
There is a faint patch of H emission at 215 km s-1 at the Position 1 LWRS aperture (Figure 3, top panel). This corresponds reasonably well with the observed O VI emission at 228 km s-1. We measure the surface brightness of this emission patch to be erg s-1 cm-2 arcsec-2 over a slit range 57″–79″ east of HD 5980.
4 Discussion
The detection of O VI emission as well as the kinematics present in the H echelle data imply the presence of a strong shock in N66 associated with SNR 00577226. The SNR shock model was also favored by Hoopes et al. (2001) for the high velocity absorption towards HD 5980. Detection of the front side of SNR 00577226 has not been clearly established because the low velocity components cited by Koenigsberger et al. (2001) were detected at such a marginal level. In any event, the near side of the SNR is considerably more difficult to detect both in emission and absorption than the back side. Optical emission from the H II region complicates the situation and masks the morphology of the SNR.
In the following discussion we adopt a working model of the physical association of various components in the N66 region. A roughly spherical SNR is located on the near side of N66. The rear side of the SNR is propagating into relatively denser nebula while the near side is propagating through the more rarefied SMC ISM. HD 5980 lies behind the remnant, embedded within N66. The NGC 346 cluster stars lie outside the SNR, also embedded within N66. We determine the shock velocity, preshock hydrogen density and ram pressure of the shock wave using the emission and absorption sight lines toward SNR 00577226. By examining the surface brightness ratio between O VI and H, we measure the “completeness” of the shock. Then we discuss the relationship between the SNR and its surroundings and the implications of this analysis for observing SNRs in other H II regions.
4.1 Physical Properties
In the N66 reference frame (vlsr=158 km s-1), the material at Position 1 has a radial velocity of 70 km s-1 while toward HD 5980, km s-1. From X-ray and radio images, we choose the center of the remnant to be (J2000) =00:59:27, =72:10:15, about 20″ south of HD 5980. This position is also consistent with the location of the highest-velocity H emission (Figure 3). Using the projected distances from this center and the two radial velocity measurements, we derive a radius of curvature for the shock front of 80″ and an expansion velocity for the O VI gas of v km s-1. This places the observed X-ray edge on the eastern side of the shock front inclined 60° to our line of sight. The expansion velocity of 147 km s-1 is not the shock speed, but rather the bulk velocity of the postshock material which should be between 0.75 and 1.0 times the shock speed.
First we caculate shock models for comparison against the observations. The models were calculated using an updated version of the code described by Raymond (1979). The main input parameters are the shock velocity, the preshock density and the elemental abundances. We ran models for shock velocities between 140 and 200 km s-1 spaced by 10 km s-1. A preshock hydrogen number density of 1 cm-3, and SMC elemental abundances (Russell & Dopita, 1990) were used in all the models. The calculation is followed until the the recombination zone is complete and the gas temperature has reached about 1000 K. We present the intensities of selected lines from the shock models in Table 3. The intensities are relative to H=100 and the flux from nearby multiplet lines of an ion have been summed. The O VI line flux produced by a shock increases sharply as a function of shock velocity in the range 150 – 200 km s-1. Shocks below 160 km s-1 do not produce much O VI and thus this represents a lower limit to the actual shock velocity in the SNR. Over this same range of shock velocities, the C III flux remains nearly constant. The changing ratio of I(O VI)/I(C III) is due to the increasing ionization of oxygen at higher velocities.
As discussed in §3.1, the C III is strongly affected by absorption and scattering, and so it is not possible for us to derive an accurate assessment of the intrinsic ratio of I(O VI)/I(C III) in the spectrum of Position 1. However, we note that using the total (corrected) O VI flux with the observed C III flux places an upper limit of F(O VI)/F(C III)3. Ignoring the effect of differential reddening for the moment, this clearly points us toward the lower end of the velocity range where O VI is produced. Based on this ratio, the observed expansion velocity and the shock velocity requirements for O VI production, we adopt 160 km s-1 as a representative shock velocity at Position 1 and use details from the model at this velocity below.
We now compare the observed and calculated O VI surface brightnesses to estimate the preshock density required to produce the observed O VI flux. The model predicts an O VI surface brightness (in both lines of the doublet) of I erg s-1 cm-2 into 2 steradians (for vshock=160 km s-1, =1 cm-3, He/H=0.08) or I erg s-1 cm-2 arcsec-2. In the optically thin limit, intensity will scale with density so we can write
where is the reddening correction factor at 1035Å, is the surface area of shock (in arcseconds2) within the aperture and is the preshock density in units of cm-3. Iobs is the total O VI flux in both lines which we estimate by multiplying the corrected O VI 1032 flux by 1.5, thus I erg s-1 cm-2. From Figure 1, we estimate that of the LWRS aperture is filled with X-ray emission. If the O VI emission follows the same pattern and the shock front is tilted 60° from our line of sight, then the aperture sampled emission from 600 arcseconds2 of shock front.
Reddening is a potential source of uncertainty. Massey, Parker, & Garmany (1989) found the mean E(BV)=0.14 for the NGC 346 stellar population. However, since the SNR lies in front of the bulk of the cluster, this may overestimate the extinction to the SNR. On the other hand, using the spectral type and observed colors of Sk80, one can derive E(BV)=0.11. We adopt this value and assume Rv=3.1 (typical for the diffuse ISM) and the extinction curve of Hutchings & Giasson (2001) (E(1035ÅV)/E(BV)=18). This yields a reddening correction C1035=4.5.
Solving the above equation, we get n cm-3 at Position 1, similar to an azimuthally-averaged electron density of 7 cm-3 at the radius of Position 1 derived by Kennicutt (1984). The dynamical pressure is then dyne cm-2. If more reddening is assumed and E(BV) is raised to 0.14 (C1035=6.8), the changes are minor: n cm-3 and dyne cm-2. Less reddening (E(BV)=0.08, C1035=3.0) would yield n cm-3, dyne cm-2.
This pressure is higher than those seen in regions of the Vela SNR. Sankrit et al. (2001) derive n cm-3 and P=3.7 dyne cm-2 for a X-ray bright, nearly face-on shock. Raymond et al. (1997) find P=1.6 dyne cm-2 for an edge-on shock. Jenkins & Wallerstein (1995) find P=2-4 dyne cm-2 for another locations in Vela while Kahn et al. (1985) find P1 dyne cm-2 for a region of diffuse X-ray emission. This variation in pressures within the same remnant suggests local density and pressure enhancements caused by reverse shocks from blastwave-cloud interactions. We have only two widely-separated measurements for SNR 00577226 and can say nothing so specific but the high pressure and density at Position 1 as well as the X-ray emission morphology suggest similar shock-cloud interactions.
The shock models discussed above predict the total column depths of ions produced in the post-shock flow. Hoopes et al. (2001) measured the column depths of several highly ionized species in the high-velocity component toward HD 5980 (their Table 1) and conclude that a SNR shock is the most likely production mechanism for these ions in the observed quantities. Koenigsberger et al. (2001) presented data on other ions not available to FUSE. In Figure 5, we present the observed column depths of these FUV ions and the values predicted by the models with vs=160, 180 and 200 km s-1. The ions are ordered according to the ionization potential needed to produce them. The relative column depths of all the ions down to Fe III are well matched by the 160 km s-1 model. The higher velocity models predict too much O VI relative to the other high ionization ions. The column depths scale linearly with preshock density (all the models were run with n0 = 1 cm-3). The offset between the 160 km s-1 model and the observations is dex, so a preshock density of can reproduce the observed column depths for the high ionization lines. The shock velocity and preshock density toward HD 5980 are thus in good agreement with our measurements for Position 1.
The behavior of the low ionization lines is drastically different. For Si II and Fe II, all the models predict column densities that are an order of magnitude higher than the observations (see Figure 5). This dearth of low-ionization material can also be seen by comparing the observed and calculated ratio of O VI and H. The shock models (which have been calculated to the point of complete recombination) predict I(O VI)/I(H)=3.3 for =160 km s-1 and SMC abundances. The observed ratio at Position 1 is
where indicates the surface brightness and the aperture filling factor of the relevant emission. We assume the reddening correction =4.5 as discussed above; reddening at H is moderate and we adopt =1.24. The filling factor for each aperture is more uncertain. We assume as discussed above. It is difficult to say where emission does and does not appear at a fine scale in the low S/N echelle data. The H aperture was chosen carefully to encompass only the faint emission in Figure 3, but we estimate that is still . These values give I(O VI)/I(H)18. Uncertainties in the filling factors, reddening, and surface brightnesses probably make this ratio uncertain by a factor of 2, but the ratio is still significantly higher than the predicted ratio of 3.3.
The weakness of H emission compared with O VI at Position 1 suggests the presence of an incomplete shock. There are many cases where incomplete shocks are observed in individual filaments or small portions of SNRs (Fesen, Blair, & Kirshner, 1982; Blair et al., 1991; Danforth, Blair, & Raymond, 2001); however, these regions are all at sub-parsec scales. The LWRS aperture at Position 1 is sampling a region of SNR 00577226 roughly 8 pc across. Furthermore, the observed H surface brightness does not vary strongly between different portions of the SNR implying that the conditions at Position 1 are typical of the remnant as a whole. In Figure 3, we see weak SNR H emission or none at all. This is a large object with moderate shock velocities implying that it is a middle-aged remnant like the Cygnus Loop or the Vela SNR; most of the optical emission from these remnants comes from complete, radiative shocks and these remnants are bright in H. If some portions of SNR 00577226 were recombinationally complete, we would expect to see H emission 10 times brighter than is observed. Thus, it appears that there is a global effect preventing the cooler parts of the recombination flow from forming.
We argue that the gas at the back end of the post-shock flow is being prevented from recombining by the ionizing flux from the bright stars in N66. There are eleven stars of spectral type O6.5 or earlier located 2′ (35 pc, in projection) to the west of SNR 00577226. The combined ionizing flux from NGC 346 is 4.01040 erg s-1 (Relaño, Peimbert & Beckman, 2002) or 1.51051 ionizing photons s-1. HD 5980 itself contributes ionizing photons s-1. Using basic ionization/recombination equations from Osterbrock (1989) we find that this photon flux in a medium with density 5 cm-3 will yield an ionized sphere over 100 pc in radius. Indeed, Relaño, Peimbert & Beckman (2002) find that N66 is density bounded and that 45% of the ionizing photons from cluster stars escape to ionize the general SMC ISM. This zone of ionization could encompass SNR 00577226 and affect the ionization balance in the recombining post-shock gas. The dynamical time scale of the shock is of order a few hundred years. The photoionization time scales are much shorter (100 days), while the recombination times are longer (of order 10,000 yr). Thus the ionizing flux will suppress H emission.
The strength and spectral energy distribution of the local ionizing flux will affect the column densities of the low and moderately ionized species. In theory, much of the discrepancy between the modeled and observed Fe II and Si II columns towards HD 5980 (Figure 5) could be due to iron and silicon being ionized to higher ionization stages. If the best fit model is scaled up to n cm-3, the Fe III column is underpredicted by about 0.3 dex. This is clearly not enough to explain the 1.9 dex discrepancy in the Fe II column, but the stellar spectrum extends out to 50 eV (Relaño, Peimbert & Beckman, 2002) and the local flux could be producing Fe IV. However, no such discrepancies are seen in the Si III and Si IV columns.
A more likely scenario is that the sight line to HD 5980 is passing through a small region where the swept up column is lower than average for SNR 00577226. While the Fe III zone is complete, the Fe II zone would be incomplete regardless of ionizing radiation. A self-consistent shock model calculation that includes a photoionizing field is necessary to predict the column densities and the H flux accurately. While such modeling is beyond the scope of this paper, we conclude that the local ionizing field must have a significant effect on the observed characteristics of SNR 00577226 as a whole.
4.2 The Relationship Between SNR 00577226 and N66
The emission and absorption data discussed here lead to a schematic structure for the N66–SNR region shown in Figure 6. SNR 00577226 lies on the near side of N66 and is encountering the denser nebular material on its back side. Position 1 is located at the edge of the X-ray emission (Figure 1). The observed radial velocity of O VI and H emission at Position 1 is 225 km s-1. This is lower than the observed velocity of absorption (300 km s-1) toward HD 5980 which lies projected closer to the center of the remnant. Also it is 75 km s-1 higher than the systemic velocity of N66 (158 km s-1), which we would expect for material viewed tangentially at the edge of the expanding remnant. Either the systemic velocity of the SNR and N66 differ by 70 km s-1, or the observed X-ray edge (a portion of which is Position 1) does not represent the actual limb of the SNR shock. The latter is assumed in Figure 6.
We propose that the X-ray emission arises over a spherical cap where the shock has encountered and heated denser material. The remnant is not yet even half-way submerged in the N66 material, and thus the observed radius of X-ray emission is smaller than the actual blast wave radius. The observed X-ray edge at Position 1 is inclined to our line of sight by 60°. HD 5980 and the other UV-bright stars are located within N66 and have ionized a region of surrounding material. The combined stellar winds and thermal pressure have formed a slowly expanding envelope around the cluster core. Since high-velocity absorption is not seen in the spectrum of Sk80 (Hoopes et al., 2001), it must lie within or in front of the SNR. HD 5980 lies behind the remnant and affects the ionization balance in the swept-up gas, preventing the formation of H I, S II, Fe II, Si II and other low-excitation species. The bright nebular emission seen surrounding the UV bright stars of N66 arises in dense material behind an ionized layer.
The approaching SNR material is apparent in H in Figure 3, but has not been conclusively identified in FUV spectra. If the far side of the remnant is seen near 300 km s-1 and if the SNR is centered at the SMC systemic velocity of 155 km s-1, we expect the nearside absorption to be seen near v=10 km s-1. This region is essentially masked by Galactic absorption making it difficult to detect the SNR. Hoopes et al. (2001) compared the O VI spectra of Sk80 and HD 5980 near zero velocity and found no difference. However, both of these sight lines are toward the remnant and may contain nearly identical foreground O VI columns.
The four FUSE targets in NGC 346 lie less than 2′ from HD 5980 and are outside the SNR sight line. A comparison of the averaged, normalized O VI profiles from these four targets and the two sight lines projected within the SNR is shown in Figure 7. We find a small but systematic excess in O VI absorption near v=0 km s-1 in the two remnant profiles. The difference represents an extra O VI column density of about cm-2 or about that of the backside value reported by Hoopes et al. (2001). We also find that the velocity centroid of the HD 5980/Sk80 zero velocity absorption is shifted by about 10 km s-1 with respect to the NGC 346 Galactic absorption. This is not too different from the velocity found by Koenigsberger et al. (2001) for Si IV and C IV absorption features that they attribute to front-side SNR material.
Recent work by Howk et al. (2002) on Galactic halo O VI absorption has shown significant variations in O VI column over as little as 3′. The variation in N(O VI) between the four NGC 346 targets (mean separation 19″) is 9% (the maximum variation between two measurements is 12%) while the variation between the two SNR sight lines (separation 1′) is only 8%, comparable to the uncertainties due to continuum placement, noise, and limits of integration. However, the cluster and SNR stars show a relative difference of 53% in the zero-velocity O VI column over 2′. Because of the potential Galactic halo variation on small scales, the matter of frontside absorption remains inconclusive. However, it is plausible we are seeing front side absorption near v=10 km s-1 in the HD 5980/Sk80 data. If true, then Sk80 would be inside SNR 00577226, as shown in Figure 6. Even if it is not, we can place an upper limit of N(O VI) cm-2 for the frontside O VI column density, much less than is observed from the back side of SNR 00577226.
In a recent paper, Velázquez, Koenigsberger, & Raga (2003) model the collision of a SNR shock with a wind-blown bubble around an evolved star and suggest that the far side of SNR 00577226 is interacting with the stellar wind of HD 5980. The X-ray image of the system (Nazé et al., 2002) does, in fact, show some resemblance to the models and there is reasonable agreement between predicted and observed X-ray fluxes. Our observations allow us to further test this wind-SNR model. The Velázquez et al. wind-blown bubble has a radius of 10 pc while our Position 1 (at the rim of the SNR) is at least twice that distance (in projection) from HD 5980; thus, Position 1 is sampling the ISM, not stellar wind. In §4.1 we derived a preshock density of 6 cm-3 for the material at both Position 1 and in the shock toward HD 5980, at least two orders of magnitude higher than the interior of the modeled wind bubbles (see Figures 1 and 2 of Velázquez, Koenigsberger, & Raga, 2003). Furthermore, the 300 km s-1 component exhibits an ionization structure expected for a single SNR shock (Hoopes et al., 2001). If this component arose in a turbulent region between SNR and stellar wind shock fronts, as suggested by Velázquez, Koenigsberger, & Raga (2003), we might not expect to see the kinematics structure observed by Hoopes et al. (2001). Clearly, higher resolution spectral observations and detailed shock models are required.
4.3 Implications for SNRs in H II Regions
Core-collapse supernovae arise from massive stars often formed in clusters and associations–the same massive stars which photoionize their surrounding gas and create bright H II regions. Massive SN progenitors cannot migrate far from their birth places in their short lifetimes and thus SNRs associated with H II regions should occur frequently. To various degrees, this is not seen in optical SNR surveys of nearby galaxies.
The primary optical method for detecting SNRs, especially in galaxies beyond the Magellanic Clouds, is to compare H to [S II] emission, and pick out objects with [S II]/H 0.4 (cf. Long et al., 1990; Blair & Long, 1997, and references therein). In recent years, as the sensitivity and resolution of radio and X-ray observations has become competitive with optical ground-based observations, independent searches at these wavelengths have been undertaken and compared against the optical SNR lists (Lacey, Duric, & Goss, 1997; Gordon et al., 1998, 1999; Pannuti et al., 2000, 2002). These multiwavelength surveys and comparisons provide a more complete survey method, but in general do not find many of the same SNRs. Discussions of selection effects usually point toward “confusion” as being responsible for incompleteness of optical SNR surveys in crowded and complex regions of emission. Clearly this is plausible at some level, but the denser conditions in H II regions might also be expected to cause brighter optical (radiative) SNRs since the shock emissivity increases as the density squared. Scanning through the optical SNR catalogs of nearby galaxies (Blair & Long, 1997; Long et al., 1990; Matonick & Fesen, 1997, to name a few), one can find a number of stunning counter examples to the “confusion” hypothesis. There are often bright optical SNRs found in confused regions and adjacent to bright H II region emission. The mechanism we propose in §4.2 seems to be a more plausible explanation for why the optical SNR searches miss some SNRs and not others in confused regions. If a supernova occurs close enough to ionizing stars, the potential bright optical SNR emission in H and S II is prevented from forming and no optical SNR can be detected, especially against bright nebular emission.
Our investigation of SNR 00577226, however, demonstrates that bright FUV emission lines are still present in such a situation and may provide an alternate way of not only detecting but studying such SNRs in detail. Detecting SNRs with higher ions circumvents the problems of truncated recombination and bright background emission. Stellar photoionization will not prevent the production of high ions nor will they be contaminated significantly by surrounding nebular emission. Our observations have shown that in a bright H II region, the detection of localized emission from high-ionization species such as O VI can provide a clear signature of SNR emission. Position 1 lies on the edge of the SNR and shows strong emission in O VI and C III. Position 2 lies outside the remnant but still within bright optical emission; yet no line emission is present. In conjunction with radio and X-ray data, such a detection is conclusive. We note however that the use of the FUV is restricted to lines of sight where extinction is low. Nearby extragalactic targets such as the Magellanic Clouds and Local Group galaxies will be the easiest to investigate with this technique.
5 Summary
We see strong emission in O VI and C III at a position on the eastern X-ray edge of SNR 00577226. Absorption in these same ions is seen at 300 km s-1 toward the bright LBV system HD 5980 which lies behind the remnant. Another position away from the remnant but within the bright nebular extent of N66 shows no FUV line emission. The remnant lies on the near side of N66 and the O VI is formed in shocks as the blast wave encounters the denser material of the nebula.
Seven longslit echelle spectra in H and [N II] show that N66 has turbulence similar to other Magellanic H II regions. Two slowly expanding features are seen: the compact H II region N66C and a bright shell around the core of NGC 346. Three of the echelle spectra show faint patches of H emission at high and low velocities which appear as a rough expansion feature corresponding spatially and kinematically to SNR 00577226.
Observed C III and O VI flux compared with shock models allows us to estimate the shock velocity and determine the ambient density and ram pressure at Position 1. We use observed column depths from Hoopes et al. (2001) and Koenigsberger et al. (2001) to derive the shock velocity and density of the SNR shock toward HD 5980. These values are in good agreement with each other and with other values in the literature.
Weak H emission as well as low column densities of low-ionization species such as Fe II show that the ionization balance in the post-shock gas is affected by ionizing stellar photons. The ionizing flux from the many hot stars in NGC 346 is sufficient to keep swept-up material out of ionization equilibriuim. This highlights the importance and inherent difficulty of looking for SNRs in bright H II regions. Direct optical identification is complicated by the bright nebular emission. FUV emission and absorption, along with X-ray and radio observations, are good ways to circumvent these difficulties.
The authors wish to acknowledge useful discussion with Charles Hoopes, Miroslav Filipović, Lister Staveley-Smith and Alex Fullerton. Mike Corcoran provided the X-ray images. Chris Smith supplied the interference filters used in the Schmidt imagery. Bryan Dunne helped with the echelle observations. Robert Kennicutt supplied the flux-calibrated image of N66. John Raymond made available the shock code used in calculating the models. We would also like to recognize CTIO for providing the excellent observing facilities and travel support. This work contains data obtained for the Guaranteed Time Team by the NASA-CNES-CSA FUSE mission operated by the Johns Hopkins University. Financial support has been provided by NASA contract NAS5-32985.
References
- Barbá et al. (1995) Barba, R. H., Niemela, V. S., Baume, G., & Vazquez, R. A. 1995, ApJ, 446, L23
- Blair et al. (1991) Blair, W. P., et al. 1991, ApJ, 379, L33
- Blair & Long (1997) Blair, W. P., & Long, K. S. 1997, ApJS, 108, 261
- Blair et al. (1989) Blair, W. P., Raymond, J. C., Danziger, J., Matteucci, F. 1989, ApJ, 338, 812
- Blair, Sankrit, & Tulin (2002) Blair, W. P., Sankrit, R., & Tulin, S. M. 2002, ApJS, 140, 367
- Chu & Kennicutt (1988) Chu, Y-H., & Kennicutt, R. C. 1988, AJ, 95, 1111
- Chu & Kennicutt (1994) Chu, Y-H., & Kennicutt, R. C. 1994, Ap&SS, 216, 253
- Danforth, Blair, & Raymond (2001) Danforth, C. W., Blair, W. P., & Raymond, J. C., 2001, AJ, 122, 938
- Danforth et al. (2002) Danforth, C. W., Howk, J. C., Fullerton, A. W., Blair, W. P., & Sembach, K. R. 2002, ApJS, 139, 81
- de Boer & Savage (1980) de Boer, K. S., & Savage, B. D. 1980, ApJ, 238, 86
- Fesen, Blair, & Kirshner (1982) Fesen, R. A., Blair, W. P., & Kirshner, R. P. 1982, ApJ, 262, 171
- Filipović et al. (2003) Filipović, M., Staveley-Smith, L., Ried, W., & Danforth, C. W., 2003, in prep.
- Fitzpatrick & Savage (1983) Fitzpatrick, E. L. & Savage, B. D. 1983, ApJ, 267, 93
- Gordon et al. (1999) Gordon, S. M., Duric, N., Kirshner, R. P., Goss, W. M., & Viallefond, F. 1999, ApJS, 120, 247
- Gordon et al. (1998) Gordon, S. M., Kirshner, R. P., Long, K. S., Blair, W. P., Duric, N., & Smith, R. C. 1998, ApJS, 117, 89
- Hoopes et al. (2001) Hoopes, C. G., Sembach, K. R., Howk, J. C., & Blair, W. P. 2001, ApJ, 558, L35
- Hutchings & Giasson (2001) Hutchings, J. B., & Giasson, J. 2001, PASP, 113, 1205
- Howk et al. (2002) Howk, J. C., Savage, B., Sembach, K. R., & Hoopes, C. G. 2002, ApJ, 572, 264
- Inoue, Koyama, & Tanaka (1983) Inoue, H., Koyama, K., & Tanaka, Y. 1983, IAUS, 101, 535
- Jenkins & Wallerstein (1995) Jenkins, E. B., & Wallerstein, G. 1995, ApJ, 440, 227
- Kahn et al. (1985) Kahn, S. M., Gorenstein, P., Harnden, F. R., & Seward, F. D. 1985, ApJ, 299, 821
- Kennicutt (1984) Kennicutt, R. C. 1984, ApJ, 287, 116
- Kennicutt & Hodge (1986) Kennicutt, R. C., & Hodge, P. 1986, ApJ, 306, 130
- Koenigsberger et al. (1995) Koenigsberger, G., Guinan, E., Auer, L., & Georgiev, L. 1995, ApJ, 452, L107
- Koenigsberger et al. (2001) Koenigsberger, G., et al. 2001, AJ, 121, 267
- Lacey, Duric, & Goss (1997) Lacey, C. K., Duric, N., & Goss, W. M. 1997, ApJS, 108, 417
- Long et al. (1990) Long, K. S., Blair, W. P., Kirshner, R. P., & Winkler, P. F. 1990, ApJS, 72, 61
- Massey, Parker, & Garmany (1989) Massey, P., Parker, J. W., & Garmany, C. D. 1989, AJ, 98, 1305
- Matonick & Fesen (1997) Matonick, D. M., & Fesen, R.A. 1997, ApJS, 112, 49
- Mills et al. (1982) Mills, B. Y., Little, A. G., Durdin, J. M., & Kesteven, M. J. 1982, MNRAS, 200, 1007
- Moos et al. (2000) Moos, H. W., et al. 2000, ApJ, 538, L1
- Nazé et al. (2002) Nazé, Y., et al. 2002, ApJ, in press
- Osterbrock (1989) Osterbrock, D. E. 1989, “Astrophysics of Gaseous Nebulae and Active Galactic Nuclei”, University Science Books, Mill Valley, CA
- Pannuti et al. (2000) Pannuti, T. G., Duric, N., Lacey, C. K., Goss, W. M., Hoopes, C. G., Walterbos, R. A. M., & Magnor, M. A. 2000, ApJ, 544, 780
- Pannuti et al. (2002) Pannuti, T. G., Duric, N., Lacey, C. K., Ferguson, A. N. M., Magnor, M. A., & Mendelowitz, C. 2002, ApJ, 565, 966
- Parker et al. (1998) Parker, J. W., et al. 1998, AJ, 116, 180
- Raymond (1979) Raymond, J. C. 1979, ApJS, 39, 1
- Raymond et al. (1997) Raymond, J. C., Blair, W. P., Long, K. S., Vancura, O., Edgar, R. J., Morse, J., Hartigan, P., & Sanders, W. T. 1997, ApJ, 482, 881
- Relaño, Peimbert & Beckman (2002) Relaño, M., Peimbert, M., & Beckman, J. 2002, ApJ, 564, 704
- Rho & Petre (1998) Rho, J., & Petre, R. 1998, ApJ, 503, L167
- Russell & Dopita (1990) Russell, S. C., & Dopita, M. A. 1990, ApJS, 74, 93
- Sahnow et al. (2000) Sahnow, D. J., et al. 2000, ApJ, 538, L7
- Sankrit et al. (2001) Sankrit, R., Shelton, R. L., Blair, W. P., Sembach, K. R., & Jenkins, E. B. 2001, ApJ, 549, 416
- Seward & Mitchell (1981) Seward, F. D., & Mitchell, M. 1981, ApJ, 243, 736
- Shull et al. (2000) Shull, J. M., et al. 2000, ApJ, 538, L73
- Smith & Weedman (1970) Smith, M. G., & Weedman, D. W. 1970, ApJ, 161, 33
- Smith & Weedman (1971) Smith, M. G., & Weedman, D. W. 1971, ApJ, 169, 271
- Smith & Weedman (1973) Smith, M. G., & Weedman, D. W. 1973, ApJ, 179, 461
- Sutherland & Dopita (1993) Sutherland, R. S., & Dopita, M. A. 1993, ApJS, 88, 253
- Tumlinson et al. (2002) Tumlinson, J., et al. 2002, ApJ, 566, 857
- Velázquez, Koenigsberger, & Raga (2003) Velázquez, P. F., Koenigsberger, G., & Raga, A. C. 2003, ApJ, 584, in press
- Wang & Wu (1992) Wang, Q., & Wu, X. 1992, ApJS, 78, 391
- Ye, Turtle, & Kennicutt (1991) Ye, T., Turtle, A. J., & Kennicutt, R. C. 1991, MNRAS, 249, 722
- Yokogawa et al. (2000) Yokogawa, J., Imanishi, K., Tsujimoto, M., Nishiuchi, M., Koyama, K., Nagase, F., & Corbet, R. H. D. 2000, ApJS, 128, 491
| Sight Line | RA (J2000) | Dec (J2000) | SpType | FUSEID | AperaaFUSE Apertures: LWRS=30″ square, MDRS=4″20″. | # Exp | ExpTime | Obs Date |
|---|---|---|---|---|---|---|---|---|
| hms | ° ′ ″ | (sec) | ||||||
| NGC 346-WB6 | 00 58 57.74 | 72 10 33.6 | O4V((f)) | P20305bbCombined into composite NGC 346 spectrum. | MDRS | 5 | 10992 | 2001-Sep-25 |
| NGC 346-WB4 | 00 59 00.39 | 72 10 37.9 | O5-6V | P20304bbCombined into composite NGC 346 spectrum. | MDRS | 6 | 11853 | 2001-Aug-25 |
| NGC 346-WB3 | 00 59 01.09 | 72 10 28.2 | O2III(f*) | P20303bbCombined into composite NGC 346 spectrum. | MDRS | 3 | 8482 | 2001-Aug-25 |
| NGC 346-WB1 | 00 59 04.81 | 72 10 24.8 | O4III(n)(f) | P20302bbCombined into composite NGC 346 spectrum. | MDRS | 3 | 4625 | 2001-Aug-25 |
| HD 5980 | 00 59 26.55 | 72 09 53.8 | WN var | P10301 | LWRS | 4 | 5734 | 2000-Jul-02 |
| Sk 80 | 00 59 31.95 | 72 10 45.8 | O7 Iaf+ | P10302 | LWRS | 4 | 11699 | 2000-Jul-02 |
| N66-Pos 1 | 00 59 42 | 72 09 49 | P20305 | LWRS | 5 | 10992 | 2001-Sep-25 | |
| N66-Pos 2 | 00 59 37 | 72 07 57 | P20302 | LWRS | 3 | 4625 | 2001-Aug-25 |
| Target | RA (J2000) | Dec (J2000) | PA | ExpTime | Date |
|---|---|---|---|---|---|
| hms | ° ′ ″ | ° | sec | ymd | |
| HD 5980 NS | 00 59 26.55 | -72 09 53.8 | 0 | 1200 | 2001-Dec-24 |
| HD 5980 EW | 00 59 26.55 | -72 09 53.8 | 90 | 1200 | 2001-Dec-25 |
| Sk80 NS | 00 59 31.95 | -72 10 45.8 | 0 | 1200 | 2001-Dec-26 |
| Sk80 EW | 00 59 31.95 | -72 10 45.8 | 90 | 600 | 2000-Dec-10 |
| NGC 346-WB6 | 00 58 57.74 | -72 10 33.6 | 90 | 600 | 2000-Dec-10 |
| NGC 346-WB3+4 | 00 59 01.09 | -72 10 28.2 | 197 | 600 | 2000-Dec-10 |
| NGC 346-WB1 | 00 59 04.81 | -72 10 24.8 | 0 | 600 | 2001-Dec-26 |
| Line / vs (km s-1) | 140 | 150 | 160 | 170 | 180 | 190 | 200 |
|---|---|---|---|---|---|---|---|
| H 6563 | 100 | 100 | 100 | 100 | 100 | 100 | 100 |
| S VI 937 | 12 | 19 | 18 | 20 | 23 | 27 | 30 |
| C III 977 | 352 | 304 | 275 | 258 | 247 | 239 | 232 |
| N III 991 | 17 | 13 | 12 | 11 | 10 | 10 | 10 |
| Ne VI 1006 | 0 | 1 | 4 | 12 | 27 | 45 | 58 |
| O VI 1034 | 9 | 90 | 334 | 708 | 996 | 1156 | 1236 |
| S IV 1070 | 11 | 8 | 8 | 7 | 7 | 7 | 7 |
| Ne V 1146 | 3 | 8 | 13 | 18 | 24 | 27 | 28 |
| N V 1240 | 17 | 27 | 23 | 23 | 24 | 24 | 24 |
| Si IV 1397 | 31 | 28 | 26 | 25 | 24 | 24 | 23 |
| O IV] 1402 | 100 | 112 | 108 | 101 | 97 | 94 | 92 |
| N IV] 1490 | 9 | 7 | 6 | 5 | 5 | 5 | 5 |
| C IV 1549 | 211 | 174 | 156 | 148 | 145 | 142 | 140 |
| O III] 1662 | 59 | 52 | 47 | 44 | 42 | 41 | 40 |
| N III] 1748 | 6 | 5 | 4 | 4 | 4 | 4 | 4 |
| I(H)aaFlux units are 10-5 erg s-1 cm-2 into 2 steradian for no=1 cm-3 and SMC abundances. | 1.268 | 1.551 | 1.819 | 2.048 | 2.249 | 2.431 | 2.622 |