Institut für Experimentelle Kernphysik, University of Karlsruhe,
and Institut für Kernphysik, Forschungszentrum Karlsruhe,
P.O. Box 3640, 76021 Karlsruhe, Germany
THE CHEMICAL COMPOSITION OF COSMIC RAYS 111Invited
paper presented at Vulcano Workshop 2002: “Frontier Objects in
Astrophysics and Particle Physics”,
e-mail: Karl-Heinz.Kampert@ik.fzk.de
Abstract
A brief review about the chemical composition of cosmic rays in the energy range eV is given. While there is convincing evidence for an increasingly heavier composition above the knee, no clear picture has emerged at the highest energies, yet. We discuss implications about the origin of cosmic rays and emphasize systematic differences related to data analysis techniques and to the limited understanding of the air shower development.
1 Introduction
When being asked to formulate the most crucial, yet unanswered questions about crs, one likely would end up with a list as such:
-
1.
Where and what are the sources of high energy crs?
-
2.
How does the transport from the source(s) to the solar system affect their properties?
-
3.
What is the origin of structures observed in their energy distributions?
-
4.
Is there an upper end to the energy spectrum?
The enormous interest particularly in the highest energy crs originates also from the fact that they provide a direct link to the problems of understanding the evolution of the early universe and to physics beyond the standard model of particle physics in an energy range not accessible to man-made accelerators.
The chemical composition of crs measured as a function of their energy provides a key to the answers of above questions and large efforts have been undertaken to provide reliable experimental data for comparison with models of cr origin. In fact, direct cr measurements performed at energies up to energies of several GeV have provided a great deal of information about the source composition, propagation effects, the ‘age’ of crs, etc. However, for eas experiments the situation has been proven much harder than expected. This is mostly because of the large fluctuations of eas parameters and because of uncertainties in corresponding eas simulations. Nevertheless, significant progress has been made in recent years and we have reached a point where high quality eas data and models of cr origin and acceleration can be confronted to each other. The information extracted from such measurements may be complemented by high energy (TeV) gamma and neutrino radiation. The latter messengers point directly to the source but are only secondary probes since they originate from interactions of crs with the local environment at the source. Understanding the common picture of photons, neutrinos and high quality cr energy and composition data may finally yield a conclusive picture to the open cr-questions of the century.
2 Experimental Results
The energy spectrum of crs follows a simple power law behaviour () over many orders of magnitude. There are only two well established structures in the cr spectrum; the knee at PeV where the index changes from to 3.1 and the ankle at EeV where the spectrum turns up again. The origin of the structures, however, remains unknown as is the existence or non-existence of the Greisen-Zatsepin-Kuzmin cut-off. Since structures in a spectrum generally contain important information, many experiments have focussed to study these energy ranges. However, due to the low flux of high energy crs, all of these structures are accessible only to eas experiments. The primary energy and composition is then inferred either from particle measurements at ground or from Cherenkov and fluorescence light observations, or from combinations of both. Major particle arrays in operation or still delivering newly analysed data include: agasa, casa-mia, eas-top, grapes, Haverah Park, hegra, kascade, Maket-Ani, msu, spase, and Tibet-As. Eas experiments exploiting optical observations include: blanca, dice, Fly’s Eye, hegra, HiRes, and tunka. A brief overview about most experiments and their observational techniques can be found in Refs. [1, 2].
Previous results about the cr composition were reported e.g. in [3, 4]. The traditional and perhaps most sensitive technique to infer the cr composition from eas data is based on measurements of the electron () and muon numbers () at ground. For consistency tests or for improving the sensitivity, and may be complemented by additional eas parameters, such as the electron lateral distribution (ldf), muon production height, hadronic observables, particle arrival times, etc.
Cherenkov and fluorescence observations are restricted to clear moonless night which imposes a maximum duty cycle of approx. 10 %. In non-imaging Cherenkov measurements the composition is inferred from the steepness of the lateral Cherenkov light intensity at distances up to 120 m from the shower core. Instead of presenting the Cherenkov ldf for comparison with eas simulations, many experiments have preferred to introduce another intermediate step by inferring the maximum of the longitudinal shower development, , by means of eas simulations so that only in a second step these inferred values are compared with eas simulations. Obviously, this introduces additional systematic uncertainties and may result in inconsistencies when for example different hadronic interaction models are applied to the (Ch-light intensity energy )- and (Ch ldf )-relations on the one hand and to the distributions of eas simulations employing different hadronic interaction models on the other. Up to now, only fluorescence measurements allow direct measurements of from observations of the longitudinal shower profile.
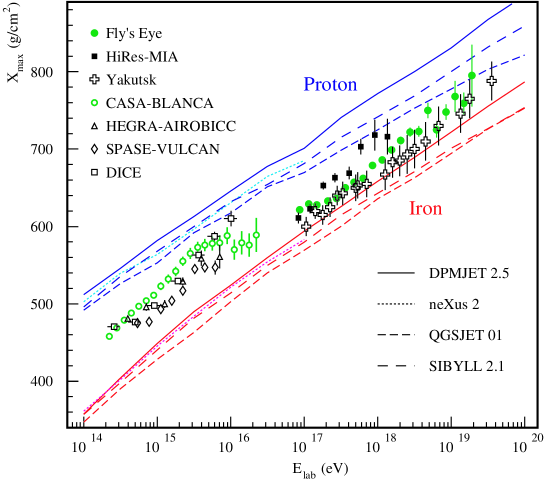
A compilation of experimental results on is shown in Fig. 1 for a wide range of primary energies [5]. The data are compared to corsika simulations using different hadronic interaction models. As can be seen from that figure, differences between the models are on the order of 25 g/cm2 in the knee region and increase to about 40 g/cm2 at higher energies. Systematic uncertainties in the data are estimated to at least be of similar size. Again, besides the shifts seen in the simulated -lines, also the experimental -values of the Cherenkov data may shift when extracted using different interaction models. With these uncertainties kept in mind, all data seem to suggest a mixed composition over the whole range of energies with no clear picture emerging about a change in the composition. Only the casa-blanca [6] and spase-vulcan [7] data may indicate a lighter composition towards the knee with a turnover to a heavier one above the knee. The Cherenkov imaging experiment dice [8] appears to contradict that picture. However, electronic saturation effects were recently discussed to have biased their data [9]. The weak indication from light to heavy when crossing the knee is followed by a trend back towards a mixed-light composition in the energy range - eV in the HiRes-Mia data [10]. The original Fly’s Eye data suggest a heavy dominated composition with a much weaker change to a lighter composition only around eV [11]. In addition to experimental effects large uncertainties are added by the poorly understood hadronic interaction models at these high energies.
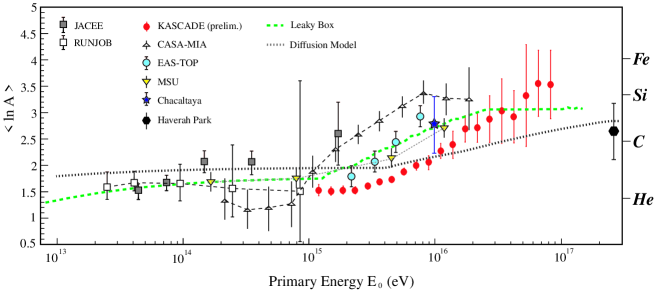
Data from eas arrays are mostly presented in terms of the mean logarithmic mass, . Despite the drawbacks of this observable [1] we shall follow this approach to ease the comparison of data from different experiments. Figure 2 shows a compilation of several ground arrays. Data from the balloon borne experiments Jacee [12] and Runjob [13] and results from a simplified leaky-box [14] and diffusion model calculation assuming a knee at a constant rigidity of 4 PV [15] are included for comparison. All eas arrays observe a change towards a heavier composition across the knee. However, absolute differences between experiments up to are found in the transition region. As comparisons between qgsjet and neXus indicate [16], another overall shift by should be added from uncertainties in the interaction models. The eas data presented in Fig. 2 were all analysed with reference to corsika/qgsjet. Reasonably good agreement is seen also between eas data and direct measurements from the Runjob Collaboration favouring an almost constant composition from approx. to eV. Jacee on the other hand suggests an increasingly heavier composition starting already at approx. eV. The cause of this difference is not fully understood. Helium fluxes in Runjob data are lower by a factor of 2 as compared to Jacee and, perhaps more importantly, Jacee attributes sub-Fe elements to the Fe-group thereby increasing the values. The kascade data shown in Fig. 2 result from an unfolding procedure of the - and -size distributions [23] and perhaps provide the best clue to the knee puzzle. The preliminary data convincingly show knee structures in energy spectra selected by primary mass groups. Furthermore, their knee position changes towards higher energies with increasing mass of the primaries. Detailed examination of the individual knee positions suggest a constant rigidity for all components [23, 24] as is expected in astrophysical acceleration and transport models.
The only composition analysis above eV based on a ground array and using state of the art eas simulations has recently been presented by the Haverah Park group [22]. Their analysis is based on the shape of the observed lateral distribution function derived from the water-Cherenkov signals. Assuming a constant bi-modal composition in the energy range 0.2-1.0 EeV best agreement to the data is found for % protons and the rest iron. Systematic uncertainties introduced by the choice of hadronic models were estimated to approx. 14 %. This error is included in the data point shown in Fig. 2. Within error bars, this finding is in agreement to the kascade results at lower energies. Furthermore, there may a turnover back towards a medium-light composition at higher energies. Such a change is indeed reported by fluorescence measurements of the HiRes prototype working jointly with the mia muon array for energy determination [10] and has been reported to some extend also by the Fly’s Eye collaboration [11] (see above). However, quantitatively there are still significant differences in the composition at energies above eV so that the question appears far from being resolved.
3 Final Remarks and Outlook
A variety of experimental techniques is applied to infer the energy and mass of crs from eas. In the knee region, two approaches have been proven successful: extended particle arrays measuring electrons, muons, and high energy hadrons on the one side and non-imaging Cherenkov measurements on the other. At the highest energies, the Cherenkov technique becomes impractical but fluorescence observations take over. The wide scattering of reconstructed data points in any of the approaches, even when employing the same hadronic interaction model, may hint to hidden experimental systematics and/or to incomplete data analysis techniques in at least some cases. Indeed, the data analysis is complicated by many subtle details: the energy spectrum is very steep but (i) shower fluctuations are in general very large, (ii) they depend strongly on the (to be reconstructed) mass of the primary particle and, if not corrected for, (iii) their effect mimics a primary dependent increase of fluxes which in addition depends on the steepness of the underlying elemental spectra. As a consequence of the latter, the mass dependent changes of the spectral indices at the individual knee positions causes a bias towards a lighter composition above the knee. Whether that effect is responsible for the apparent dip towards light masses seen in knee region of the Cherenkov data (see Fig. 1) cannot be said at present. Furthermore, on top of these complications, experimental reconstruction accuracies generally dependent on the primary energy and mass and have to be carefully corrected for as well. Clearly, sophisticated data analysis techniques are required, such as unfolding procedures which do not make any assumption about the shape of the individual primary energy spectra or about their relative abundances. Very promising results have recently been presented by the kascade collaboration [23, 24] and the techniques may be applied also to other existing experimental data. The present limitation of such approaches is, besides the available Monte Carlo statistics, mostly given by the reliability of the simulated tails in the used eas observables.
The situation at higher energies becomes more complicated mostly because of increasing uncertainties of interaction models. Akeno, Fly’s-Eye [25], and HiRes-Mia measure a composition rich in Fe at eV which may become lighter at higher energies. On the other hand recent analyses of Haverah Park data indicate a mostly light composition already above eV [22].
With these limitations in mind, what can be learned from the present eas data? There appears convincing evidence for a change from a ‘standard’ light (p+He dominated) composition to a heavy one (Si or heavier) in the energy range from the knee to about eV. According to preliminary kascade data, this change in composition is caused by subsequent ‘breaks’ in the energy spectra of the different elements. The data also provide support for the knee being an effect of constant rigidity at eV, such as is expected in astrophysical models for confinement and/or acceleration in magnetic fields. The iron knee would then be expected at eV. It will be interesting to confront such data with detailed model predictions. If the knee in the spectra is mostly due to galactic modulation, the question arises about to which energies the Fe-group could dominate the all-particle flux and to where the extragalactic component would take over. As recently argued by Berezinsky et al., this transition could occur at energies even lower than eV so that the composition naturally would become light again.
To conclude, enormous progress has been made in recent years in measuring the cr composition more accurately than in earlier generations of eas experiments. This is particularly true for the energy range of the knee but new analyses have also been reported at higher energies. Besides further improving the data analysis techniques, a wealth of new data at high energies will become available in the very near future from kascade-grande, HiRes, the Pierre Auger Observatory, and in the more distant future possibly from space experiments like euso and owl providing the required input for solving the open questions about crs .
Acknowledgement: It is a pleasure to thank the organizers of the Vulcano Workshop 2002 for their invitation and for setting up such an interesting and fruitful meeting in a very pleasent atmosphere. This work has been supported in part by the German Ministry for Research and Education.
References
- [1] K.-H. Kampert, J. Phys. G27 (2001) 1663.
- [2] S. Swordy et al., Astropart. Phys. 18 (2002) 129.
- [3] A. Castellina, Nucl. Phys. B (Proc. Suppl.) 97 (2001) 35.
- [4] J. Hörandel, Astropart. Phys. in press (astro-ph/0210453).
- [5] D. Heck et al., 27th ICRC Hamburg, 1999, p233.
- [6] J.W. Fowler et al., Astropart. Phys. 15 (2001) 49.
- [7] J.E. Dickinson et al., 26th ICRC Salt Lake City (1999) Vol. 3. p.136.
- [8] D. Kieda et al., 26th ICRC Salt Lake City, Vol. 3, p. 191, 1999.
- [9] C.G. Larsen, D.B. Kieda, and S.P. Swordy, 27th ICRC Hamburg, 1999, p134.
- [10] T. Abu-Zayyad et al., Phys. Rev. Lett. 84 (2000) 4276.
- [11] D.J. Bird et al., Phys. Rev. Lett. 71 (1993) 3401.
- [12] K. Asakamori et al., Ap. J. 502 (1998) 278.
- [13] A.V. Apanasenko et al., Astropart. Phys. 16 (2001) 13
- [14] S. Swordy, 24th ICRC, Rome, 2 (1995) 697
- [15] D. Maurin, M. Casse, E. Vangioni-Flam, Astropart. Phys. (2002) in press.
- [16] J. van Buren, Diploma Thesis, University Karlsruhe (2002).
- [17] H. Ulrich et al., Nucl. Phys. B (Proc. Suppl.) 2002.
- [18] M.A.K. Glasmacher et al., Astropart. Phys. 12 (1999) 1.
- [19] B. Alessandro et al., 27th ICRC, Hamburg, (2001) 124.
- [20] Yu.A. Fomin et al., J. Phys. G 22 (1996) 1839.
- [21] C. Aguirre et al., Phys. Rev. D 62 (2000) 032003.
- [22] M. Ave et al., Astropart. Phys. in press; astro-ph/0203150.
- [23] H. Ulrich et al., 27th ICRC, Hamburg, (2001) 97
- [24] K.-H. Kampert et al., Invited, Rapporteur, and Highlight papers of ICRC 2001, p240
- [25] B.R. Dawson, R. Meyhandan, and K.M. Simpson, Astropart. Phys. 9 (1998) 311,
- [26] V. Berezinsky, A. Gazizov, and S. Grigorieva preprint astro-ph/0210095.