Abstract
We demonstrate a strong correlation between supermassive black hole (SMBH) mass and the global structure of ellipticals and bulges: more centrally concentrated bulges and ellipticals (higher Sérsic index ) host higher-mass black holes. This correlation is as good as that previously found between SMBH mass and central velocity dispersion, with comparable scatter. In addition, by carefully modeling the bulges of disk galaxies so that bars, inner disks, and the like do not accidentally contribute to bulge light, we find that the correlation between SMBH mass and bulge or elliptical luminosity is similarly close.
Chapter 0 The Correlation Between Supermassive Black Hole Mass and the Structure of Ellipticals and Bulges
1 Introduction
Observations now show that supermassive black holes (SMBHs; - ) are probably present at the centers of most, if not all, elliptical galaxies and bulges (collectively, “bulges”). More recent studies found a strong correlation between SMBH mass and the central stellar velocity dispersion of bulges (Ferrarese & Merritt 2000; Gebhardt et al. 2000), much stronger than the previous correlation found between bulge luminosity and SMBH mass (Magorrian et al. 1998).
Graham, Trujillo, & Caon (2001a) have shown that the central concentration of bulge light , measured within the half-light radius , positively correlates with of the bulge. In addition, Graham (2002b) found that the Sérsic (1968) index , determined from fits to bulge light profiles, correlated extremely well with . Taken together, this suggests that there may be a correlation between SMBH mass and the global structure of bulges. Here, we demonstrate that such a correlation does indeed exist: more concentrated bulges (higher Sersic index ) have more massive SMBHs. (A preliminary version of this correlation, using , was presented in Graham et al. 2001b). This correlation is as strong as that between SMBH mass and stellar velocity dispersion, and has comparable scatter.
By taking care in isolating and accurately modeling the bulges of disk galaxies, it is possible to make more accurate estimates of bulge luminosity. This lets us re-evaluate the relation between bulge luminosity and SMBH mass and avoid scatter introduced by, e.g., assigning a fixed fraction of a disk galaxy’s light to the bulge based solely on its Hubble type. The result is that the correlation between -band luminosity and SMBH mass proves to be almost as strong as the - and - correlations, with similar scatter.
2 Data and Analysis
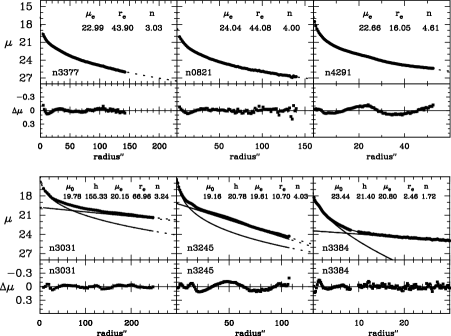
We searched the public archives for -band galaxy images which were large enough to guarantee good sky subtraction (galaxy well within the field of view) and which had no central saturation. Most of the images came from the Isaac Newton Group and Hubble Space Telescope (HST) archives; we used some -band (F814W) images from HST if there were no -band (F702W) images available. We found useful images for 21 of the 30 galaxies with “reliable” SMBH measurements (Table 1 in Merrit & Ferrarese 2001). The galaxy isophotes of the reduced, sky-subtracted images were fit with ellipses. We then fit the resulting major-axis surface brightness profiles with seeing-convolved Sérsic models for the ellipticals and a combined, seeing-convolved exponential disk + Sérsic bulge model for the disk galaxies (Figure 1). In several cases, fitting the global profile of disk galaxies — particularly when strong bars are present — can badly mismeasure the bulge; special care was needed in those cases (see Bulge-Disk Decomposition, below). We excluded the inner pc from the fits, to avoid contamination of the profiles by power-law cores, stellar or active nuclei, and nuclear disks.
Black hole masses and central velocity dispersions were taken from the compilation of Merritt & Ferrarese (2001), with updated black hole masses from Gebhardt et al. (2002). We used aperture photometry from the literature to photometrically calibrate -band profiles for 13 galaxies. Bulge absolute magnitudes for these galaxies were then calculated using the best-fit Sérsic model and surface-brightness fluctuations distances from Tonry et al. (2001) or kinematic distances from LEDA (with ). The central concentration was calculated from the Sérsic index (Graham et al. 2001a); preliminary results using were presented in Graham et al. 2001b.
1 Bulge-Disk Decomposition; Distinguishing Ellipticals from S0’s
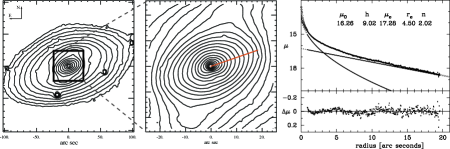
Critical to determining both the structure and luminosity of bulges in disk galaxies is the proper separation of the bulge from other galaxy components: not just from the main disk, but also from bars, lenses, and inner disks. We made a careful analysis of each disk galaxy, identifying cases where global bulge-disk decomposition would not work. In some galaxies, the existence of a lens or inner disk allowed us to make exponential + bulge decompositions without using the outer disk (e.g., NGC 2787 in Figure 2; see Erwin et al. 2003 for a detailed discussion of this galaxy, including how a global bulge-disk decomposition mismeasures the bulge). For the Milky Way, we used the perpendicular near-IR profile of Kent, Dame, & Fazio 1991 as the bulge profile.
Equally important is identifying disk galaxies which have been misclassified as ellipticals, since otherwise a disk + bulge structure will be erroneously described with a single (Sérsic) model. Using information from the literature, including the kinematic study by Rix, Carollo, & Freeman (1999), along with morphological and photometric information, we found that NGC 2778 and NGC 4564 are probably S0 galaxies, despite their previous classification as ellipticals. We follow Graham (2002a) in classifying M32 as a probable stripped S0, in which the bulge resides within a remnant exponential disk/envelope.
3 Results and Discussion
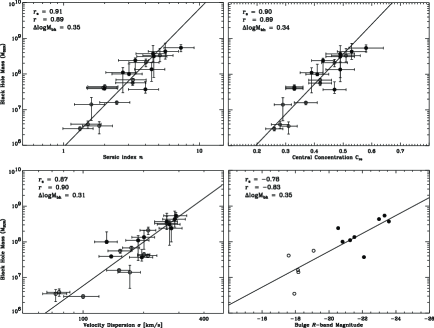
We find a strong correlation between the central SMBH mass and its host galaxy’s bulge structure, as measured by the Sérsic index (or by central concentration ; Graham et al. 2001b), such that more centrally concentrated galaxies (higher ) have more massive black holes. This correlation is as good as that previously found between and the central velocity dispersion, when the same galaxies are compared (Figure 3). In addition, by identifying S0 galaxies misclassified as ellipticals and making careful bulge-disk decompositions — including the avoidance of bars and the accomodation of other components such as inner disks — we find bulge luminosities for these galaxies which also correlate well with SMBH mass (McLure & Dunlop 2002 found a similary tight correlation by considering only elliptcal galaxies.). The scatter in for these three relations is comparable (0.31 -0.35 dex).
We thus have four closely-linked quantities — , central velocity dispersion, bulge luminosity, and global bulge structure — which are well correlated at least over the range - . Models which explain SMBH formation and growth ultimately need to address all three SMBH-bulge relations; explanations which rely primarly on one quantity (e.g., bulge mass or central velocity dispersion) need to explain why the other quantities correlate so well.
It is worth noting that using the - relation to estimate SMBH masses — or to study SMBH-bulge evolution with redshift — has several advantages over the - and - relations. Measurements of require only (uncalibrated) images, and are thus less expensive in terms of telescope time than the spectroscopic observations needed to determine . Measurements of are also not sensitive to uncertainties in, e.g., distance or Galactic extinction.
Finally, the existence of a clear relation between and SMBH mass is further proof that bulges are not homologous: not all ellipticals have de Vaucouleurs () profiles, and spiral and S0 bulges cannot simply be classified as either de Vaucouleurs or exponential ().
References
- [1] Akritas, M. G., & Bershady, M. A. 1996, ApJ, 470, 706
- [2] Erwin, P., Vega Beltrán, J. C., Graham, A. W., & Beckman, J. E. 2003, ApJ, submitted
- [3] Ferrarese, L., & Merritt, D. 2000, ApJ, 539, L9
- [4] Gebhardt, K., et al. 2000, ApJ, 539, L13
- [5] Gebhardt, K., et al. 2002, ApJ, in press
- [6] Graham, A. W., Trujillo, I., & Caon, N. 2001a, AJ, 122, 1707
- [7] Graham, A. W., Erwin, P., Caon, N., & Trujillo, I. 2001b, ApJ, 563, L11
- [8] Graham, A. W. 2002a ApJ, 568, L13
- [9] Graham, A. W. 2002b, MNRAS, 334, 859
- [10] Kent, S. M., Dame, T., & Fazio, G. 1991, ApJ, 378, 131
- [11] Magorrian, J., et al. 1998, AJ, 115, 2285
- [12] McLure, R. J., & Dunlop, J. S. 2002, MNRAS, 331, 795
- [13] Merritt D., & Ferrarese, L. 2001, in The Central Kpc of Starbursts and AGN: the La Palma Connection, eds. J. H. Knapen, J. E. Beckman, I. Shlosman, & T. J. Mahoney (San Francisco: ASP), 85
- [14] Rix, H.-W., Carollo, C. M., & Freeman, K. 1999, ApJ, 513, L25
- [15] Sérsic, J.-L. 1968, Atlas de Galaxias Australes (Cordoba: Obs. Astron.)
- [16] Tonry, J. L., et al. 2001, ApJ, 546, 681