Deep XMM-Newton observation of a northern LMC field:
I. Selected X-ray sources
††thanks: XMM-Newton is an ESA Science Mission
with instruments and contributions directly funded by ESA Member
states and the USA (NASA)
First results from a deep XMM-Newton observation of a field in the Large Magellanic Cloud (LMC) near the northern rim of the supergiant shell LMC 4 are presented. Spectral and temporal analyses of a sample of selected X-ray sources yielded two new candidates for supernova remnants, a supersoft X-ray source and a likely high mass X-ray binary (HMXB) pulsar. From the fourteen brightest sources up to ten are active galactic nuclei in the background of the galaxy which can be used as probes for the interstellar medium in the LMC. From the three previously known HMXBs the Be/X-ray binary EXO 053109-6609.2 was the brightest source in the field, allowing a more detailed analysis of its X-ray spectrum and pulse profile. During the pulse EXO 053109-6609.2 shows eclipses of the X-ray emitting areas with increased photo-electric absorption before and after the eclipse. The detection of X-ray pulsations with a period of 69.2 s is confirmed for RX J0529.8-6556 and a possible period of 272 s is discovered from XMMU J053011.2-655122. The results are discussed with respect to individual sources as well as in the view of source population studies in the vicinity of the supergiant shell LMC 4.
Key Words.:
galaxies: individual: LMC – ISM: supernova remnants – quasars: general – X-rays: galaxies – X-rays: stars – stars: neutron1 Introduction
Due to their proximity the Large and Small Magellanic Cloud (LMC, SMC) were always subject to X-ray surveys for satellites carrying imaging instruments. The most sensitive and most complete survey is available from ROSAT data obtained between 1990 and 1998 in the energy range 0.1–2.4 keV. In particular pointed observations with the PSPC detector with its large field of view covered in total 59 and 18 square degrees of the LMC and SMC regions on the sky (Haberl & Pietsch 1999; Haberl et al. 2000). The ROSAT PSPC and HRI observations revealed about 1000 and 750 X-ray sources in the direction of the LMC and SMC, respectively (see also Sasaki et al. 2000a, b).
The large number of X-ray sources in the Magellanic Cloud fields allows population studies on rich samples of various kinds of source types powered by different mechanisms. An unusually high concentration of Be/X-ray binary systems was found in the SMC (Haberl & Sasaki 2000). Detectors sensitive to higher energies on board ASCA and XTE detected pulsations from many new Be/X-ray transients during outburst (Yokogawa et al. 2002). The high sensitivity of the XMM-Newton instruments promises the detection of pulsations to much lower X-ray fluxes (Sasaki et al. 2001) usually observed from Be/X-ray binaries in their low state.
To study the source population in the LMC to flux limits below erg cm-2 s-1 a deep 60 ks XMM-Newton observation was performed as part of the telescope scientist guaranteed time. The selected field, aimed at RA = 05h31m20s and Dec = –65°57′38″, was chosen because of its location on the rim of the supergiant shell (SGS) LMC 4 (Meaburn 1980) and the simultaneous coverage of three known high mass X-ray binaries (HMXBs). These are : 1) The Be/X-ray binary pulsar EXO 053109-6609.2 discovered in outburst during EXOSAT observations of the LMC X-4 region in 1983 (Pakull et al. 1985). X-ray pulsations with a pulse period of 13.7 s were detected for the first time in ROSAT data by Dennerl et al. (1996). 2) An outburst observed from RX J0529.8-6556 by ROSAT and the detection of 69 s X-ray pulsations led to the suggestion by Haberl et al. (1997) that RX J0529.8-6556 is also a Be/X-ray binary. Optical spectroscopy by Negueruela & Coe (2002) confirmed this. 3) The highly variable source RX J0532.5-6551 proposed as first HMXB in the LMC powered by accretion from the wind of an OB supergiant companion (Haberl et al. 1995) which is supported by optical spectroscopy (Negueruela & Coe 2002).
Active galactic nuclei (AGN) behind nearby galaxies are of interest for two main reasons. They can be used to define a precise reference coordinate system (e.g. Anguita et al. 2000) and provide line of sight probes to study the interstellar medium in the galaxies (e.g. Kahabka et al. 2001; Haberl et al. 2001). The new X-ray observatories Chandra and XMM-Newton will largely increase the number of background AGN as first results from LMC observations demonstrate (Haberl et al. 2001; Dobrzycki et al. 2002).
In this article first results from the deep XMM-Newton observation are presented. The paper concentrates on spectral and temporal analyses of a selected sample of X-ray sources which includes the three known HMXBs and new candidates for supernova remnants (SNRs), a supersoft source (SSS), a likely Be/X-ray binary pulsar and ten candidates for background AGN.
2 The XMM-Newton observation
XMM-Newton (Jansen et al. 2001) observed the field located in the northern part of the LMC during satellite revolution #152 on Oct. 7, 2000 from 03:36 to 22:43 UT with a gap in the middle of about 90 min due to ground station hand-over. A preliminary analysis of the EPIC data, which did not apply proper corrections for telescope vignetting and point spread function, was reported in Haberl (2002). Here results of the analysis of a selected sample of detected X-ray sources are presented utilizing the data collected with the European Photon Imaging Cameras (EPICs). The cameras are based on MOS (EPIC-MOS1 and -MOS2, Turner et al. 2001) and pn (EPIC-pn, Strüder et al. 2001) CCD detectors and are mounted behind the three X-ray multi-mirror systems (Aschenbach et al. 2000) and observe simultaneously. All cameras were operated in Full-Frame read-out mode providing data over a field of view of 13′ radius and used the medium filter to block out optical light. The data were processed using the XMM-Newton analysis package SAS version 5.3.3 to produce the photon event files and binned data products like images, spectra and light curves.
2.1 The LMC field
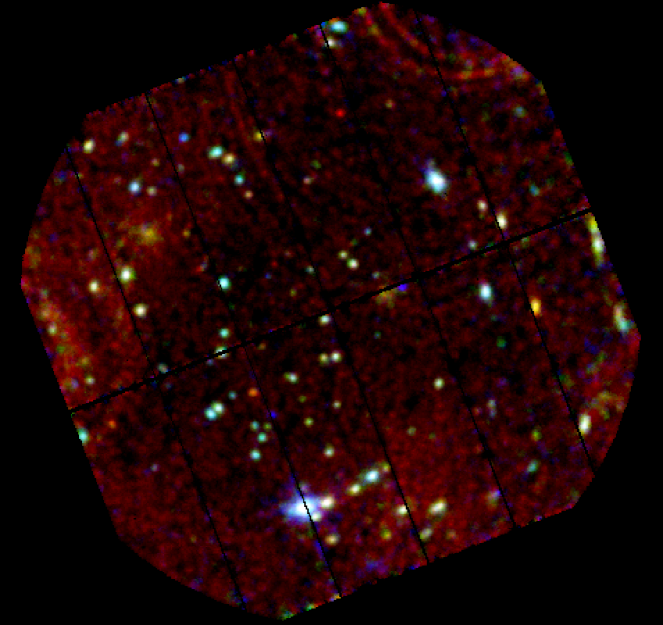
Images were created in the energy bands 0.3–1.0 keV (soft), 1.0–2.0 keV (medium) and 2.0–7.5 keV (hard) and smoothed using intensity-dependent adaptive filtering. Detector-intrinsic particle induced background from an observation with closed filter wheel (on April 5, 2000) was subtracted before each image was corrected for telescope vignetting and exposure. A true colour image was produced by combining the three images and using red, green and blue colour scales to represent the intensities in the soft, medium and hard energy bands, respectively. This RGB image is presented in Fig. 1. According to their spectral energy distribution X-ray sources of different type are characterized by different colours. Sources predominantly radiating in the soft band appear in red while hard sources are blue. Nearby bright sources outside the field of view (an order of magnitude brighter than the brightest source inside the field) cause arc-like structures in the images due to photons which are single-reflected on the mirror shells. Arcs caused by the bright star AB Dor (at 35′ angular distance from the optical axis) can be seen in the NW part of the image. The supernova remnant N63A (an extended source 27′ off-axis) located East produces extended arcs on the left side of the image. Another arc from the pair of bright SNRs (N49/N49B, 34′) is visible on the edge of the image to the SW. To first order the energy dependence of the single-reflection efficiency is similar to that of “normal” double-reflected photons and the spectrum is little altered. Therefore, the arcs from the SNRs show the typical red-green colours of this class of sources with thermal spectra.
| Source | ML | PSPC | HRI | R | B | USNO | delta | Comment |
|---|---|---|---|---|---|---|---|---|
| XMMU J05… | [mag] | [mag] | U0225_02… | [″] | ||||
| 2924.3-655724 | 1.60 | 210 | 190 | foreground star? GSC8891.0505 13.68mag | ||||
| 2940.5-655318 | 1.38 | 189 | 198 | 17.9 | 19.0 | 041191 | 2.7 | AGN? |
| 2947.4-655639 | 2.26 | 204 | 202 | 15.0 | 14.3 | 044134 | 4.3 | HMXB-Be RX J0529.8-6556 69.5 s pulsar |
| 3011.2-655122 | 1.61 | 183 | 205 | 14.7 | 14.2 | 054120 | 1.5 | HMXB-Be? 272 s pulsar |
| 3034.9-655653 | 1.27 | 205 | SNR? | |||||
| 3041.0-660532 | 3.07 | 210 | 17.3 | 18.1 | 066312 | 3.3 | AGN? | |
| 3049.9-655522 | 1.12 | 197 | 17.8 | 18.5 | 070177 | 2.8 | AGN? | |
| 3056.2-654809 | 1.49 | 17.9 | 19.4 | 072699 | 1.6 | SSS? | ||
| 3102.5-660649 | 3.52 | 215 | AGN? | |||||
| 3113.3-660705 | 4.04 | 252 | 218 | 13.9 | 14.7 | 079445 | 2.5 | HMXB-Be EXO 053109-6609.2 13.7 s pulsar |
| 3137.2-660131 | 4.20 | 225 | 14.0 | 16.0 | 088686 | 2.2 | foreground star? | |
| 3150.9-655616 | 3.76 | 202 | AGN? | |||||
| 3153.8-660217 | 1.71 | 229 | 222 | 17.1 | 18.0 | 095134 | 3.5 | AGN? |
| 3153.9-654959 | 1.56 | AGN? | ||||||
| 3157.1-660233 | 1.25 | 17.9 | 18.7 | 096316 | 1.7 | AGN? | ||
| 3226.2-655352 | 3.19 | 190 | SNR? | |||||
| 3230.2-655735 | 1.43 | 211 | AGN? | |||||
| 3232.4-655139 | 7.84 | 184 | 233 | 13.9 | 12.4 | 109716 | 2.0 | HMXB-OB RX J0532.5-6551 |
| 3236.7-655551 | 2.15 | 236 | 17.3 | 18.1 | 111244 | 4.8 | AGN? | |
| 3243.9-660258 | 9.85 | 11.7 | 14.4 | 113921 | 4.0 | foreground star? |
Notes: Maximum Likelihood (ML) corresponding to probability P = 1–exp(-ML) of existence; PSPC and HRI catalogue entries from (Haberl & Pietsch 1999) and (Sasaki et al. 2000a); R and B from nearest (within 5″) USNO A2.0 catalogue entry; delta denotes the angular distance between optical (USNO A2.0) and X-ray position
3 Selected X-ray sources
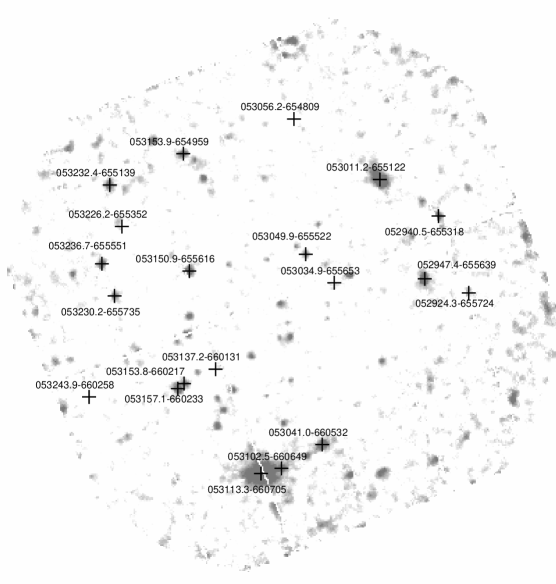
Source detection based on sliding window and maximum likelihood methods available in the SAS package yielded about 150 discrete X-ray sources in the field. A source list with X-ray properties and a statistical analysis will be presented in a follow-up paper. Here a sample of twenty sources is investigated which is selected on the basis of brightness, hardness and angular extent. To easily identify the sources in Fig. 1, their locations are marked in a grey-scale broad-band image in Fig. 2. Some information useful for the identification of the sources is provided in Table 1. Sixteen of them are located within 15″ distance to ROSAT sources as presented in Haberl & Pietsch (1999) and Sasaki et al. (2000a) and thirteen have a likely optical counterpart in the USNO A2.0 catalogue (one additional bright star is listed only in the HST guide star catalogue). Angular distances between the X-ray and optical positions are listed in the table (delta) together with the optical R and B magnitudes given in the USNO catalogue.
Finding charts produced from the DSS2 (red) image for some of the sources presented here are published in Haberl (2002), however with preliminary X-ray source positions which can differ of the order of a few arc seconds. Among the optically brightest objects in the sample three are likely late-type foreground stars given their red colours. The identification of the X-ray sources with these stars is supported by the X-ray spectrum (see below). Three other objects with B brighter than 15 mag are identified with known HMXBs and the fourth with XMMU J053011.2-655122, a candidate HMXB proposed by Haberl (2002), based on the X-ray spectrum and the brightness of the optical counterpart which is similar to those of the known HMXBs in the field. Haberl (2002) also proposed two new candidates for SNRs which can be easily identified in Fig. 1 from their angular extent and colours. For the brightest fourteen sources a sufficient number of counts (500 in pn) were collected to allow spectral and temporal analyses. For sources with extreme X-ray spectrum a smaller number of counts allows a classification of the X-ray source. Six such sources were selected including a likely faint SSS, two SNRs, two more foreground stars and the known HMXB RX J0532.5-6551.
3.1 EPIC X-ray spectra
Source spectra averaged over the whole observation were extracted from MOS and pn data in circular regions around the source positions with typical radii of 16″–22″. For the extended candidate SNRs larger radii of 30″ and 45″ were used. Background was taken from nearby circular regions chosen to be at a comparable distance to the read-out node of the pn detector (RAWY coordinate) in order to avoid detector-intrinsic background variations. Redistribution matrices available with SAS 5.3 were used in combination with effective area files produced by “arfgen” which include corrections for vignetting and point spread function losses. The set of three spectra (MOS1, MOS2 and pn) was analyzed using XSPEC by simultaneously fitting a common spectral model where the normalizations between the instruments were independent parameters to allow for inter-calibration uncertainties. Errors and upper limits were derived for 90% confidence levels. Except for the brightest source (EXO 053109-6609.2) which requires a more complex model, single component models attenuated by photo-electric absorption were fit to the spectra. EPIC spectra from eight representative sources from the sample are shown in Fig. 3. Various source types can be clearly distinguished from their different energy distribution in the 0.15–10.0 keV energy band.
| Source | kT | NH | SM4 | Flux5 | Luminosity6 | |
|---|---|---|---|---|---|---|
| XMMU J05… | [keV] | [cm-2] | [erg cm-2 s-1 ] | [erg s-1] | ||
| 2924.3-655724 | 0.680.08 | 0.1 | MK | 6.6 | ||
| 2940.5-655318 | 2.33 | 1.3 | PL | 9.6 | ||
| 2947.4-655639 | 1.310.17 | 2.61.0 | PL | 2.2 | 7.7 | |
| 3011.2-655122 | 1.070.06 | 6.90.3 | PL | 1.2 | 3.9 | |
| 3034.9-655653 | 0.7 fixed | 1.9 | MK | 1.9 | 1.2 | |
| 3041.0-660532 | 1.40 | 2.7 | PL | 2.9 | ||
| 3049.9-655522 | 2.00 | 1.4 | PL | 5.1 | ||
| 3056.2-6548091 | 0.049 | 0.3 | BB | 4.2 | 1.3 | |
| 3102.5-6606492 | 1.81 | 0.1 | PL | 2.3 | ||
| 3113.3-660705 | 1.67 | 0.100.02 | 6.9 / 97 | MC | 7.0 | 4.6 |
| 3137.2-660131 | 0.660.16 | 1.0 | MK | 1.6 | ||
| 3150.9-655616 | 1.92 | 5.3 | PL | 1.6 | ||
| 3153.8-660217 | 2.07 | 2.80.6 | PL | 1.0 | ||
| 3153.9-654959 | 1.88 | 3.8 | PL | 1.1 | ||
| 3157.1-660233 | 1.62 | 3.8 | PL | 1.4 | ||
| 3226.2-655352 | 0.680.06 | 2.1 | MK | 5.5 | 3.6 | |
| 3230.2-6557353 | 2.23 | 0.7 | PL | 6.3 | ||
| 3232.4-655139 | 1.18 | 2.5 | PL | 1.2 | 4.1 | |
| 3236.7-655551 | 2.02 | 1.3 | PL | 1.1 | ||
| 3243.9-660258 | 0.520.18 | 0.4 | MK | 1.0 |
1 spectral fit to pn spectrum only
2 the low absorption indicates a low energy excess which is probably caused by contamination from EXO 053109-6609.2
3 located in arc structure caused by single reflected photons from nearby bright SNR which
probably causes contamination
4 Spectral model; MC: multi-component (see text), PL: power-law, BB: blackbody, MK: thermal emission from plasma in
collisional equilibrium (Mewe-Kaastra, Mewe et al. 1985)
5 0.2–10 keV, determined from the pn spectrum except for EXO 053109-6609.2 (MOS1) which is
located on a CCD gap in the pn
6 0.2–10 keV, intrinsic luminosity with NH set to 0 for sources located in the LMC assuming
a distance of 50 kpc
3.1.1 High Mass X-ray Binaries
Although the Be/X-ray pulsar EXO 053109-6609.2 is known since almost 20 years, little is known about its X-ray spectrum. The small angular separation to LMC X-4 made it impossible to take spectra with non-imaging instruments and only measurements with the EXOSAT Low Energy imaging detector with different filters at energies below 2 keV were available (Brunner 1987). In the 2–20 keV band a spectrum of low statistical quality was obtained from the coded mask SL2 XRT experiment which was consistent with a power-law with a photon index 1.0 and an absorbing hydrogen column density of 7 cm-2 (Hanson et al. 1989).
The XMM-Newton observation yielded the first 0.2–12 keV spectrum (Fig. 3) of EXO 053109-6609.2. The spectrum is complex and cannot be represented by the simple power-law (neither by including a high-energy cutoff) model sufficient to characterize most Be/X-ray binaries. Below 1 keV clearly a soft component is detected with features too narrow to be fit with continuum spectra as produced by e.g. blackbody or multi-temperature disk-blackbody emission. The only acceptable model was found to be thermal emission from hot plasma in collisional equilibrium (VMEKAL model in XSPEC, Mewe et al. 1985) with a temperature kT of 0.1 keV and reduced abundances (0.29 solar) of elements heavier than oxygen. Above 3 keV a highly absorbed ( cm-2) power-law gives an acceptable fit consistent with the SL2 results. However, both components described so far do not contribute significantly to the flux between 1 and 2 keV. Reducing the absorption in the power-law component yields too high flux around 2–3 keV and does not fit. Several components were tested in the model to account for the emission between 1 and 2 keV. Neither blackbody, disk-blackbody nor a second VMEKAL give acceptable results.


The best fit was obtained by adding another power-law component which is attenuated at low energies by the same amount of absorption as the thermal plasma component. The power-law index was forced to be the same as the index of the high absorption power-law. The best fit values for the photon index and the two column densities are listed in Table 2. The normalization of the low-absorption component relative to the high-absorption component is 0.23. The two power-law components may originate from the same emission region partially covered by different amounts of absorbing matter. Partially may be interpreted here as spatially or temporally varying. The latter is supported by spectral variations seen during the pulse period (see below). Adding a narrow Fe emission line (6.32 keV) with an equivalent width of 329 eV improved the by 13 to the best fit with =520 for 336 degrees of freedom. The model spectrum is illustrated in Fig. 4.

A soft spectral component is so far only detected from a few HMXBs, most of them located in the Magellanic Clouds (e.g. Kohno et al. 2000; Yokogawa et al. 2000). In the Milky Way the HMXBs are concentrated in the galactic plane and the large interstellar absorption strongly attenuates the soft X-ray energies. Therefore, the HMXBs in the Magellanic Clouds are ideal to investigate the soft part of the spectrum. No pulsations were detected in the soft spectral component seen from RX J0059.2-7138 with ASCA (Kohno et al. 2000) which suggests emission from a relatively large region. The emission measures derived for EXO 053109-6609.2, if the thin plasma model is adopted, of cm-3 and for RX J0059.2-7138 of cm-3 (Kohno et al. 2000) support this. A possible origin of the soft emission may be the disk-like dense stellar wind around the Be star which is illuminated by the strong X-ray source with luminosities of the order of erg s-1. However, to differentiate between emission lines produced in collisionally or photo-ionized plasma high resolution grating spectra are required. E.g. Chandra observations of the HMXB Cen X-3, a close system with supergiant primary, revealed emission lines excited by both kinds of processes (Wojdowski et al. 2002).
From RX J0532.5-6551 and RX J0529.8-6556 only ROSAT PSPC spectra in the energy band 0.1–2.4 keV were available. The spectra are of low statistical quality and the narrow energy coverage did not allow to determine power-law index and column density with high accuracy (Haberl et al. 1995, 1997). Haberl (2002) proposed a new candidate HMXB based on its hard X-ray spectrum and the presence of a likely optical counterpart on the DSS2 (R) image with similar brightness as the counterparts of the other two nearby Be/X-ray binaries. Detection of a possible pulse period (see below) for XMMU J053011.2-655122 leaves little doubt about the HMXB and most likely Be/X-ray binary nature of this source. Fitting an absorbed power-law to the spectra of XMMU J053011.2-655122, RX J0529.8-6556 and RX J0532.5-6551 yields acceptable fits (reduced 0.9–1.3) with power-law indices in the range 1.0–1.4 (Table 2). The EPIC spectra of these sources are shown together with the best fit model in Fig. 3. XMMU J053011.2-655122 was also detected in ROSAT data (Haberl & Pietsch 1999; Sasaki et al. 2000a) with a count rate corresponding to a flux which is a factor of 2.2 below the XMM-Newton measurement (assuming spectral parameters derived from the EPIC spectra).
3.1.2 AGN
The majority of the X-ray brightest sources in the field (ten out of fourteen) most likely consists of AGN in the background of the LMC. Their X-ray spectra can be represented by power-laws with indices between 1.8 and 2.3 with only one case with index 1.4 (Table 2), typically for this source class. Moreover they do not possess an optical counterpart with B brighter than 18th magnitude in the USNO A2.0 catalogue (Table 1). As an example the EPIC spectra of XMMU J053150.9-655616 together with the best fit model are plotted in Fig. 3.
3.1.3 Supernova remnants
Two new SNRs were proposed by Haberl (2002) from their spatial extent and X-ray colours (Fig. 1) in the EPIC data. Both SNRs were detected in the ROSAT PSPC data (sources 190 and 205 in Haberl & Pietsch 1999) with indication for spatial extent. However, due to the low statistical quality of the data the sources were not classified as SNR candidates. XMMU J053226.2-655352 is sufficiently bright to allow the investigation of the X-ray spectrum which shows little flux above 2 keV. Fitting a MEKAL model results in a best fit temperature kT = 0.68 keV consistent with radiation from a thermal SNR. For the Fe abundance a best fit value of 0.41 was derived. The best fit model to the EPIC spectra of XMMU J053226.2-655352 is shown in Fig. 3. Due to the lower number of detected photons from XMMU J053034.9-655653 the temperature was fixed at 0.7 keV in the fit to the EPIC spectra. Also in this case a low Fe abundance was deduced (upper limit of 0.06).
3.1.4 Foreground stars
The EPIC spectra of sources identified with foreground stars also do not show significant emission above 2 keV. However the absorbing column density is lower than that of sources located in the LMC clearly distinguishing them from SNRs (in addition they are unresolved X-ray sources). Spectra of three foreground stars were investigated and the results are listed in Table 2. All three spectra can be represented by emission from hot thermal emission with temperature between 0.5 and 0.7 keV and low Fe abundance of 0.1–0.2 solar. For the absorption column densities only upper limits could be derived consistent with nearby objects. The X-ray spectra suggest emission from late-type stars with active corona which is also consistent with their B-R index derived from the magnitudes listed in USNO A2.0. As an example the spectra of XMMU J052924.3-655724 are plotted in Fig. 3.
3.1.5 Supersoft source
The faint source XMMU J053056.2-654809 is characterized by red colour in the image of Fig. 1 indicating an extremely soft X-ray spectrum. Only the pn detector is sensitive enough to allow accumulation of an energy spectrum which is only detected below 0.5 keV (see Fig. 3). A formal fit with a blackbody model yields a temperature of 49 eV which is typical for supersoft sources, AM Her systems, isolated white dwarfs or isolated X-ray dim neutron stars. Its luminosity of 1.3 erg s-1 for a distance of 50 kpc is too high to originate from an AM Her type cataclysmic variable in the LMC (for luminosities of the soft blackbody component in AM Her systems see e.g. Ramsay et al. 1994). XMMU J053056.2-654809 is not contained in the ROSAT catalogues of the LMC and therefore archival PSPC data (45 ks observation with ID 200692P) was investigated and an upper limit of 7.9 cts s-1 (3, 0.1–0.6 keV) was determined. Folding the spectral model fitting the EPIC pn data through the PSPC response an expected count rate of 2.6 cts s-1 is obtained which implies that XMMU J053056.2-654809 was at least a factor of 33 fainter during the ROSAT observation in October/November 1991. The high variability excludes an explanation as dim isolated neutron star or single white dwarf in the foreground. An AM Her system located in the Milky Way is expected to be brighter in the optical than the close USNO catalogue object. Therefore, XMMU J053056.2-654809 is considered most likely to be a variable SSS in the LMC.
3.2 X-ray pulsars
Temporal analysis was performed on the data of the HMXBs and the other eleven brightest sources in the sample. Fast Fourier power spectra were produced from light curves in the 0.3–7.5 keV energy band. A folding analysis was then performed around frequency peaks identified in the power spectra. Pulsations were detected only from the known HMXB pulsars and from the new candidate HMXB which is discussed in the following.
3.2.1 EXO 053109-6609.2
For EXO 053109-6609.2 a mean pulse period of 13.66817(1) s was derived (1 error given for the last digit). The power spectrum exhibits also peaks at the first and third harmonic, consistent with the highly non-sinusoidal pulse profile (Fig. 5). Pulsations are seen above and below 4 keV confirming that the two spectral power-law components (Fig. 4) originate both from EXO 053109-6609.2. Due to the strong re-distribution of events to lower energy-channels at energies below 1 keV in the EPIC pn CCD it is not possible to verify if the soft thermal plasma emission below 0.5 keV shows pulsations or not. For a spectrum steeply falling towards lower energies the contribution from photons above 0.5 keV dominates the events below channel 100 (nominally corresponding to energy 0.5 keV) and therefore pulsations seen in the flux above 0.5 keV will also be seen in the lowest channels.


To investigate possible spectral changes during the pulse period, hardness ratio plots were produced by creating light curves folded on the pulse period in different energy bands and dividing the obtained count rates as function of pulse phase. The folded light curves from energy bands 0.15–0.4 keV and 0.4–2.0 keV are plotted in Fig. 6 (left) together with the hardness ratio. The hardness ratio shows remarkable increases around the two intensity dips which resemble the behaviour of an X-ray source viewed through a dense atmosphere before and after it is eclipsed. The facts that the eclipse seen here is not total and that two eclipses are seen about 0.5 in phase apart, suggest that we see two emission regions in EXO 053109-6609.2, most likely from the accreting magnetic poles of the neutron star. Before the pole is self-eclipsed by the neutron star or the accretion column the emission is viewed through dense matter, most likely matter from the accretion column above the pole which attenuates the emission more strongly at lower energies. During eclipse (when the emission is probably dominated by the other pole) the hardness ratio remains constant within the errors. Hardness ratios which involve emission from energies above 2 keV (which is less affected by absorption and more sensitive to changes in the intrinsic spectrum) are plotted in Fig. 6 (right). They show that the spectrum softens during the eclipses. This can be explained by a spatial temperature variation in the emission region with the temperature increasing with height above the neutron star surface. The cooler regions become only visible during closest approach of the magnetic axis to the line of sight. Such a picture is expected from matter in the accretion column shocked at a certain height above the neutron star surface and cooling during the final settlement onto the neutron star.
Comparison of the pulse profiles of the XMM-Newton observation with those obtained from BeppoSAX data (Burderi et al. 1998) shows a major difference which is best visible in the 2–10 keV band. During the BeppoSAX observation the profile shows a strong peak after the deeper eclipse while after the secondary eclipse the intensity remains as low as during the eclipse. During the XMM-Newton observation this behaviour is mirrored around the secondary eclipse (at phase 0.55 in Fig. 6) with low intensity before and high intensity after the eclipse. This behaviour is probably related to the overall source intensity. The pulse profile obtained during a long ROSAT observation (Dennerl et al. 1996) when the source was in a low-intensity state (1 erg s-1) resembles those of the XMM-Newton observation (with observed luminosity of 1.7 erg s-1 in the 0.1–2.4 keV band). During the BeppoSAX observation the source was in outburst with an observed luminosity in excess of erg s-1 compared to 2.1 erg s-1 measured by EPIC (note the luminosity given in Table 2 is corrected for absorption). It should be noted that no attempt was made in the presented analysis to determine secular period changes and the pulse profiles based on a mean pulse period may be smeared out somewhat.
3.2.2 RX J0529.8-6556 and XMMU J053011.2-655122
The pulse period of 69.232(2) s detected in the EPIC data from RX J0529.8-6556 confirms the discovery by ROSAT. For the second brightest X-ray source in the field during the XMM-Newton observations, XMMU J053011.2-655122, probable pulsations were found with a period of 271.97(5) s. From the folding analysis the test yields a formal significance of 4.6 for the probability that this detection is real. Together with the X-ray spectrum and the brightness of the proposed optical counterpart the pulsations strongly support the identification of XMMU J053011.2-655122 as fourth HMXB system in the observed field. Power spectra and light curves folded with the pulse period for RX J0529.8-6556 and XMMU J053011.2-655122 are shown in Fig. 5.
4 Source populations
Chu (1997) used a sample of SNRs in OB associations in the LMC to study how interstellar environments affect the physical properties of SNRs. She found that SNRs in H II regions all show the three classical SNR signatures (bright X-ray emission, non-thermal radio emission and enhanced [S II]/H ratio) while some SNRs in super-bubbles show only X-ray emission. The observed LMC field presented here is located at the northern rim of the SGS LMC 4 and one reason that the two new X-ray selected SNRs were not detected yet at radio or optical wavelengths may be the explosion of their progenitors into the hot and low density interior of the SGS. Very likely the formation of the progenitors was triggered by the expanding shell and the SNRs are now shocking the inner walls of the shell (Chu 1997). A relatively large number of SNRs with X-ray luminosities around erg cm-2 s-1 may therefore still be detectable in XMM-Newton observations of the Magellanic Clouds and in particular inside the supergiant shells in the LMC. Promising candidates may be found among the sources listed in the ROSAT catalogues (Haberl & Pietsch 1999; Haberl et al. 2000; Sasaki et al. 2000a, b) with indication for spatial extent but without sufficient number of detected photons (and therefore a low likelihood for the extent) to allow a classification of the sources.
The SMC is peculiar in its high number of Be/X-ray binaries (both in absolute terms given the size of the galaxy and relative to the number of supergiant HMXBs and SNRs, Haberl & Sasaki 2000; Yokogawa et al. 2002) which may indicate an increased star forming rate about years ago (the time which elapses between the formation of a massive binary and its evolution into a HMXB, van den Heuvel 1983). The star formation must have largely declined since then as the lower number of descendants of young massive stars like supergiant HMXBs and type-II SNRs indicates (Yokogawa et al. 2002). With respect to the space density of HMXBs the observed XMM-Newton field and its close neighborhood in the northern area of the SGS LMC 4 are similar to that of the SMC. However, the existence of a relatively high number of younger SNRs and the supergiant HMXB system RX J0532.5-6551 is consistent with a more constant star formation rate over the last years in this part of the LMC 4 region. The stochastic self-propagating star formation (SSPSF) scenario proposed to explain the production of supergiant shells (Feitzinger et al. 1981) predicts a gradient in the age of stars, from young stars at the edges to older ones inside. However, no such gradient was found for stars in the interior of LMC 4 with stellar ages in a narrow range of 9 Myr to 16 Myr (Braun et al. 1997) leading to the conclusion that LMC 4 may have formed without contribution from SSPSF, although the ring of young associations and H II regions around the edge were triggered by the events inside the SGS. The X-ray source census of HMXBs and SNRs in the LMC 4 region is fully consistent with this picture and the Be/X-ray binaries may well belong to the stellar population found by Braun et al. (1997).
The majority of X-ray sources in the observed field are most likely AGN behind the LMC. Their spectra are characterized by power-laws attenuated by photo-electric absorption due to interstellar gas in the Milky Way and the LMC along the line of sight. From H I 21-cm maps the Galactic contribution is measured to 5.7 cm-2 (Dickey & Lockman 1990) while the LMC column density varies between 5 cm-2 and 9 cm-2 (Kim et al. 1998) across the field. From the ten AGN candidates about half have X-ray measured column densities well above the H I values. Since the absorption in the X-ray band is dominated by the metals in the absorbing gas lower metallicities adopted in the spectral fits (0.5 solar for the LMC, Russell & Dopita 1992) would lead to correspondingly higher hydrogen column densities. Similar results, but with larger excess column densities, were obtained for AGN detected in the 30 Doradus region and Haberl et al. (2001) concluded for the 30 Doradus region that either large amounts of H II and/or H2 or higher metal abundances exist along the line of sights through the LMC. The case of the XMM-Newton field presented here is less clear. No dense clouds are visible on H images (e.g. Domgörgen et al. 1995) or CO maps (Yamaguchi et al. 2001) in the observed field at the northern rim of the LMC 4 SGS and in the sample of candidate AGN the excess absorption may be explained by AGN intrinsic obscuration. Indeed relatively large fractions of obscured AGN were found in deep surveys (e.g. Mainieri et al. 2002), however, mainly among the X-ray and optically fainter ones. The ten brightest AGN in the LMC field have 2.0–10.0 keV fluxes higher than 3 erg cm-2 s-1 and six of them likely counterparts with R magnitudes (from USNO A2.0) between 17 and 18, confining them to the upper left part of the flux – magnitude diagram of Fig. 6 in Mainieri et al. (2002). There objects are located which show a much lower fraction of obscured AGN. To help to identify those unobscured AGN which can be used to probe the interstellar medium in the LMC optical spectra are required.
5 Summary
The deep XMM-Newton observation of a northern field in the LMC allows to uniquely classify the detected X-ray sources to flux levels of erg cm-2 s-1 from their X-ray properties alone. X-ray spectra obtained by the EPIC cameras over a relatively broad energy band (0.15–12.0 keV) emphasize the various energy distributions observed from the different types of X-ray sources. A first analysis of twenty selected sources, presented here, yielded the discovery of a previously undetected supersoft source, revealed two ROSAT sources with indication for spatial extent as supernova remnants and rendered the detection of a possible pulsation in the X-ray flux of a candidate HMXB in the LMC. This increases the number of known HMXBs in the observed field to four. Among the fourteen brightest sources three HMXBs, one foreground star and up to ten AGN were found. Particular results on individual objects are discussed in Sect. 3 while in Sect 4 the analyzed sample of X-ray sources is considered in the view of source population studies in the Magellanic Clouds and nearby galaxies in general.
Acknowledgements.
The XMM-Newton project is supported by the Bundesministerium für Bildung und Forschung / Deutsches Zentrum für Luft- und Raumfahrt (BMBF / DLR), the Max-Planck-Gesellschaft and the Heidenhain-Stiftung. The USNO A2.0 catalogue was produced by the US Naval Observatory.References
- Anguita et al. (2000) Anguita, C., Loyola, P., & Pedreros, M. H. 2000, AJ, 120, 845
- Aschenbach et al. (2000) Aschenbach, B., Briel, U. G., Haberl, F., et al. 2000, in Proc. SPIE, X-Ray Optics, Instruments, and Missions III, Joachim E. Trümper; Bernd Aschenbach; Eds., Vol. 4012, 731
- Braun et al. (1997) Braun, J. M., Bomans, D. J., Will, J., & de Boer, K. S. 1997, A&A, 328, 167
- Brunner (1987) Brunner, H. 1987, PhD Thesis, Universität Tübingen
- Burderi et al. (1998) Burderi, L., di Salvo, T., Robba, N. R., del Sordo, S., Santangelo, A., & Segreto, A. 1998, ApJ, 498, 831
- Chu (1997) Chu, Y. 1997, AJ, 113, 1815
- Dennerl et al. (1996) Dennerl, K., Haberl, F., & Pietsch, W. 1996, in Röntgenstrahlung from the Universe, 131
- Dickey & Lockman (1990) Dickey, J. M. & Lockman, F. J. 1990, Ann. Rev. Astron. Astrophys., 28, 215
- Dobrzycki et al. (2002) Dobrzycki, A., Groot, P. J., Macri, L. M., & Stanek, K. Z. 2002, ApJ, 569, L15
- Domgörgen et al. (1995) Domgörgen, H., Bomans, D. J., & de Boer, K. S. 1995, A&A, 296, 523
- Feitzinger et al. (1981) Feitzinger, V., Glassgold, A. E., Gerola, H., & Seiden, P. E. 1981, A&A, 98, 371
- Haberl (2002) Haberl, F. 2002, in New Visions of the X-ray Universe in the XMM-Newton and Chandra Era, Vol. 488, in press
- Haberl et al. (2001) Haberl, F., Dennerl, K., Filipović, M. D., Aschenbach, B., Pietsch, W., & Trümper, J. 2001, A&A, 365, L208
- Haberl et al. (1997) Haberl, F., Dennerl, K., Pietsch, W., & Reinsch, K. 1997, A&A, 318, 490
- Haberl et al. (2000) Haberl, F., Filipović, M. D., Pietsch, W., & Kahabka, P. 2000, A&AS, 142, 41
- Haberl & Pietsch (1999) Haberl, F. & Pietsch, W. 1999, A&AS, 139, 277
- Haberl et al. (1995) Haberl, F., Pietsch, W., & Dennerl, K. 1995, A&A, 303, L49
- Haberl & Sasaki (2000) Haberl, F. & Sasaki, M. 2000, A&A, 359, 573
- Hanson et al. (1989) Hanson, C. G., Skinner, G. K., Eyles, C. J., & Willmore, A. P. 1989, MNRAS, 240, 1P
- Jansen et al. (2001) Jansen, F., Lumb, D., Altieri, B., et al. 2001, A&A, 365, L1
- Kahabka et al. (2001) Kahabka, P., de Boer, K. S., & Brüns, C. 2001, A&A, 371, 816
- Kim et al. (1998) Kim, S., Staveley-Smith, L., Dopita, M. A., et al. 1998, ApJ, 503, 674
- Kohno et al. (2000) Kohno, M., Yokogawa, J., & Koyama, K. 2000, PASJ, 52, 299
- Mainieri et al. (2002) Mainieri, V., Bergeron, J., Hasinger, G., et al. 2002, astro-ph0207166
- Meaburn (1980) Meaburn, J. 1980, MNRAS, 192, 365
- Mewe et al. (1985) Mewe, R., Gronenschild, E. H. B. M., & van den Oord, G. H. J. 1985, A&AS, 62, 197
- Negueruela & Coe (2002) Negueruela, I. & Coe, M. J. 2002, A&A, 385, 517
- Pakull et al. (1985) Pakull, M., Brunner, H., Pietsch, W., Staubert, A., Beuermann, K., van der Klis, M., & Bonnet-Bidaud, J. M. 1985, Space Science Reviews, 40, 379
- Ramsay et al. (1994) Ramsay, G., Mason, K. O., Cropper, M., Watson, M. G., & Clayton, K. L. 1994, MNRAS, 270, 692
- Russell & Dopita (1992) Russell, S. C. & Dopita, M. A. 1992, ApJ, 384, 508
- Sasaki et al. (2001) Sasaki, M., Haberl, F., Keller, S., & Pietsch, W. 2001, A&A, 369, L29
- Sasaki et al. (2000a) Sasaki, M., Haberl, F., & Pietsch, W. 2000a, A&AS, 143, 391
- Sasaki et al. (2000b) —. 2000b, A&AS, 147, 75
- Strüder et al. (2001) Strüder, L., Briel, U., Dennerl, K., et al. 2001, A&A, 365, L18
- Turner et al. (2001) Turner, M. J. L., Abbey, A., Arnaud, M., et al. 2001, A&A, 365, L27
- van den Heuvel (1983) van den Heuvel, E. P. J. 1983, in Accretion Driven Stellar X-ray Sources, Lewin W.H.G. & van den Heuvel E.P.J., eds., 303
- Wojdowski et al. (2002) Wojdowski, P. S., Liedahl, D. A., Sako, M., Kahn, S. M., & Paerels, F. 2002, astro-ph/0206065
- Yamaguchi et al. (2001) Yamaguchi, R., Mizuno, N., Onishi, T., Mizuno, A., & Fukui, Y. 2001, PASJ, 53, 959
- Yokogawa et al. (2002) Yokogawa, J., Imanishi, K., Tsujimoto, M., & Koyama, K. 2002, PASJ in press
- Yokogawa et al. (2000) Yokogawa, J., Paul, B., Ozaki, M., Nagase, F., Chakrabarty, D., & Takeshima, T. 2000, ApJ, 539, 191