Simulations of Galaxy Formation in a CDM Universe II:
The Fine Structure of Simulated Galactic Disks
Abstract
We present a detailed analysis of the dynamical properties of a simulated disk galaxy assembled hierarchically in the CDM cosmogony. At , two distinct dynamical components are easily identified solely on the basis of the orbital parameters of stars in the galaxy: a slowly rotating, centrally concentrated spheroid and a disk-like component largely supported by rotation. These components are also clearly recognized in the surface brightness profile of the galaxy, which can be very well approximated by the superposition of an spheroid and an exponential disk. However, neither does the dynamically-identified spheroid follow de Vaucouleurs’ law nor is the disk purely exponential, a result which calls for caution when estimating the importance of the disk from traditional photometric decomposition techniques. The disk may be further decomposed into a thin, dynamically cold component with stars on nearly circular orbits and a hotter, thicker component with orbital parameters transitional between the thin disk and the spheroid. Supporting evidence for the presence of distinct thick and thin disk components is found, as in the Milky Way, in the double-exponential vertical structure of the disk and in abrupt changes in the vertical velocity distribution as a function of age. The dynamical origin of these components offers intriguing clues to the assembly of spheroids and disks in the Milky Way and other spirals. The spheroid is old, and has essentially no stars younger than the time elapsed since the last major accretion event; Gyr ago for the system we consider here. The majority of thin disk stars, on the other hand, form after the merging activity is over, although a significant fraction () of thin-disk stars are old enough to predate the last major merger event. This unexpected population of old disk stars consists mainly of the tidal debris of satellites whose orbital plane was coincident with the disk and whose orbits were circularized by dynamical friction prior to full disruption. More than half of the stars in the thick disk share this origin, part of a trend that becomes more pronounced with age: nine out of ten stars presently in the old ( Gyr) disk component were actually brought into the disk by satellites. By contrast, only one in two stars belonging to the old spheroid are tidal debris; the rest may be traced to a major merger event that dispersed the luminous progenitor at and seeded the formation of the spheroid. Our results highlight the role of satellite accretion events in shaping the disk—as well as the spheroidal—component and reveal some of the clues to the assembly process of a galaxy preserved in the detailed dynamics of old stellar populations.
1 Introduction
Some of the observed properties of galactic disks seem at odds with many of the “natural” trends expected in hierarchically clustering models and present a significant challenge to the current paradigm of structure formation on small scales (see, e.g., Sellwood & Kosowsky 2001, Navarro & Steinmetz 2000, Moore 2001). Qualitatively, the main difficulty lies in reconciling the early collapse and eventful merging history characteristic of the buildup of galactic dark matter halos with the many dynamical clues which point to a smooth assembly of the luminous component of galactic disks. This difficulty has made it necessary to postulate a substantial role for complex astrophysical processes in order to overcome some of these trends and to bring models of hierarchical assembly into agreement with observation.
The prime concern regards the fragility of centrifugally supported stellar disks to rapid fluctuations in the gravitational potential such as those stirred by mergers and satellite accretion events (Toth & Ostriker 1992, Quinn, Hernquist & Fullagar 1993, Velazquez & White 1999). As first computed in detail by Tóth & Ostriker (1992), the constraints on merger events undergone by a thin disk such as that of the Milky Way are very strict indeed. These authors find that less than of the disk mass within the solar circle could have been accreted in the past Gyr in the form of clumps, limiting severely the role of merging in the recent mass accretion history of the Milky Way.
Although these numbers might be relaxed somewhat by taking into account the coherent response of a self-gravitating disk to the accretion event (Huang & Carlberg 1997, Walker, Mihos & Hernquist 1996, Velázquez & White 1999), there is broad consensus that the presence of a dominant, thin, cold stellar disk points convincingly to a history of mass accretion where major mergers have played a minor role. Indeed, since the fragile circular orbits of disk stars are easily perturbed during mergers, the age of the oldest disk stars is often used to estimate the epoch of the last major merger. In the case of the Milky Way, stars as old as Gyr are found in the solar neighborhood, suggesting a protracted (and perhaps episodic) history of star formation in the disk (Wyse 2000, Rocha-Pinto et al 2000, Liu & Chaboyer 2000) and, consequently, a paucity of merger events at odds with typical merging histories of dark halos in cosmogonies such as the CDM model.
The need for ordered and smooth settling of gas into thin galactic disks leads to a few basic predictions of hierarchical scenarios that can be contrasted directly with observation. For example, because angular momentum results from torques operating before collapse, it correlates directly with the radius and time of turnaround (Navarro & Steinmetz 1997). Thus, material that turns around later is expected to have higher angular momentum, with two major implications: (i) disks are expected to be physically smaller in the past, compared with systems of similar rotation speed identified at present, and (ii) disks form from the inside out, as higher angular momentum material, which collapses later, should settle preferentially in the outer regions of the disk (Mo, Mao & White 1998).
Although overall these expectations are not grossly inconsistent with current data, a number of well established observations are worryingly difficult to accommodate within this general scenario. One of these worries concerns the origin of the complex vertical structure of galactic disks. Current datasets suggest that most (if not all) galactic disks are built out of two major dynamical components, referred to generally as the “thick” and “thin” disks (Dalcanton & Bernstein 2002 and references therein). Although varying in importance from galaxy to galaxy, the thick disk appears to be old (- Gyr in the case of the Milky Way, Gilmore, Wyse & Jones 1995), poor in metals (Prochaska et al 2000), and of similar radial extent as the thin disk component (Wyse 2000).
These trends have led to the popular conjecture that the Milky Way’s thick disk has its origin in an early thin disk of velocity and size comparable to today’s but “thickened” by the accretion of a satellite - Gyr ago (Gilmore, Wyse & Norris 2002). Appealing as this idea may be from a dynamical standpoint, it is rather unattractive in a hierarchical scenario, where the mere existence of such large, fast-rotating disks at (corresponding to roughly Gyr ago in the CDM scenario) counters the “natural” prediction of the model. A related difficulty concerns the presence of old disk stars in the vicinity of the Sun, which might be taken to imply that even at high redshift the thin disk already extended as far as the solar circle and has remained essentially undisturbed dynamically since. Such a long period of quiet dynamical evolution is difficult to reconcile with the active merging expected at early times in the CDM cosmogony, and perhaps even with the presence of the Galaxy’s spheroidal component, which is typically ascribed to a relatively recent major merger event.
The discussion above illustrates the still unsettled account of the origin of the Galactic disk(s) in the hierarchical formation paradigm, and draws notice to the fundamental role that accretion events, be they mergers or satellite disruptions, have played in determining the structure of galactic disks. In this paper—the second in a series analyzing the dynamical properties of galaxies simulated in the “concordance” CDM paradigm—we examine these issues using a numerical simulation with high numerical resolution. The simulation is the same as described by Abadi et al (2002) in Paper I of this series; that paper confronts the global dynamical and photometric properties of the simulated galaxy with normal spirals, while the present one concentrates on the multi-component nature of the stellar disk and on its dynamical origin.
The paper is organized as follows. In section 2 we briefly discuss, for completeness, numerical details of the simulation; § 3 discusses the identification of distinct dynamical components in the simulated galaxy, as well as the implications of these results in the context of the formation of the thick and thin disks of the Milky Way. Finally, § 4 summarizes our main conclusions.
2 The Simulation
A complete description of the numerical simulation analyzed in this paper is presented in Paper I (Abadi et al 2002), where the interested reader may find full details. For completeness, we provide here a brief description of the numerical method and of the simulation.
2.1 The Code
The simulation described here was performed with GRAPESPH, a particle-based, fully three-dimensional Lagrangian hydrodynamical code that combines the flexibility and adaptability of the Smoothed Particle Hydrodynamics technique with the speed of the special-purpose hardware GRAPE for computing gravitational interactions between particles (Steinmetz 1996). The version used here includes the self-gravity of gas, stars, and dark matter, hydrodynamical pressure and shocks, Compton and radiative cooling, as well as the heating effects of a photoionizing UV background (see Navarro & Steinmetz 1997, Steinmetz & Navarro 1999, for more details).
Star formation is handled in GRAPESPH by means of a simple recipe for transforming gas particles in collapsing, dense regions into stars at a rate roughly proportional to the local dynamical timescale of the gas. After formation, star particles are only affected by gravitational forces, but they devolve energy and mass to their surroundings in a crude attempt to mimic the energetic feedback from evolving stars and supernovae. A fraction, , of this energy is invested in raising the kinetic energy of gas neighboring active star forming regions. These motions are dissipated by shocks on a timescale longer than the local cooling time, allowing for lower star formation efficiencies and longer effective timescales for the conversion of gas into stars. Still, our choice of parameters results in just a minor fraction of cooled, dense gas being reheated and returned to intergalactic space in diffuse form. The star formation history in the simulated galaxy thus roughly traces the rate at which gas cools and collapses to the center of dark matter halos.
The mass devolved by star particles during feedback events is added to gas particles surrounding young stars, and tracked in the code as a crude measure of the metal content of the gas. This “metallicity” is in turn inherited by the stars each gas particle spawns. By all accounts, this treatment of metal enrichment is quite rudimentary and, therefore, we restrict the use of stellar metallicities to the modeling of the spectrophotometric contribution of each star particle to the luminous output of a galaxy, as described by Contardo, Steinmetz & Fritze-von Alvensleben (1998).
2.2 The Simulation
The simulation evolves a region that forms, at , a galaxy-sized dark matter halo in the low-density, flat Cold Dark Matter (CDM) scenario (Bahcall, Ostriker & Steinhardt 1999). This model is fully specified by the following choice of cosmological parameters111 We express the present value of Hubble’s constant as km s-1 Mpc-1: , , , and , where , , and represent the present-day contribution to the mass-energy density of matter, baryons, and a cosmological constant, respectively, in units of the closure density. The power spectrum is normalized so that at the linear rms amplitude of mass fluctuations in Mpc spheres is , and we assume that there is no “tilt” in the initial CDM power spectrum.
At the dark matter halo under consideration has a circular velocity of km/s and a total mass of , measured at the virial radius, kpc, where the mean inner density contrast (relative to the critical density for closure) is . This region was identified in a cosmological simulation of a large periodic box ( Mpc on a side) and resimulated at higher resolution, including the tidal field of the original simulation. The high-resolution region (an “amoeba”-shaped region contained within a cube of comoving Mpc on a side) is filled at the initial redshift, , with the same number of gas and dark matter particles. The gas and dark matter particle mass is and , respectively. We adopt a Plummer softening scalelength of (physical) kpc for all gravitational interactions between pairs of particles.
The baryonic mass of the final galaxy is , equivalent to roughly gas particles (or more than star particles). This resolution enables a detailed study of the dynamical and photometric properties of the simulated galaxy, including the identification of different populations of stars according to age and/or kinematics. Galaxy luminosities are computed by simply adding up the luminosities of each star particle, taking into account the time of creation of each particle (its “age”) and its metallicity, as described in detail by Contardo, Steinmetz & Fritze-von Alvensleben (1998). Corrections due to internal absorption and inclination are neglected, except for a temporary wavelength-dependent dimming introduced to take into account the gradual dispersal of the dust clouds that obscure the formation sites of young stars (Charlot & Fall 2000). Further details may be consulted in Paper I (Abadi et al 2002).
3 Results
The large-scale formation of the simulated galaxy is shown in Figures 1-3 of Paper I, and follows the typical assembly process of dark matter halos in the CDM cosmogony. The region destined to form the halo collapses early () into a pancake-like structure criss-crossed by filaments along which matter drains into collapsed dark matter halos. Gas cools and condenses at the center of these halos, turning swiftly into stars as it settles at the bottom of these potential wells. These progenitors gradually merge into a single system at which is the subject of our analysis here.
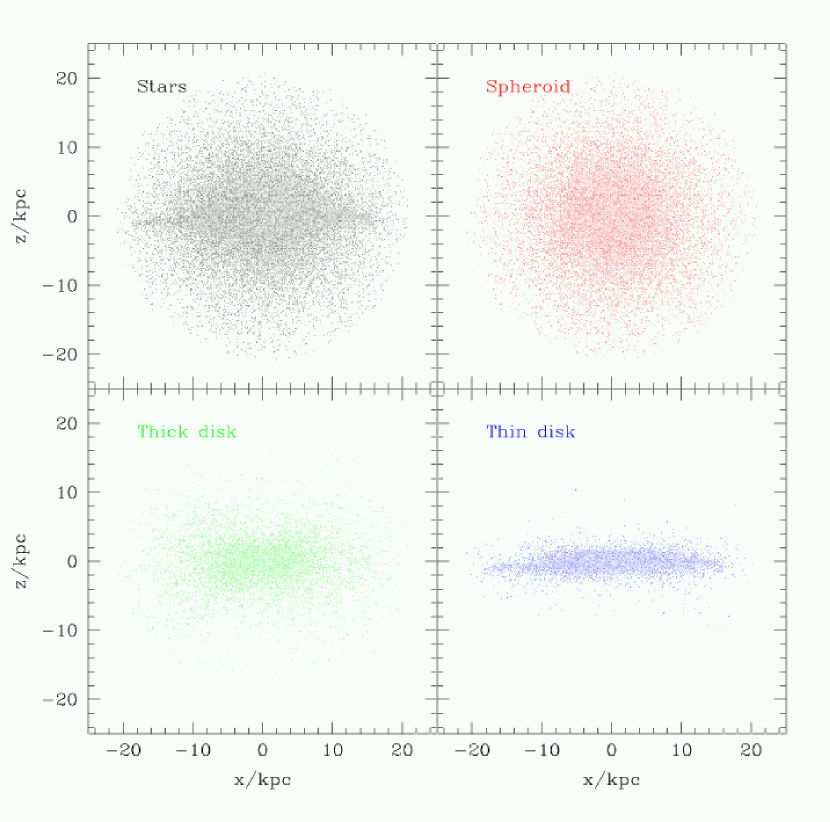
The mass accretion history is punctuated by a succession of major mergers at high redshift, although by the merging activity of the galaxy is over and the dark halo evolves little thereafter. The cooled (and cooling) gas within the halo, on the other hand, keeps flowing towards the center and settles gradually into a dynamically cold, centrifugally supported disk. The stellar component of the central galaxy increases by in mass since , and is shown at in the top-left panel of Figure 1. Much of the late accreting material is clearly visible in the final galaxy as a well-defined disk of young stars surrounding a more centrally concentrated spheroid of older stars. Photometrically, this structure is reminiscent of that of early-type spirals and was analyzed in detail in Paper I. We concentrate here on the detailed dynamical analysis of the galaxy at and on the origin of its major components.
3.1 Dynamical Decomposition
The existence of a well defined, thin disk in the stellar and gaseous components of the galaxy (see top-left panel of Figure 1) defines unambiguously a symmetry axis which we shall hereafter call the “-axis”, for short. Figure 2 shows , the -component of the specific angular momentum of all stars within the “luminous” radius of the central galaxy, kpc, plotted versus the specific binding energy of each star, . Binding energies are computed relative to the total mass of the system within the virial radius, . Particles with positive or negative circulate around the center of the galaxy in different directions; we choose to be positive so that most stars are “co-rotating” in Figure 2.
The available parameter space in the - plane is delineated by the maximum and minimum angular momentum consistent with a given value of the specific energy: those of the co- and counter-rotating circular orbits, respectively. The co-rotating circular orbits are shown by the solid curve labelled in Figure 2. The gas particles within are on a thin, centrifugally supported disk, and follow closely the curve, as shown by the magenta dots in Figure 2. The prevalence of circular orbits in the gaseous disk can also be seen in the distribution of the “orbital circularity” parameter, , which is sharply peaked about unity, as shown in the top inset of Figure 2.
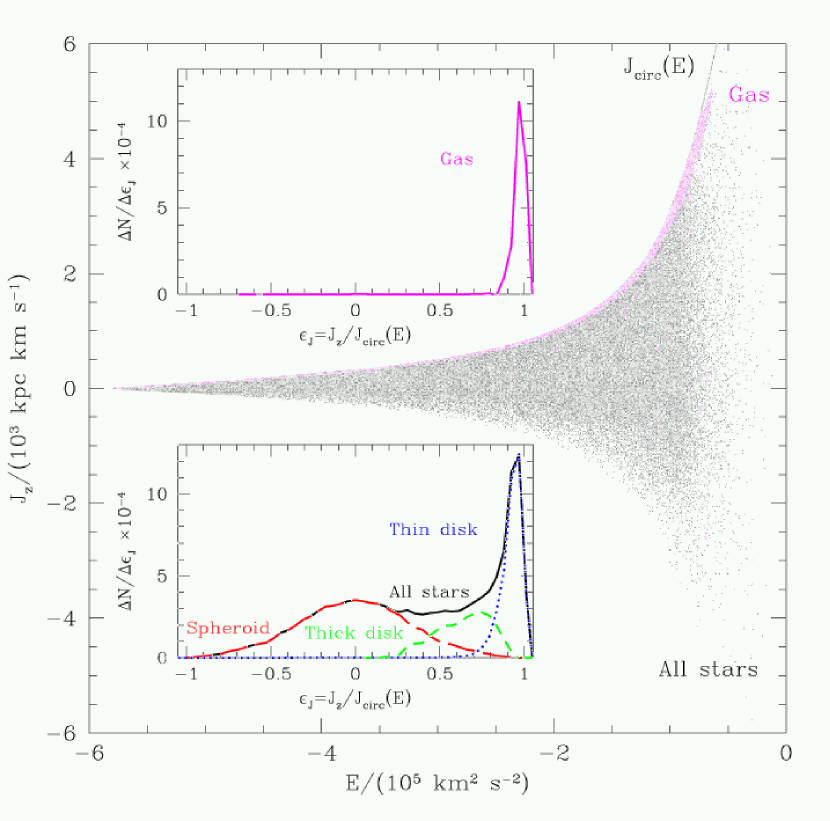
The circularity distribution of stars also shows a sharp peak at , but is quite broad and has approximately of stars on counter-rotating orbits (see solid line labelled “all stars” in the bottom inset of Figure 2). The shape of the distribution suggests the presence of at least two distinct dynamical components; a hot spheroid with as many stars in co- as in counter-rotating orbits, and a cold disk of stars with circularities resembling those of the gas and sharply peaked about unity. The curves labelled “spheroid” (long-dashed) and “thin disk” (dotted) indicate a possible decomposition into such components. This decomposition assumes that the spheroid has little net rotation, and that the circularity distribution of the thin disk is similar to that of a cold disk such as the thin disk of the Milky Way. Indeed, the circularity distribution of the “thin disk” identified in the bottom inset of Figure 2 is similar to that of a disk, where and are the velocity dispersion and the rotation speed of the disk, respectively.
The top and bottom right panels of Figure 1 show the spatial distribution of stars selected according to the circularity distributions labelled “spheroid” and “thin disk” in Figure 2, respectively. These panels confirm the intuitive expectation that the spheroid ought to be roughly spherical in shape whereas the thin disk is highly flattened, with an aspect ratio exceeding :.
The decomposition into spheroid and thin disk proposed here leaves, however, a number of stars on prograde orbits unassigned to either component (see the short-dashed curve labelled “thick disk” in Figure 2). These stars share the same sense of rotation as the thin disk but rely less on rotation for their support; as a result, they are distributed spatially on a “thick disk” shown in the bottom left panel of Figure 1.
It must be recognized that the identification of three distinct dynamical components, although compelling in light of the shape of the stellar circularity distribution, is nevertheless somewhat arbitrary. One may question, for example, our assumption that the spheroid does not rotate, or our assignment of essentially all stars on circular orbits to the thin disk (realistic models for the thick disk would typically have a sprinkling of such orbits as well). We have experimented with several possible decomposition procedures and report here results which, although they depend quantitatively on the exact definition adopted for each component, are qualitatively independent of such details and hold for every plausible decomposition procedure. We list the main parameters of each component in Table 1 and concentrate below on their origin as well as on their imprint on the photometric properties of the galaxy.
3.2 Photometric vs Dynamical Components
As discussed in Paper I, the surface brightness profile of the simulated galaxy resembles that of early-type spirals, and can be described very well by combining a central spheroid with a surrounding exponential disk. This is shown by the solid circles in Figure 3, where we show the -band surface brightness profile of the simulated galaxy seen face-on. The solid line through the circles corresponds to the best +exponential fit, whereas the curves labelled “” and “exp” indicate the contribution of each of these components to the fit. The best exponential fit splits the total light in the band roughly equally between the disk and the spheroid, as in early type spirals such as UGC615. The virtues and shortcomings of this comparison are discussed in detail in Paper I. Here we focus on the dynamical interpretation of the fitting procedure.
Does the photometric decomposition describe accurately the true dynamical importance of each component? Is the disk truly exponential? Is the spheroid really well approximated by de Vaucouleurs’ law? Our simulation offers intriguing clues to these questions. The inverted triangles and filled squares in Figure 3 show the contribution of the dynamically-identified thin disk and spheroid to the face-on -band surface brightness profile, respectively.
The spheroid contributes most of the -band light (); the thin disk and the thick disk (shown with upright triangles in Figure 3) the remaining . The total contribution of the (thick+thin) disk thus is of order , similar to that inferred from the photometric decomposition. This is somewhat surprising, since the individual profiles deviate strongly from the assumed and exponential laws. Indeed, neither component can be adequately approximated by one such law; both show a roughly exponential decay in the outer regions as well as a sharp upturn near the center well described by a de Vaucouleurs’ profile.
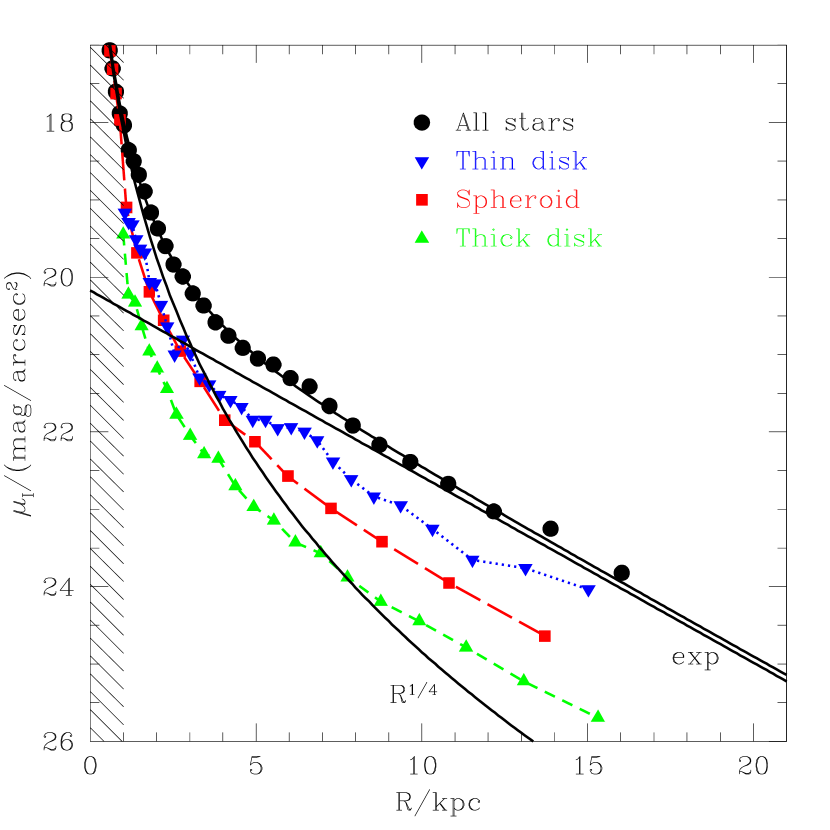
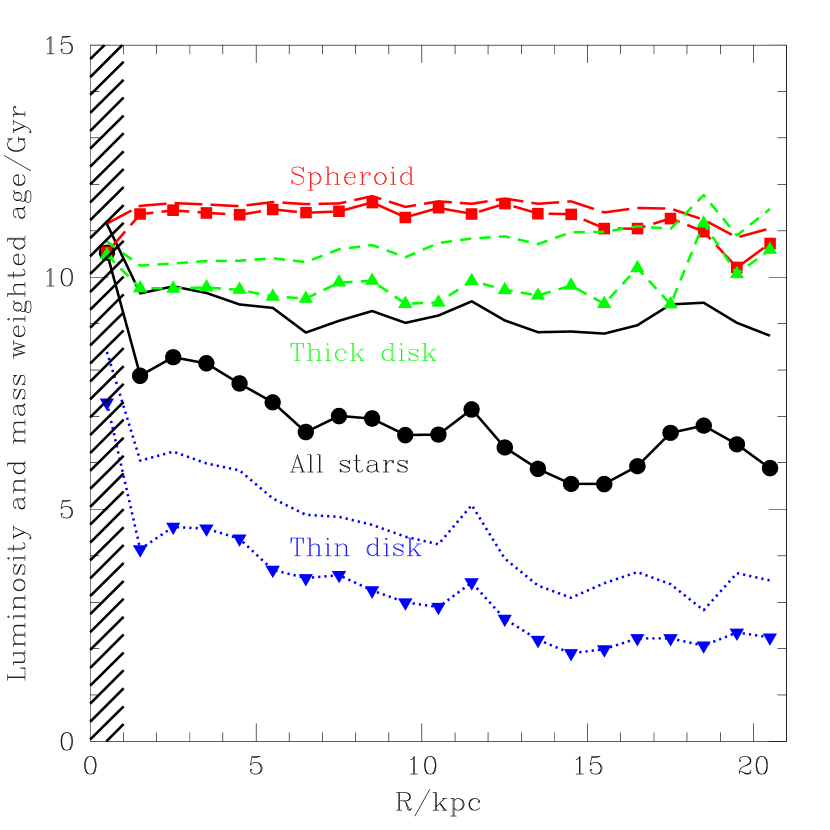
The contribution of the thin disk to the total stellar mass of the system is only ; its prominence in the surface brightness profile is due to its younger age (and thus lower mass-to-light ratio) compared with the spheroid. This is shown in Figure 4; the mean luminosity-(mass) weighted age of the thin disk is () Gyr; a full () Gyr younger than the spheroid. For a Scalo IMF (used throughout this analysis), this age difference results in the -band mass-to-light ratio of the thin disk being times brighter than the spheroid, accounting for the importance of the disk in the photometric decomposition. The thick disk is of intermediate age between the thin disk and the spheroid; its luminosity (mass)-weighted age is () Gyr.
Clearly, inferring the structural properties of the disk and spheroidal components from photometric decomposition alone is not straightforward. This may have important implications for studies that attempt to assess the relative importance of cold, centrifugally-supported disks and of hot, “pressure”-supported spheroids through photometric decomposition of large samples of galaxies (Schechter & Dressler 1987, Benson, Frenk & Sharples, 2002). In particular, our study shows that it is critical to account carefully for the age difference between components and its effect on the mass-to-light ratios: assuming similar mass-to-light ratios for the disk and spheroid would result in dramatic overestimation of the dynamical importance of the disk component.
The results shown in Figure 3 have repercussions as well for studies that rely on photometric decomposition to gain insight into the process of bulge formation. For example, the tight link between the spatial scalelengths of the spheroidal and disk components derived photometrically might not necessarily reflect a physical association between the two, as is usually interpreted in models that view the formation of the bulge as a result of secular evolution in the disk (MacArthur, Courteau, & Holtzman 2002, Courteau, de Jong, & Broeils 1996). For example, the half-mass radii of the thin disk and spheroid are and kpc, respectively, which should be contrasted with the and kpc that would be obtained from the best -band +exponential fit assuming constant mass-to-light ratios for each component.
Inferring the radial extent of the disk from photometric data alone thus leads to a overestimate of the half-mass radius. This is an important correction, since disk scalelengths estimated photometrically are usually used to estimate the angular momentum of galaxy disks (see Paper I and references therein). It is important that angular momenta computed from numerical simulations are estimated in the same way as observations in order to ensure that any discrepancies reflect genuine differences in angular momentum content and not systematic uncertainties in the estimation procedure.
With only one example, it would be premature to validate (or invalidate) the conclusions of the studies mentioned above, but clearly caution is highly recommended when using photometric data alone to assess dynamical theories for the origin of the components of the galaxy. We intend to return to this question when we have completed a more statistically significant sample of simulated galaxies.
3.3 Dynamical Components and Stellar Populations
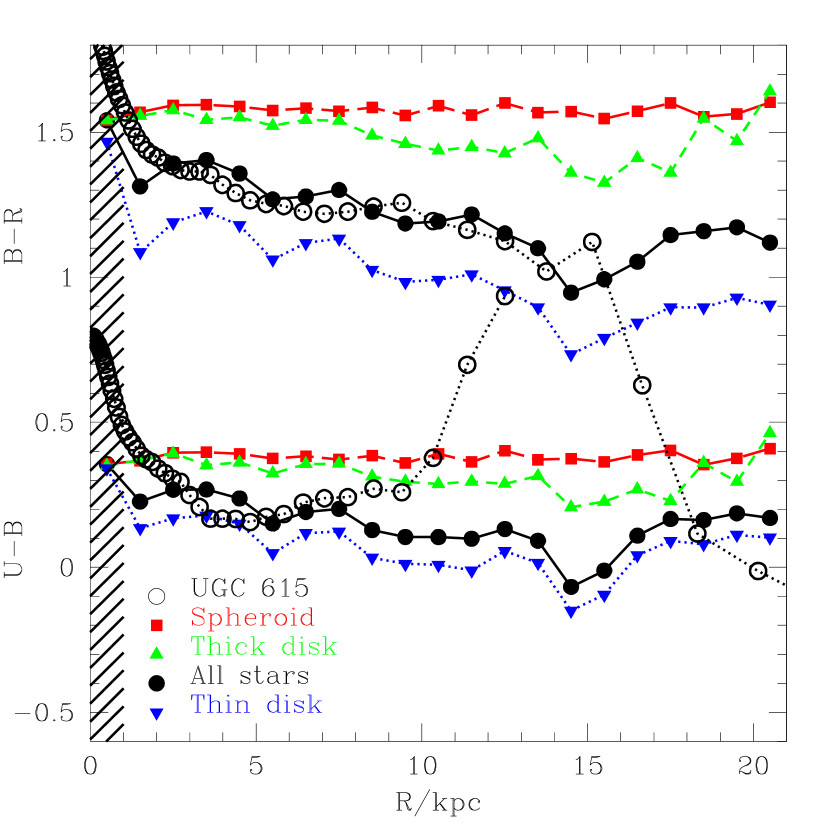
The dynamical distinction at the basis of the decomposition procedure described in § 3.1 is closely linked to the time and mode of assembly of each component. As shown in Figure 4a, the spheroid is old and very well mixed dynamically; its mass-weighted and luminosity-weighted ages are quite uniform across the galaxy, with little sign of a radial gradient. The thin disk, on the other hand, is fairly young and has a very well defined radial gradient as a result of its inside-out assembly; the luminosity (mass) weighted age drops from () Gyr at kpc to just about () Gyr at kpc. The age difference between components is reflected in their colors, as shown in Figure 4b. The color profile of the simulated galaxy as a whole (solid circles) shows a mild gradient, becoming bluer farther from the center, in good agreement with that of the Sab galaxy UGC615 (open circles). This trend is due almost entirely to the age gradient in the thin disk component shown in panel (a) of Figure 4; metallicity plays only a minor role in this result.
Our results confirm two of the basic expectations of galaxy models based on hierarchical accretion. (i) Spheroids are predominantly old and very well mixed dynamically by merger events which weaken any preexisting age or metallicity gradient in the progenitors. This is, of course, consistent with the Searle & Zinn (1978) interpretation of the lack of obvious gradients in the stellar halo of the Milky Way as due primarily to its formation through merging of protogalactic fragments. (ii) Centrifugally-supported disks, on the other hand, are built from the inside out and are on average much younger than spheroids. These results seem broadly consistent with observational data for external galaxies and for our own Milky Way. We turn next to the detailed dynamical origin of each component and to the subtle but important distinction between the thin and the thick disk components.
3.4 The Thin and Thick Disks
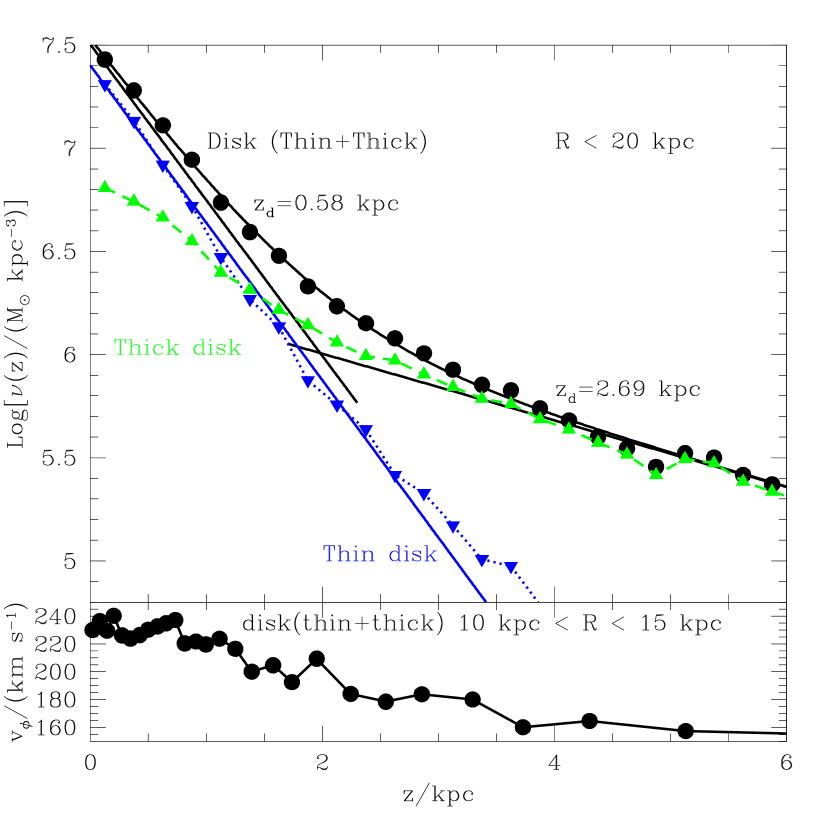
We have identified a “thick disk” component with stars on co-rotating (but rather eccentric) orbits which do not belong to either the thin disk or the spheroid, according to the decomposition procedure outlined in § 3.1. The combined thin+thick disk component (hereafter “the disk”, for short) resembles that of the Milky Way in several respects. Consider, for example, the vertical distribution of disk stars, shown in Figure 5. The -density profile deviates clearly from a simple exponential law, but is well approximated by the combination of two exponentials, with pc and kpc scaleheights respectively (see filled circles and solid lines in Figure 5).
Interestingly, stars identified dynamically as belonging to the thin disk follow closely an exponential profile as well, with scaleheight pc. The density profile of the thick disk is not exactly exponential, but the median height of its stars is not very different from that inferred from the double-exponential fit. The disk rotates significantly slower at higher , as shown in the bottom panel of Figure 5. The mean rotation speed in the outskirts of the disk ( kpc ¡ R ¡ kpc, where the rotation curve is approximately flat, see Paper I) drops from km/s on the plane of the disk to km/s at kpc.
Are the thick and thin disks really distinct components, or is the double exponential profile shown in Figure 5 just a manifestation of a rotationally-supported structure intrinsically more complex than a simple exponential? To be meaningful, a dynamical decomposition between thick and thin disk components must also identify other independent attributes, such as age or metallicity, which neatly divide the stellar population into similar components. In the case of the Milky Way, the metallicity and age distributions of disk stars support the idea that the thin and thick disks are truly distinct components of independent origin. Besides having higher velocity dispersion, thick disk stars are typically older and more metal poor than thin disk stars, and appear to divide “naturally” into two components in the age/metallicity plane (see, e.g., §10.4.3 of Binney & Merrifield 1998).
The distinction between thin and thick disks is also often illustrated by simultaneously ranking stars by their metal abundance and by their vertical speed (see Freeman 1991). Since our treatment of metal enrichment is rather rudimentary (§ 2.1), we illustrate the same idea using age rather than metallicity as one of the ranking variables. The break at Gyr seen in the top panel of Figure 6 is highly suggestive of the presence of two components of distinct nature and origin: one young and cold, well approximated by a velocity dispersion of km s-1, overlapping an older population of stars with a velocity dispersion roughly three times as high. (A Gaussian distribution of velocities would show as a straight line in this plot.)
This interpretation is confirmed by the velocity dispersion-age relation for disk stars shown in the bottom panel of Figure 6, where a sharp upturn in velocity dispersion is noticeable for stars older than Gyr. These results support the view that the thin and thick disks are truly distinct components, and point to a major occurrence in the assembly of the galaxy roughly Gyr ago: this timescale coincides with the epoch of the last major accretion event.
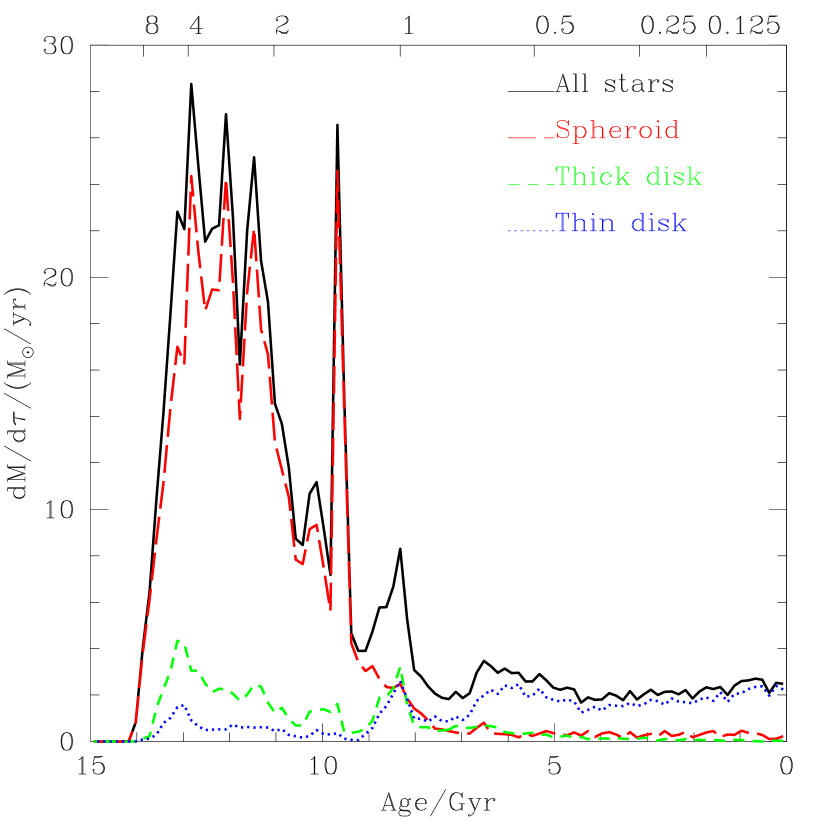
Major accretion events usually trigger profuse star formation and thus show clearly in the distribution of stellar ages shown in Figure 7. For example, the sharp peak at age Gyr corresponds to a merger event which increases the stellar mass of the galaxy by almost . Similarly, the broad peak at Gyr is associated with the nearly simultaneous accretion of two satellites; these and the associated starburst boost the stellar mass of the galaxy by . Subsequently, the main galaxy is disturbed only by the accretion of two minor satellites (at ), each contributing less than of the current stellar mass of the galaxy. At lookback times less than Gyr most stars form (and remain) in a thin disk as a result of the gradual transformation into stars of cooled gas accreted smoothly into the main body of the galaxy.
Clearly, the sharp decline in merger activity which occurred Gyr ago is the watershed event responsible for initiating the formation of the thin disk and for establishing the neat separation between the thin and thick disk components. The bulk of thick disk stars is therefore older than Gyr and the majority of thin disk stars form after that epoch. We explore next the origin of the thick disk in the simulated galaxy and the applicability of these findings to the formation of the Milky Way’s thick disk.
3.5 The Origin of the Thick Disk
As discussed in § 1, dynamical data in the solar neighborhood are usually interpreted within a scenario where the thick disk results from the tidal heating of an early thin stellar disk. Does the thick disk in the simulated galaxy form in this way? We can test this proposal directly by tracing the stars assigned to the thick disk at and by inspecting their configuration at the time of the last major merger.

The result of this exercise is summarized in the bottom panel of Figure 8. This figure shows, as a function of age, the mass fraction of each component which formed within the main progenitor of the simulated galaxy. The evolution of this “in situ”-formed mass fraction is similar for the thin and thick disks, and indicate that essentially all disk stars younger than Gyr were formed within the main galaxy, a result consistent with the lack of major accretion events since .
On the other hand, the majority of old disk stars were formed in systems other than the main progenitor; only about of disk stars older than Gyr were formed in the main progenitor of the galaxy. This implies that the bulk of old disk stars are actually tidal debris from disrupted satellites. Since the thick disk is quite old (only of its stars are younger than Gyr, see the top panel of Figure 8), this rules out the hypothesis that the thick disk is the remnant of a stirred pre-existing thin disk and points to tidal disruption as the main process of assembly of the thick disk. About of thick disk stars older than Gyr are debris from tidally disrupted satellites; in total, more than of thick disk stars of all ages were brought in by satellites, the rest were mostly formed during the accretion events themselves.
Interestingly, although the bulk of the thick disk consists of debris from tidally disrupted satellites, the fraction of spheroid stars identified as tidal debris is only of the total. The other half of the stars in the spheroid formed in a disk-like component in the main galaxy but were dispersed into the spheroid as a result of a major (:) merger at ( Gyr ago). Thus, our results suggest that, contrary to what might be naively expected, it would be easier to find remnants of tidal stripping events in the old disk component rather than in the spheroid.
Considering the thick disk as the accumulated tidal debris of disrupted satellites rather than as an early thin disk thickened by an accretion event helps to resolve the angular momentum puzzle alluded to in § 1. The high angular momentum content of the thick disk does not reflect the presence of a large disk at high redshift but rather the orbital angular momentum of disrupted satellites, some of which were aggregated into the main galaxy relatively recently. In our simulation, for example, half of the stars in the thick disk are older than Gyr, but were fully accreted into the main progenitor only Gyr ago. We explore below how this result also affects the interpretation of very old stars on circular orbits in the outskirts of the disk galaxies.
3.6 The Old Thin Disk
As discussed in § 1, the existence of disk stars which predate the epoch of the last major merger but which are nevertheless found today on nearly circular orbits is puzzling in hierarchical assembly models of disk formation. Debris from tidally disrupted satellites offers again a plausible explanation for the presence of such a component. The simulated galaxy has a well defined “old thin disk” population; indeed, Figure 8 shows that of the thin disk stars are older than Gyr, and therefore formed long before the time of the last major accretion event. As shown in the bottom panel of the same Figure, essentially all of these stars were formed in satellites and brought into the main galaxy much later; the last of these “old thin disk” stars was only incorporated into the main galaxy roughly Gyr ago.
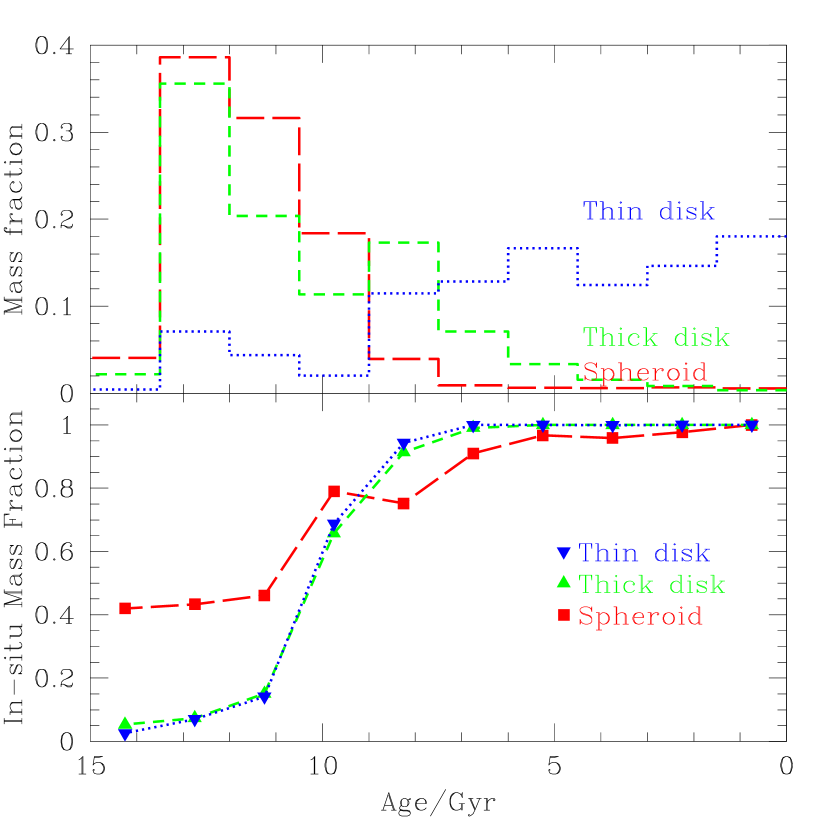
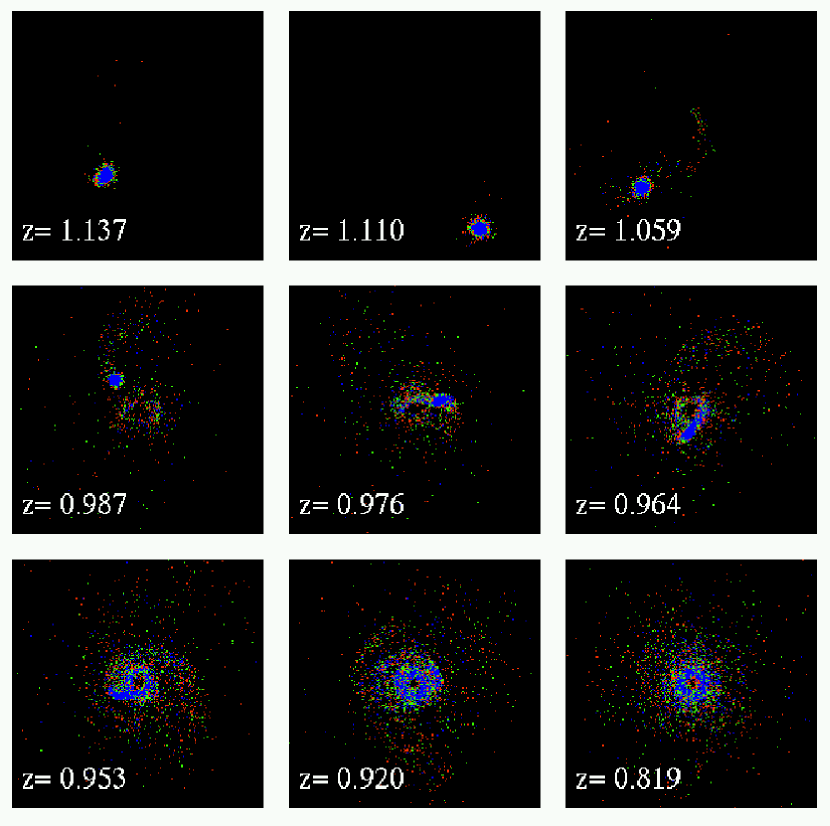
Figure 8 thus demonstrates that tidal debris from satellites can contribute not only to the spheroid (as is usually assumed) but also to the thin and thick disk components. A satellite’s contribution to either component (or to the spheroid) depends mainly on its orbit and on the degree to which dynamical friction circularizes the orbit before disruption. In order to contribute significantly to the disk, a satellite must have an orbital plane roughly coincident with that of the disk and be dense enough to survive disruption until its orbit has been circularized within the disk.
This intuitive expectation is confirmed by the data presented in Table 2, where we list the structural properties and orbital parameters of four different satellites accreted after . This Table lists the satellite’s orbital circularity, as well as the fraction of stars that end up, at , in the spheroid, thin disk, and thick disk components, respectively. Since the orbital properties change significantly with time, we have chosen to measure them at , the time of their last apocentric passage before significant disruption takes place.
As expected, satellites on orbits of high circularity are seen to contribute principally to the disk component rather than to the spheroid, and viceversa. Closer inspection shows that it is the satellite’s core that contributes primarily to the thin disk whilst stars in its outskirts end up primarily in the thick disk or spheroid (see Figure 9). This is fully consistent with the notion that dynamical friction circularizes the orbit of the satellite prior to disruption: stars at the core of the satellite are more resilient to disruption and therefore end up on more circular orbits than those stripped earlier during the satellite decay process.
The discussion above implies that, although the disk component is formed overall from the inside out (see, e.g., Figure 4), a small fraction of old stars on circular orbits is expected at essentially all radii as a result of satellite accretion. Is this a result of general applicability or just a fluke in this simulation? The answer depends on the incidence of capture of satellites on orbital planes roughly coincident with that of the disk of the galaxy.
With the obvious caveat that it is perilous to generalize from a single example, there is indication that the accretion of such satellites might not be uncommon in hierarchical scenarios. As Table 2 indicates, all satellites accreted by the galaxy since co-rotate with the disk and, after disruption, contribute roughly of their stars to the disk. This result, as well as the relatively high frequency of satellites with orbital planes coincident with the disk, are apparently related to the fact that much of the late accreting material (which effectively forms the disk) flows in through a filament.
This filament inevitably contains previously collapsed, condensed subsystems; satellites whose orbits share the properties of the material responsible for the formation of the disk. If dense enough, these satellites survive disruption until after their orbits are circularized and contribute a substantial fraction of their stars to the disk. We expect this to be a common feature of the hierarchical formation process of a disk galaxy, implying that the majority of galactic disks ought to have a significant population of old stars on orbits similar to those of young disk stars but with distinct properties such as age and metallicity. We intend to explore fully the consequences of this idea in future papers of this series. We discuss briefly below the implications of these findings for the Milky Way galaxy.
3.7 Implications for the Milky Way
The discussion above illustrates the important clues to the accretion history of the galaxy retained in the detailed dynamics and structure of the oldest stellar populations. In particular, it shows conclusively that relicts of past accretion and disruption events might be found today not only in the stellar halo of the Galaxy, as is commonly assumed (Helmi et al. 1999, Majewski et al 2000), but also in the cold, centrifugally supported disk component. As mentioned above, tidal debris is proportionally more abundant in the old disk component of the simulated galaxy than in the old spheroid; of disk stars older than Gyr are the relicts of disrupted satellites, well in excess of the of the old stellar spheroid contributed by satellite debris. This suggests that it would be profitable to search for signatures of accretion events in the disk as well as in the halo components; indeed, such relicts may have already been detected in the unexpected dynamics of stars above and below the plane of the Galaxy reported by Gilmore et al (2002).
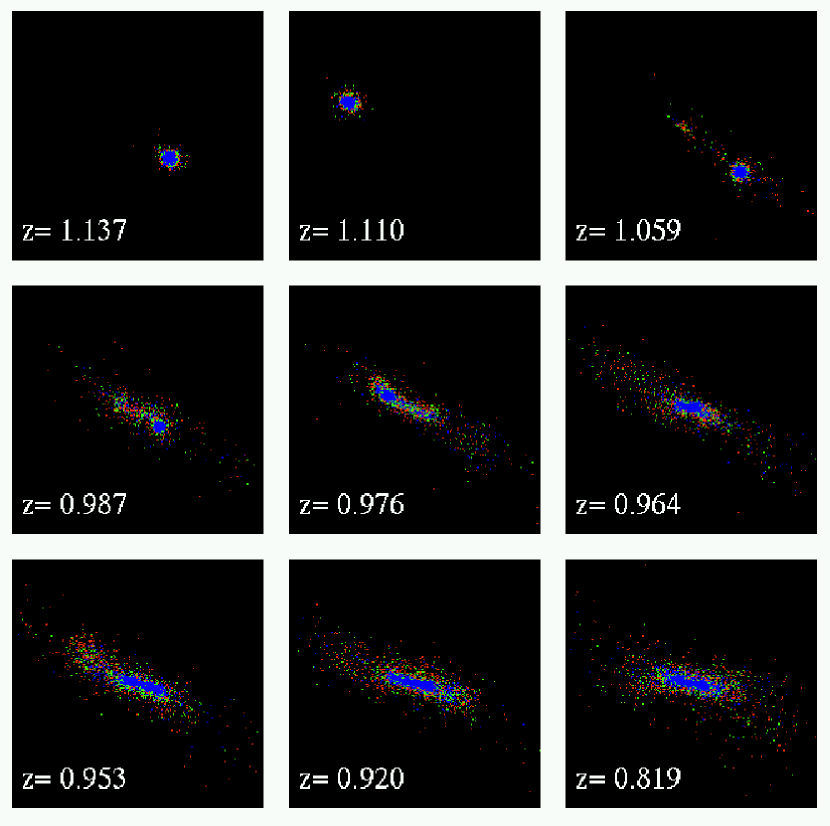
Could the “old disk” in the Milky Way be made up of the remains of disrupted satellites? It is important to verify that this proposal is consistent with the observation that the radial distribution of old disk stars is not very different from that of the younger thin disk component. This is especially true because stars from a single disrupted satellite are not uniformly mixed radially but rather form a torus-like structure whose radius is determined by the location at which final disruption occurs. This is clearly shown in Figure 9, where the stars of satellite (see Table 2) are shown at different times during its disruption. Once the disruption is complete, the satellite stars are distributed along a thin “ring” of stars at a radius kpc from the center.
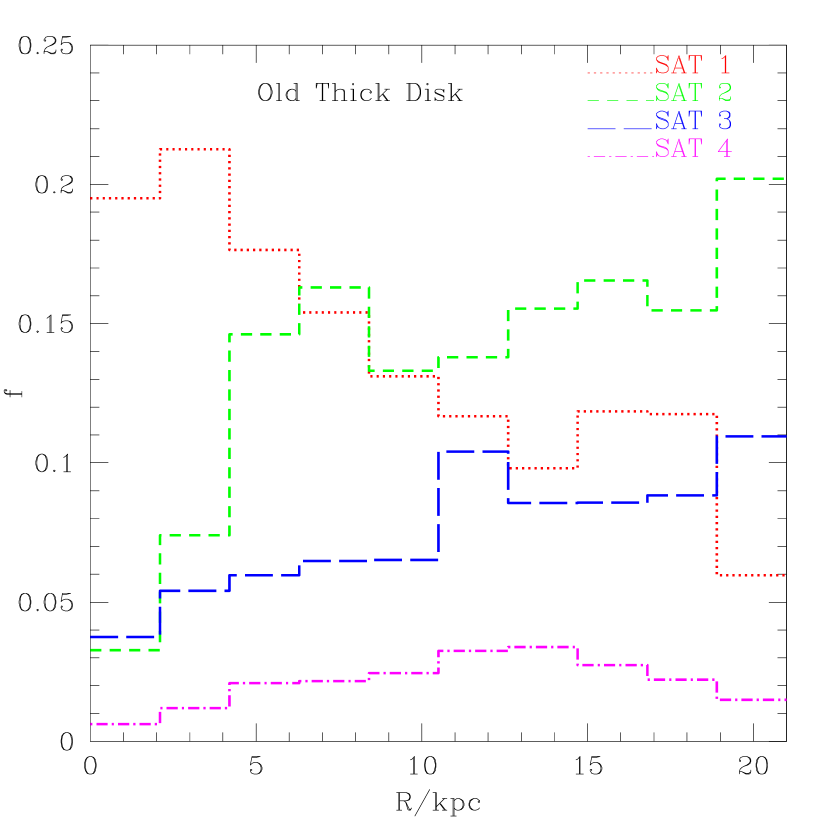
On the other hand, several satellites contribute to the old disk component, and each contributes in varying amounts at different radii. This is shown in the left panel of Figure 11; the debris from satellite dominates the inner regions ( kpc) of the old thick disk, whereas debris from satellite is the principal contributor to the outer regions. Satellites and contribute fewer stars at all radii because their orbits are far less circular (see Table 2).
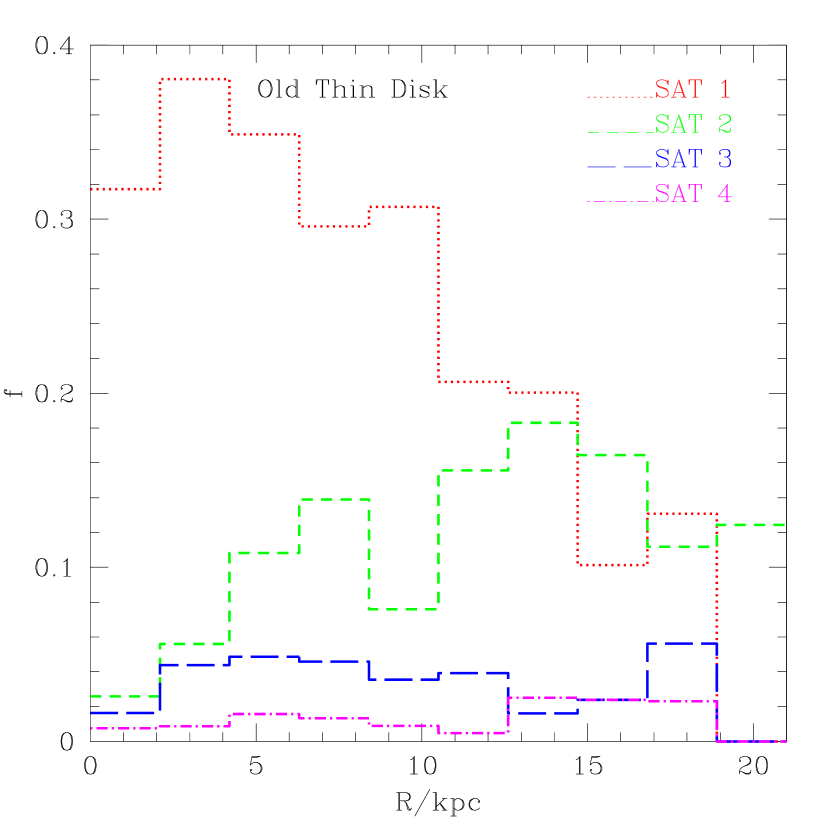
Fewer satellites are likely to contribute to the thin disk than to the thick disk. This implies that, at given radius, the old thin disk might be dominated by the contribution of a single satellite. This is indeed the case in the simulated galaxy at kpc, as shown in Figure 11b. Systematic variations in the properties of old disk stars as a function of their rotational support are thus expected and should contain intriguing clues to the early assembly process of the disk. This subtle modulation might be observable in our own Milky Way, once surveys such as those planned for the space-based GAIA mission (Perryman et al 2001) and the ground-based RAVE project (Steinmetz 2002)—where full dynamical information will be available for large samples of stars well beyond the solar neighborhood—are completed.
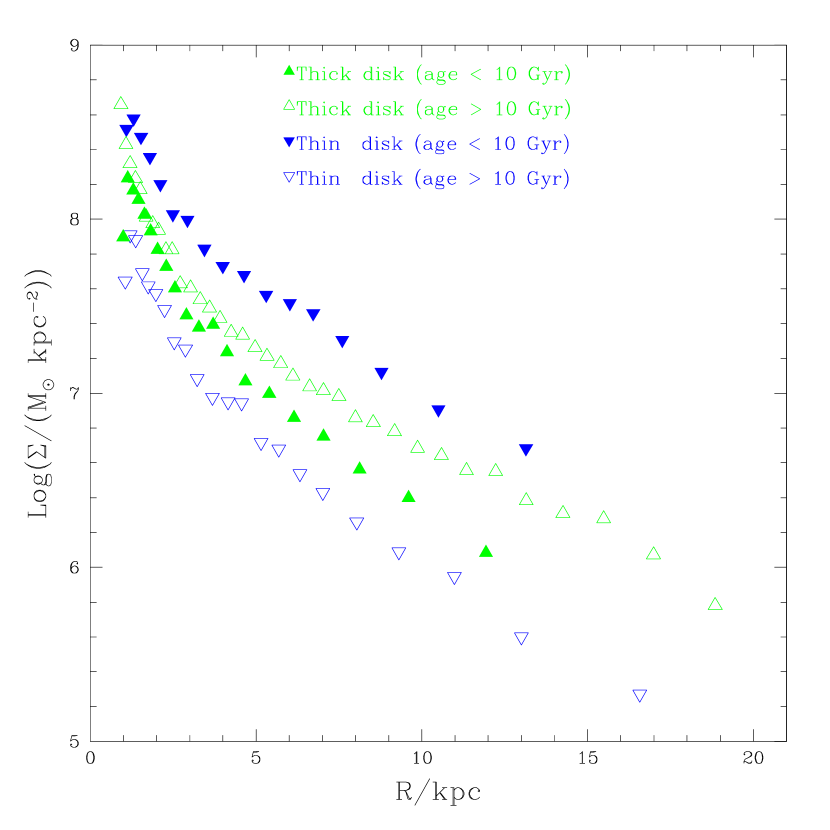
Overall, the radial overlap of debris from several disruption events results in a radial distribution of old disk particles that differs little from that of the young disk component, in agreement with observation. This is illustrated in Figure 12, where we show the surface density profile of the “young” and “old” disk components. There are no major differences in the radial distribution of the old and young disks; the half-mass radius of the old thin (thick) disk is () kpc, comparable to that of the young thin (thick) disk, () kpc, despite the large difference in the mean age of each component. The late accretion of satellites with orbits coincident with the disk thus explains the puzzle alluded to in § 1 regarding the radial extent (and angular momentum content) of the older, thicker disk component of the Galaxy.
If much of the old thick (and thin) disk is indeed debris from tidally disrupted satellites, their metallicities must reflect the metallicity of the satellites themselves. Since metallicity and luminosity are strongly correlated in dwarf systems, then one may use the metallicity of the old disk component to infer the luminosity of the disrupted satellite. For example, if the metallicity of the thick disk is taken to be [Fe/H], one would infer that the luminosity of its progenitor satellite had a luminosity comparable to that of the LMC, (see Figure 8 of van den Bergh 1999).
Another important implication of this idea is that the same satellite can contribute both to the old thin and thick disks. This implies that these two components should exhibit a clear overlap in properties, reflecting their common origin in a single system. This is reminiscent of the results of Wyse & Gilmore (1995), who argue that the dynamical and metallicity distributions of disk stars can only be explained if stars with abundances [Fe/H] contribute in substantial amounts to both the thick and thin disk components.
We end this discussion with the obvious caveat that, although we find the formation mechanism of the old disk proposed here attractive and applicable to the Milky Way, the simulated galaxy is not intended to be a model of the Galaxy. Further simulation work is required to ascertain the general validity of the results reported here and their applicability to the Milky Way and other spirals.
4 Summary
We present a detailed analysis of the dynamical components of a galaxy simulated in the “concordance” CDM cosmogony. The galaxy forms in a dark matter halo chosen so that mergers and accretion events are unimportant dynamically after . Star formation and feedback parameters are such that the star formation history of the galaxy is largely driven by the rate at which gas cools and collapses within dark halos: this is a conservative choice where feedback effects are relatively unimportant. The shortcomings of this assumption concerning the global photometric and structural properties of the simulated galaxy are discussed in Paper I. We focus here on the multi-component nature of the stellar disk and on their dynamical origin. Our main results can be summarized as follows.
-
•
At , two separate stellar components are easily distinguishable solely on the basis of the orbital parameters of stars in the galaxy: a slowly rotating, centrally concentrated spheroid and an extended disk-like component largely supported by rotation.
-
•
These components are also recognized in the surface brightness profile of the galaxy, which can be very well approximated by the superposition of an spheroid and an exponential disk, in agreement with observations of early-type spirals.
-
•
Neither does the dynamically identified spheroid follow closely de Vaucouleurs’ law nor is the disk purely exponential, a result which calls for caution in the interpretation of estimates of the dynamical importance of the disk and spheroid in traditional photometric decomposition techniques.
-
•
The spheroid is old, and has essentially no stars younger than the last major accretion episode; Gyr ago for the system we consider here. The majority of thin disk stars, on the other hand, form after the merging activity is over and have a mean age of Gyr.
-
•
The disk may be further decomposed into two well defined subcomponents: a thin, dynamically cold disk of stars on nearly circular orbits and a thicker disk with orbital parameters transitional between the thin disk and the spheroid. Supporting evidence for the true presence of these two distinct components is found, as in the Milky Way, in the double-exponential vertical structure of the disk and in abrupt changes in the vertical velocity distribution as a function of age.
-
•
The bulk () of the thick disk consists of the tidal debris of satellites whose orbital plane was coincident with the disk and whose orbits were circularized by dynamical friction prior to full disruption. This trend becomes more pronounced with age; of stars older than Gyr and presently in the thick disk component were brought into the disk by satellites.
-
•
A significant fraction () of thin-disk stars are old enough ( Gyr) to predate the last major accretion event. The bulk of this unexpected population of old stars on nearly circular orbits share a common origin with the old thick disk: they are the remains of the cores of disrupted satellites. Interestingly, only one in two stars belonging to the old spheroid are tidal debris; the rest may be traced to a major merger event that disperses the luminous progenitor at and seeds the formation of the spheroid.
Our results offer clues to understanding a number of observational trends that challenge the standard hierarchical disk assembly process. In particular, the presence of an old disk component made up primarily of tidal debris from disrupted satellites helps to explain: (i) the presence of a significant number of old stars on circular orbits in the outskirts of galaxies like the Milky Way, and (ii) why the specific angular momentum and radial extent of the thick and thin disk components are comparable in spite of the significantly different ages of their individual stars. It also offers a “natural” explanation for the clear dynamical and evolutionary distinction between the thin and thick disk components: the thick disk is mostly tidal debris from disrupted satellites whereas the young thin disk consists mostly of stars formed “in situ” after the merging activity abates.
These findings highlight the role of satellite accretion events in shaping the disk—as well as the spheroidal—components of a galaxy and reveal some of the clues to the assembly process of the galaxy preserved within the detailed dynamics of old stellar populations. We emphasize that these conclusions are based on the detailed analysis of a single simulation and that further work is needed to put these results on a firmer basis as well as to establish their true applicability to the origin of the dynamical components of the Milky Way. We plan to explore these issues in detail in future papers of this series.
References
- Abadi, Navarro, Steinmetz & Eke (2002) Abadi, M.G., Navarro, J.F., Steinmetz, M. & Eke, V.R. 2002, astro-ph/0211331 (Paper I)
- Bahcall, Ostriker, Perlmutter, & Steinhardt (1999) Bahcall, N. A., Ostriker, J. P., Perlmutter, S., & Steinhardt, P. J. 1999, Science, 284, 1481
- Benson, Frenk, & Sharples (2002) Benson, A. J., Frenk, C. S., & Sharples, R. M. 2002, ApJ, 574, 104
- Binney & Merrifield (1998) Binney, J. & Merrifield, M. 1998, Galactic astronomy / James Binney and Michael Merrifield. Princeton, NJ : Princeton University Press, 1998. (Princeton series in astrophysics)
- Charlot & Fall (2000) Charlot, S. ;. & Fall, S. M. 2000, ApJ, 539, 718
- Contardo, Steinmetz, & Fritze-von Alvensleben (1998) Contardo, G., Steinmetz, M., & Fritze-von Alvensleben, U. 1998, ApJ, 507, 497
- Courteau, de Jong, & Broeils (1996) Courteau, S., de Jong, R. S., & Broeils, A. H. 1996, ApJ, 457, L73
- Dalcanton & Bernstein (2002) Dalcanton, J. J. & Bernstein, R. A. 2002, AJ, 124, 1328
- Freeman (1991) Freeman, K. C. 1991, in Dynamics of Disc Galaxies, edited by B. Sundelius (Goteborgs University, Goteborg), p. 15
- Gilmore, Wyse, & Jones (1995) Gilmore, G., Wyse, R. F. G., & Jones, J. B. 1995, AJ, 109, 1095
- Gilmore, Wyse, & Norris (2002) Gilmore, G., Wyse, R. F. G., & Norris, J. E. 2002, ApJ, 574, L39
- Helmi, White, de Zeeuw, & Zhao (1999) Helmi, A., White, S. D. M., de Zeeuw, P. T., & Zhao, H. 1999, Nature, 402, 53
- Huang & Carlberg (1997) Huang, S. & Carlberg, R. G. 1997, ApJ, 480, 503
- Liu & Chaboyer (2000) Liu, W. M. & Chaboyer, B. 2000, ApJ, 544, 818
- Majewski et al. (2000) Majewski, S. R., Ostheimer, J. C., Patterson, R. J., Kunkel, W. E., Johnston, K. V., & Geisler, D. 2000, AJ, 119, 760
- MacArthur, Courteau, & Holtzman (2002) MacArthur, L.A., Courteau, S., & Holtzman, J.A. 2002, astro-ph/0208404
- Mo, Mao, & White (1998) Mo, H. J., Mao, S., & White, S. D. M. 1998, MNRAS, 295, 319
- Moore (2001) Moore, B. 2001, 20th Texas Symposium on relativistic astrophysics, 73
- Navarro & Benz (1991) Navarro, J. F. & Benz, W. 1991, ApJ, 380, 320
- Navarro & Steinmetz (1997) Navarro, J. F. & Steinmetz, M. 1997, ApJ, 478, 13
- Navarro & Steinmetz (2000) Navarro, J. F. & Steinmetz, M. 2000, ApJ, 538, 477
- Perryman et al. (2001) Perryman, M. A. C. et al. 2001, A&A, 369, 339
- Prochaska et al. (2000) Prochaska, J. X., Naumov, S. O., Carney, B. W., McWilliam, A., & Wolfe, A. M. 2000, AJ, 120, 2513
- Quinn, Hernquist, & Fullagar (1993) Quinn, P. J., Hernquist, L., & Fullagar, D. P. 1993, ApJ, 403, 74
- Rocha-Pinto, Scalo, Maciel, & Flynn (2000) Rocha-Pinto, H. J., Scalo, J., Maciel, W. J., & Flynn, C. 2000, A&A, 358, 869
- Schechter & Dressler (1987) Schechter, P. L. & Dressler, A. 1987, AJ, 94, 563
- Searle & Zinn (1978) Searle, L. & Zinn, R. 1978, ApJ, 225, 357
- Sellwood & Kosowsky (2001) Sellwood, J. A. & Kosowsky, A. 2001, ASP Conf. Ser. 240: Gas and Galaxy Evolution, 311
- Steinmetz (1996) Steinmetz, M. 1996, MNRAS, 278, 1005
- Steinmetz (2002) Steinmetz, M. 2002, astro-ph/0211417
- Steinmetz & Navarro (1999) Steinmetz, M. & Navarro, J. F. 1999, ApJ, 513, 555
- Toth & Ostriker (1992) Toth, G. & Ostriker, J. P. 1992, ApJ, 389, 5
- van den Bergh (1999) van den Bergh, S. 1999, A&A Rev., 9, 273
- Velazquez & White (1999) Velazquez, H. & White, S. D. M. 1999, MNRAS, 304, 254
- Walker, Mihos, & Hernquist (1996) Walker, I. R., Mihos, J. C., & Hernquist, L. 1996, ApJ, 460, 121
- Wyse (2000) Wyse, R. F. G. 2000, The Galactic Halo : From Globular Cluster to Field Stars, 305
- Wyse & Gilmore (1995) Wyse, R. F. G. & Gilmore, G. 1995, AJ, 110, 2771
| Label | ||||||||
|---|---|---|---|---|---|---|---|---|
| [] | [] | [] | [] | [kpc] | [kpc] | |||
| spheroid | ||||||||
| disk | ||||||||
| thin disk | ||||||||
| thick disk |
Note. — Summary of the properties of the dynamically-identified components of the galaxy. All quantities are computed within kpc. We note that not all star particles have the same mass. Quantities labelled with a “fit” superscript are computed from the photometric +exponential best fit described in § 3.2. () denotes the half-mass (light) radius of each component; their average circularity.
| Label | |||||||
|---|---|---|---|---|---|---|---|
| [] | [kpc] | ||||||
Note. — Properties of four satellites accreted by the main galaxy after . is the stellar half-mass radius, and the orbital circularity measured at , the redshift of the last apocentric passage of the satellite before significant disruption takes place. The parameters , , and denote the fraction of stars that end up, at in the thin disk, thick disk, or spheroidal component of the galaxy, respectively. Note the good correlation between the orbital circularity and the fraction of stars that contribute to the disk component.