CO () Observations of NGC 253: Cosmic Ray Heated Warm Molecular Gas
Abstract
We report observations of the CO transition toward the starburst nucleus of NGC 253. This is the highest-excitation CO measurement in this source to date, and allows an estimate of the molecular gas excitation conditions. Comparison of the CO line intensities with a large velocity gradient, escape probability model indicates that the bulk of the 2–5 of molecular gas in the central 180 pc is highly excited. A model with T 120 K, is consistent with the observed CO intensities as well as the rotational H2 lines observed with ISO.
The inferred mass of warm, dense molecular gas is 10–30 times the atomic gas mass as traced through its [C II] and [O I] line emission. This large mass ratio is inconsistent with photodissociation region models where the gas is heated by far-UV starlight. It is also not likely that the gas is heated by shocks in outflows or cloud-cloud collisions. We conclude that the best mechanism for heating the gas is cosmic rays, which provide a natural means of uniformly heating the full volume of molecular clouds. With the tremendous supernova rate in the nucleus of NGC 253, the CR heating rate is at least 800 times greater than in the Galaxy, more than sufficient to match the cooling observed in the CO lines.
1 Introduction
NGC 253 is a nearby ( Mpc; Mauersberger et al., 1996 ), nearly edge-on (, Pence 1981), isolated starburst galaxy with the starburst strongly concentrated at the nucleus. Based on the distribution of the 10–30 m continuum, the bulk of NGC 253’s starburst is confined to a pc region centered just south-west of the dynamical nucleus (Telesco, Dressel, & Wolstencroft, 1993). The 1–300 m luminosity within about 30′′ is (Telesco & Harper, 1980) while the total IR luminosity of NGC 253 detected by IRAS is (Rice et al., 1988). There is a clear bar in the 2MASS image of the galaxy, and the kinematics show evidence for orbits in a bar potential (Scoville et al. 1985; Das et al. 2001, and references therein). The bar likely plays a role in transporting gas to the nucleus and thus supporting the starburst. Current estimates of the neutral gas mass in the central range from (Harrison, Henkel, & Russell, 1999, hereafter HHR99) to (Houghton et al., 1997).
As is the case in many of the nearby starburst galaxies, much of the molecular gas in NGC 253 appears to be highly excited (Wild et al., 1992; Mao et al., 2000; Ward et al., 2002). Observations of and transitions of CO (Israel & Baas, 2002; Harris et al., 1991), as well as and transitions of HCN (Paglione et al., 1995, 1997) suggest that a large fraction of the molecular gas in the nucleus of NGC 253 has and or higher. Observations of higher-J CO transitions are critical to measure this warm molecular gas component, and probe its physical conditions. In our Galaxy, the warm, dense molecular gas conditions which excite the mid-J CO lines (J = 4–8) are typically associated with molecular cloud surfaces exposed to stellar far-UV radiation. In these photodissociation regions (PDRs), the UV dissociates and ionizes the gas as it enters the cloud and is absorbed by dust. The result is a layered geometry based on the extinction of UV; the progression from the exterior inward is ionized, neutral atomic, warm molecular, and finally cool molecular gas on the interior (Tielens & Hollenbach, 1985; Wolfire, Tielens, & Hollenbach, 1990; Kaufman et al., 1999). Several of these regions have been studied in star formation sites within the Galaxy (Harris et al., 1985; Schmid-Burke et al., 1989; Stacey et al., 1993), and they have been discussed in the context of starburst nuclei (Mao et al., 2000; Carral et al., 1994). Other potential molecular gas heating sources are outflows and cloud-cloud collisions in which shocks convert dynamical energy to thermal energy of the gas, such as in the circumnuclear disk of the Galactic Center, and in the massive star formation sites W 51 and DR 21 (Jaffe, Harris, & Genzel, 1987; Jaffe et al., 1989). Finally, it has been proposed that much of the molecular gas heating in starburst nuclei may be due to cosmic rays (Suchkov, Allen, & Heckman, 1993, hereafter SAH). To better understand the energy balance of the molecular gas in the starburst nucleus of NGC 253, we have observed the CO transition with our submillimeter imaging spectrometer, SPIFI on the JCMT.
2 Observations
NGC 253 was observed in April 1999 during the commissioning run of the South Pole imaging Fabry-Perot interferometer (SPIFI) (Bradford et al., 2002) at the James Clerk Maxwell Telescope (JCMT) on Mauna Kea, Hawaii. The Fabry-Perot interferometer (FPI) was set to a velocity resolution of 70 km s-1 and was scanned over 620 km s-1 with the center wavelength of the scan set to the redshifted (250 km s-1) CO rotational transition. The FPI scan length was measured with interference fringes of a He-Ne laser, and absolute frequency reference was an absorption spectrum of the CO transition from gas in a cell against a hot load. On this observing campaign the bolometer array was equipped with 12 functioning detectors arranged on a grid with four blanks. Because of a figuring error in the polyethylene lenses used as a f-converter, the main beam as measured with Mars had a size of (FWHM), 1.6 times bigger than the diffraction-limited beam size of per pixel. Mars was also used for flux calibration assuming a brightness temperature of 201 K (Wright, 1976; Rudy et al., 1987). Flat-fielding of the array was accomplished by rastering Mars around the array. For the period of the observations, the zenith atmospheric transmission was between 0.22 and 0.29, giving a transmission to the source between 0.05–0.12. This low and variable atmospheric transmission provided the greatest calibration uncertainty, which we estimate to be about 30%. For the observation of NGC 253 the array was centered at the IR nucleus at , (1950) ((0,0)-position). We estimate our pointing accuracy to be 5′′. The data were obtained by chopping and nodding the telescope and the data presented here were obtained with 20 minutes on-source integration. The 50 minute duration of the observations resulted in a field rotation of 18∘ about the center of the array, producing a total travel of 7′′ (3.5′′ about the mean) for the corners of the array. Because this is comparable to the pointing uncertainty, and is substantial only for the corner pixels, we neglect the rotation and adopt the mean position angle.
3 Results
3.1 Comparison with Other Molecular Tracers
Figure 1 shows the spectra obtained in this single array pointing toward the nucleus of NGC 253. The data are plotted in main beam brightness temperature units, correcting for beam efficiency, atmospheric transmission, and source coupling. Typical spectra peak at 3–5 K, with a single spectrum showing a peak of 12 K; integrated intensities are between 400 and 1200 K km s-1. The integrated intensities in K km s-1 are roughly half of the CO intensities of Harris et al. (1991), when the antenna temperatures are corrected to a main beam. The peak temperature of 12 K at km s-1 in the spectrum just northeast of the nucleus has a similar peak above the Gaussian profile in the spectrum toward the nucleus. In addition to the bright spectra near the nucleus, we detect emission at 30–40% of the nuclear value at positions 10′′–20′′ offset from the nucleus. Harris et al. also detect strong CO emission at offset positions. They measure an integrated intensity 60% of the nuclear value as far as offset, consistent with our observations.
Interferometric observations of millimeter wave CS (Peng et al., 1996), CO (Canzian, Mundy, & Scoville, 1988; Carlstrom et al., 1990), and SiO (Garcia-Burillo et al., 2000) transitions show evidence for a nuclear bar with major axis oriented 70∘ east of north. The velocity field of this bar shows a 100 shift from the northeast to the southwest. Though the map does not have the resolution or sampling to spatially resolve the bar, it also shows the velocity shifting from 150-200 in the northeast to 250-300 in the southwest, showing the overall kinematics of gas in the bar, in good agreement with the interferometric observations. The observed line widths are between 200 and 300, consistent with the 150 to 240 line widths observed in the lower-J CO lines with 12 to 15′′ beams (Mauersberger et al. (1996); HHR99), convolved with our 70 Lorentzian instrumental profile.
3.2 Model fit to the nuclear excitation conditions
To make quantitative estimates of the physical parameters of the nuclear molecular gas we have compiled all CO rotational transitions observed toward the central 15′′ available in the literature to compare with predictions of an escape probability, large velocity gradient model for CO line excitation. In contrast with previous studies of the molecular material in starburst galaxies which invoke two components (HHR99) or complex PDR models (Mao et al., 2000), our modeling suggests that the observed and intensities can be reproduced with the bulk of the gas mass at fairly high excitation. The line ratios can be fit with a range in conditions from , to , . Recent measurement of rotational H2 lines (Rigopoulou et al., 2002) suggests that the temperatures may be on the low end of the allowed range, and we thus we favor and . Combining the 13CO transitions constrains the column density to be only slightly larger than that measured by HHR99 in a 23′′ beam. To reproduce the observed intensities with the LVG formalism requires large velocity gradients (), which are much higher than is traditionally used, but nevertheless plausible for the starburst nucleus. Here we describe our modeling approach and the basis for these conclusions.
Including our results, 12CO has been observed toward the nucleus of NCG 253 in all transitions up to except for , with a variety of beam sizes. Also, the optically thin isotopes 13CO and C18O have been observed in transitions up to . Table 1 summarizes the 12CO and 13CO observations and the corrections to refer them to the 15′′ beam. Measurements for all and lower transitions are from HHR99. Coupling corrections, where necessary, are based on power laws. The lines have been observed with both 12′′ and 23′′ beams, and the resulting power law is . For , there are no single dish observations with a beam smaller than 23′′, but based on the centrally peaked / ratio map, the emission is probably more extended than . We adopt a power law of , but estimate a 20% uncertainty in the derived intensity, which is sufficient to accommodate a power law exponent between 0 and 0.76. For , the intensities are measured from the published spectra in 15′′ beams. For there are published measurements with both a 10.6′′ beam (Israel et al., 1995) and a 22′′ beam (Israel & Baas, 2002). Allowing these two measurements to define a power law gives , and we use this to determine the intensity within 15′′. The measurement is from Harris et al. (1991) in units, and is corrected to 15′′ according to their stated 8′′/30′′ composite beam profile. The observation from this work is referred to an 11.5′′ main beam based on observations of Mars, with a small correction for the 15.8′′ planetary disk. The estimated uncertainties are also included in Table 1. The beam filling corrections become the dominant source of uncertainty in the (described above) and lines, we estimate this to be about 15%. For the transition in a 15′′ beam, we estimate 20% for the overall uncertainty including systematics and statistics. For the and higher submillimeter transitions, the uncertainties in the measurements themselves are substantial, as much as 30%.
The LVG model calculates intensities of rotational CO lines given a molecular hydrogen density, a temperature, and a velocity gradient. The calculation is similar to that used in other multi-line analyses, iteratively solving for the level populations up to . We use the escape probability of Goldreich, & Kwan (1974) appropriate for spherical clouds undergoing gravitational collapse. H2 – CO collisional excitation rates are those of Flower (2001), increased by 21% to account for collisions with He (McKee et al., 1982; Viscuso & Chernoff, 1988; Flower & Launay, 1985; Flower, 2001; Schinke et al., 1985).
| Transition | [GHz] | Obs. Beamsize | Corr’n to 15′′ | Int. in 15′′1 | % | |
|---|---|---|---|---|---|---|
| 12CO | 115.3 | 23′′ | 920 | 1.2 | 20 | |
| 12CO | 230.5 | 12′′ | 1060 | 0.84 | 15 | |
| 12CO | 345.8 | 15′′ | 998 | 1 | 20 | |
| 12CO | 461.4 | 22′′, 10.6′′ | 1019, 2150 | 1.48, 0.70 | 30 | |
| 12CO | 691.5 | 8′′ / 30′′ | 861 | 1.59 | 30 | |
| 12CO | 806.7 | 11.5′′ / 60′′ | 1370 | 0.677 | 30 | |
| 13CO | 110.2 | 23′′ | 80 | 1.2 | 20 | |
| 13CO | 220.4 | 12′′ | 134 | 0.84 | 15 | |
| 13CO | 330.6 | 15′′ | 145 | 1 | 20 |
3.2.1 12CO Intensity Ratios
A sensible approach for comparing an LVG model with observations is to use the line intensity ratios to determine the physical parameters (temperature, density, and opacity) while the absolute line intensities determine the total column density. In addition to the 12CO intensity ratios, the optically-thin isotopes can be useful in constraining the 12CO optical depths, which are greater than unity for the lines of interest. In order to concentrate on the nuclear gas, we do not put much emphasis on the transition. Since it connects the ground state and and the level is only 6 K above ground, the transition traces any molecular material in the beam. A related and more confusing problem is the potential for self-absorption by quiescent material along the line of sight but exterior to the nucleus, a particular concern for nearly edge-on systems such as NGC 253. This may be the reason that any model which fits the and higher transitions over predict . In an approach similar to that of HHR99, we invoke a small diffuse component which is negligible energetically, but which emits primarily in to account for its observed intensity.
For a given LVG calculation, the parameters which determine the line intensity ratios are the temperature, density, and column density of CO per unit velocity interval, , called the opacity parameter. is a combination of density, velocity gradient of the gas, and CO abundance, where is the velocity gradient in . We have assumed a CO abundance of , the value measured for galactic clouds (Freking, Langer, & Wilson, 1982). While the metallicity in the nucleus of NGC 253 is as much as 3 solar (Mauersberger et al., 1996), the large observed [CI] intensities suggest that, relative to the Galaxy, the gas-phase carbon budget includes a much larger neutral carbon fraction, and smaller CO fraction (Israel & Baas, 2002), thus the CO abundance is not clearly much higher in spite of the large metallicity. Intensity ratio calculations for a higher CO abundance are identical to those with the canonical value, but with the velocity gradient decreased by the same ratio. Raising the CO abundance or lowering the velocity gradient increases the the optical depth in the lines. Figure 2 plots the results of LVG calculations of diagnostic line ratios as a function of gas temperature, density, and velocity gradient. We have found that the to intensity ratio is a good measure of the overall excitation, and that matching this ratio typically satisfies all the lines above to within the observational uncertainties.
As can be seen from the solid contours in Figure 2, the 12CO to intensity ratio of 7.7 means that the gas is of high excitation. Because the run of line intensity with J is increasing up to , there is no unique solution, nor even upper limits to the temperature or density. Lower limits, however, are strong. For temperatures less than 300 K, the density must be greater than . A temperature less than 150 K requires a density greater than , clearly different from the typical Galactic molecular cloud. To first order, these results are independent of the velocity gradient and CO abundance because the lines are optically thick, even at velocity gradients as large as 80 .
3.2.2 Intensities
If their abundances relative to the main isotope are known, the intensities in the 13CO transitions can be used to determine the 12CO optical depths. This is the approach taken by HHR99 in their study of the nuclear regions of NGC 253 with the lower-J lines. The key to their analysis is the assumption of a 12CO to 13CO abundance ratio of 40–50, originating from analysis by Henkel et al. (1993); Henkel & Mauersberger (1993). Our results are consistent with a ratio on the upper end of this range, and we have chosen 50 as a value to use in the model plots. Included in Figure 2 as dashed lines are the 12CO to 13CO intensity ratios predicted by the LVG models. The observed ratio of 12 is plotted as a thick dashed line. To correctly obtain the line intensity ratios between the two isotopes requires running the full LVG model for the optically thin species, since radiative trapping is important in determining the level populations of 12CO but is much less so for the optically thin species. Because the 13CO transitions are optically thin for all relevant conditions, the values plotted in Figure 2 can be shifted to accommodate a different isotope ratio. In the density-temperature plane, a larger isotope ratio is considered by choosing a line ratio contour with a value decreased from the observed 12 by the same factor.
In the panels of Figure 2, the temperature and density at which the two observed line ratios meet is the regime of possible solutions. It is evident that small velocity gradients are unable to generate the observed line ratios. At these small velocity gradients, the conditions which excite upper-J lines generate large optical depths in the 12CO lines, and their fluxes are too small compared with the optically thin isotope. Increasing the velocity gradient does provide possible solutions, again, with high excitation conditions in both temperature (T100 K) and density (). Though unconventional in LVG analyses, the large velocity gradient is plausible for the starburst nucleus, and is discussed in Section 3.2.4.
3.2.3 CO Column Density
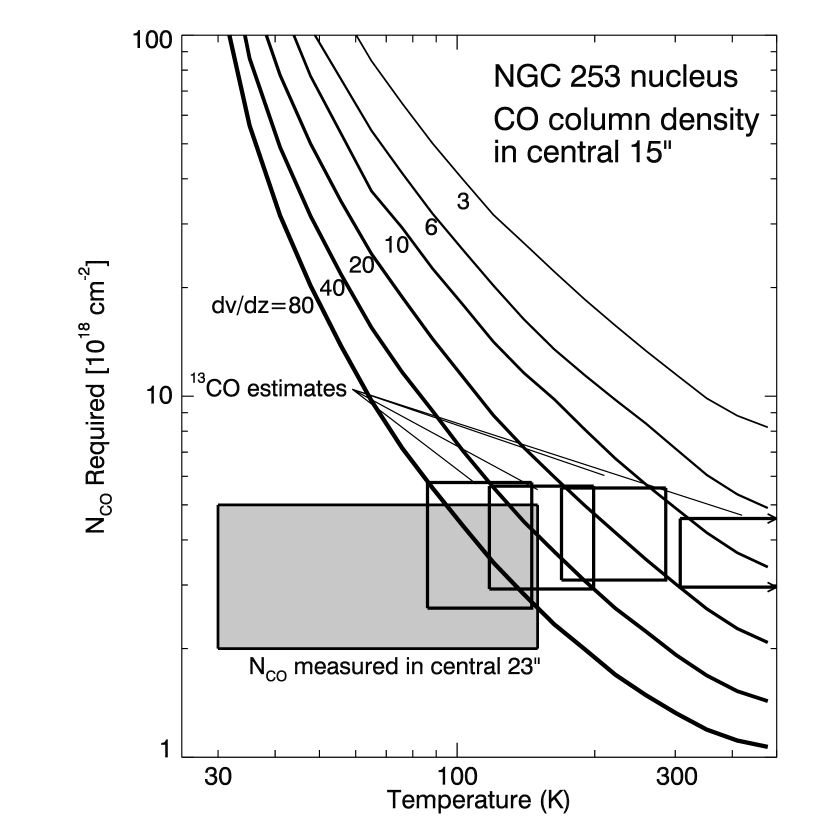
Even though the 12CO lines are optically thick, their observed intensities put lower limits on the CO column density independent of the optically thin isotopes. The intensity in a line is determined by the product of column density in the upper level and the optical depth factor , hence a lower optical depth (larger velocity gradient) generates more emission for a given CO column density. The curves in Figure 3 show the column density required by the LVG model to reproduce the observed intensities. For each velocity gradient, the curve is parametrized in terms of temperature, with the density determined according to the observed 12CO line ratio shown in Figure 2. Examination of Figure 3 indicates that the column density of warm gas must be substantial. For example, if the gas has a temperature below 200 K and velocity gradient below 40 , the column density must be larger than , a lower limit which is comparable to the estimated in the central 23′′ with the and lower transitions (HHR99).
To improve upon the lower limits provided by the 12CO transitions alone, we incorporate the 13CO intensities. The boxes in Figure 3 show the column densities required by the LVG model under the conditions corresponding to the intersections of the two diagnostic line ratio curves in the panels of Figure 2. Boxes are plotted for values of = 10, 20, 40 and 80 , as velocity gradients less than 10 do not allow reasonable solutions. The sizes of the boxes correspond to a 30% uncertainty in temperature, and an corresponding uncertainty in column density given by local slope of the T- relation. The locus of these regions indicates that the CO column density is between 3–7, for all allowed values of the excitation. This is consistent with the 12CO upper limits, and is comparable to the value derived by HHR99 for the central 23′′.
The results of our LVG analysis can be summarized as follows: the molecular gas in the central 180 pc of NGC 253 is much more highly excited than that traced with only the lower-J lines in a larger 280 pc beam. The gas is warmer than 100 K, and has a density greater than . The 12CO lines have optical depths not larger than 2–4, requiring velocity gradients , larger than traditionally employed in LVG studies. Even larger velocity gradients ( ) are required if the temperature is constrained to be below 200 K. The CO column density is well-determined by the 13CO lines: 3–7, only slightly larger than the values estimated in a larger beam. Finally, while the 13CO transition requires an additional component of cool and/or diffuse gas, this component is small by mass, negligible energetically, and may not even be associated with the nuclear region. There is no reason to invoke a large component of cool gas as would be required, for example, in a study of the central regions of the Milky Way.
3.2.4 The Large Velocity Gradient
Previous LVG studies of NGC 253 and M82 have employed a velocity gradient of around 1 , which is approximately the ratio of the total observed velocity width to the size of the observed region (HHR99; Mao et al. (2000)), and comparable to the values used in studies of Galactic molecular clouds. This is a lower limit to the true velocity gradient in the material, appropriate if it were only subject to the central potential of the galaxy with no local motion. In reality, clouds and clumps will be subject to their own gravity as well as that of the stars around them. The escape velocity of a self gravitating cloud of radius r, and density determines a velocity gradient given by , which gives 10 , for a density of . Models on the low end of the allowed temperature range, e.g. T 120 K require a velocity gradient of order 40 , a factor of 4 larger than this escape velocity. This is not implausible; if the star-forming clouds in NGC 253 are similar to the Orion molecular cloud core, then one might expect the stellar mass density to be about 4 times the gas density (O’Dell, 2001), which would double the effective escape velocity. Furthermore, Carral et al. (1994) find the pressure of the ionized gas in the central 45” of NGC 253 is - larger than the thermal pressure within our modeled molecular gas. This high pressure ionized gas has a large volume filling factor (0.01 to 0.3) within their much larger (45′′) beams. It is thus quite plausible that within our 15′′ modeled region the ionized gas place a important role in cloud confinement, further increasing the velocity dispersion in the gas. In short, the large velocity gradients required for a good model fit are very plausible given the dynamics in the nucleus of NGC 253.
3.3 Comparison with rotational H2 lines
Because the transition is not high enough to see the turn-over in CO excitation, the CO analysis does not provide a good upper limit to the gas temperature. Fortunately, we can use the ISO H2 pure rotational line observations to provide an important temperature constraint. Rigopoulou et al. (2002) have recently reported ISO SWS observations of the pure rotational lines of H2 from the central 14′′ 20′′ regions of NGC 253. These quadrupole H2 lines have low radiative rates, so they are easily thermalized and optically thin. In principle the lines can be used to measure temperature and column density. However, even the lowest H2 rotational transition energy is 515 K, thus the observed line emission is heavily biased toward the very warmest regions (which may be negligible by mass), and each observed transition is an exponential function of gas temperature. Not surprisingly, the line intensities are not consistent with a single excitation temperature. Based on the S(0), S(1), S(2), S(5), and S(7) lines, Rigopoulou et al. (2002) conclude that there must be a substantial mass of warm, dense gas in the nucleus of NGC 253, broadly consistent with our results. More specifically, the modeled molecular hydrogen column density of 4–8 is consistent with the S(0) data presented by Rigopoulou et al. (2002) for gas temperatures in the range of 95–120 K. We therefore favor models on the low end of the temperature range allowed by CO analysis. Because of the exponential dependence on temperature, this H2 temperature constraint is a rather weak function of H2 column density, hence also a weak function of CO column density and CO abundance.
We combine this H2 result with the parameter ranges allowed by the LVG analysis, and the physical constraint of a small velocity gradient to arrive at our preferred model, shown in Figure 4. This model uses = 40 , toward the bottom of the range allowed by the low temperature and the observed 13CO intensity. As described above, the lower velocity gradients are more consistent with gravitationally bounds clouds. The modeled conditions are , , and the CO column density required to generate the observed line intensities is . At this temperature, about 40 of the observed H2 S(1) flux is generated in the bulk component, and the contributions to the higher-J H2 lines (which require excitation of levels with ) are less than 10% of the observed line fluxes. As an estimate of the uncertainties, we note that even with the temperature constrained, a larger velocity gradient still allows a smaller column density. Decreasing the velocity gradient, or increasing the CO abundance can permit a larger column density, but this quickly becomes inconsistent with the 13CO observations unless the 13CO relative abundance is decreased below our adopted 1/50. Combining all the uncertainties in the abundance ratio, modeling, and observations, we estimate an uncertainty of 40% for the final adoped column density: . Our model parameters are summarized in Table 2.
3.4 Warm Gas Mass
With the assumed CO abundance relative to H2 of , the CO column density corresponds to a mass of excited molecular gas in the central 15′′ of 2.5–5.1. In reality, the CO abundance is not well-known. The abundance may be larger than the canonical Galactic value, given the 3 solar metallicity (but see discussion above), and this would result in a smaller gas mass by as much as a factor of 3. Based on an assumed carbon gas to dust ratio and the measured fractions of gaseous carbon bearing species, HHR99 infer a CO abundance relative to H2 of , that is, about the factor of 3 larger than our adopted value. With this abundance, the gas mass would be smaller: 0.9–1.8. We do note a larger CO abundance demands even larger velocity gradients (more than 30 ) to allow working solutions. For comparison, the most recent estimate of the gas mass based on 1.3 mm dust continuum is (HHR99, Krügel et al. (1990)). Since the 1.3 mm continuum has a half-power size of only 16′′ 11′′ much of this flux arises within our within our 15′′ beam, and traces the same material. The agreement with our derived gas mass suggests that while our CO abundance may be slightly high, it is not off by more than a factor of 2.
3.5 Suitability of Multiple-Component Models
It is traditionally thought that mid-J CO emission originates in the PDR surfaces of molecular clouds exposed to UV starlight. In this scenario, the warm excited gas is separate from the bulk of the molecular gas, and usually represents a small fraction of the total mass. Observations of several PDR regions in the Galaxy have motivated modeling which includes detailed PDR chemistry and radiative transfer to predict the line emission. Köster et al. (1994) have constructed detailed models of PDRs on the surfaces of small clumps to predict 12CO and 13CO line intensities in star-formation regions. Relative to a simple plane-parallel model, the clumpy geometry allows an increase in local gas density, and allows UV photons to penetrate to a greater fraction of the gas, increasing the overall molecular excitation level. While such models are successful in reproducing the intensity ratios between 12CO lines, they fail to account for both the large integrated intensities and the large 12CO to 13CO intensity ratios observed in a starburst nucleus such as NGC 253. For example, Köster et al. (1994) model slabs with thickness given by , illuminated from both sides, including chemistry of both 12C- and 13C-bearing species. The ratios among the 12CO lines are well-fit with , Habing (), but to generate the observed flux in the central 15′′ of NGC 253 with a superposition of these regions would require between 5 and 20 times the CO column density estimated with our LVG analysis. The 13CO lines show the same effect – the predicted 12CO to 13CO intensity ratio is around 3, compared with the observed value in 15′′ of (HHR99). Thus the existing PDR models are not appropriate for the global properties of a starburst nucleus. The key problem is the high optical depth in the PDR models, resulting from the small assumed velocity width per gas column. The effective velocity gradient of the clumpy PDR model is around 9 , too low as we have discovered in Section 3.2.
To consider a PDR scenario with the appropriate optical depths in the lines for NGC 253, we have examined LVG models with two distinct gas components. Though this approach is not as rigorous as a full treatment of the chemistry and UV penetration used by the Galactic PDR models, to first order it accounts for the combination of warm UV-exposed surfaces and cool cloud interiors which together would generate the observed CO emission. For NGC 253, we have found that while it is possible to fit the observed intensities without the full mass of gas being highly excited, the warm fraction must be substantial. To reproduce the observed and transitions, at least 30% of the total column density estimated with the 13CO ratio must have high excitation conditions. Furthermore, the curves in Figure 3 shows that this scenario requires an extremely large velocity gradient (100 ) and/or very high temperatures (300 K) in this 1/3 warm fraction in order to reproduce the observed intensities. Moreover, as we outline in Section 4.1.1, even with only 1/3 of the total column density accounting for the high-J line emission, the amount of warm molecular gas would still be 7–10 greater than the PDR-associated atomic gas, so the UV heating is not a viable origin of the observed CO emission.
4 Discussion
4.1 Energetics of the Molecular Gas in NGC 253
Independent of the details of the excitation and radiative transfer model, the general shape of the CO intensity vs. J curve measures the luminosity of the molecular gas in the central 15′′ of NCG 253. Taking our favored model plotted in Figure 4 as a guide, the total flux in the CO lines from the modeled region is . This is 25% of the [C II] 158 m and [O I] 63 m intensities from the entire inner (Carral et al., 1994), and a substantial fraction of the total IR luminosity of the galaxy. At a distance of 2.5 Mpc, this molecular gas flux corresponds to a luminosity of , giving a luminosity to mass ratio of for the gas containing CO based on the mass estimates of Section 3.4. The large luminosity in the CO lines is a simple consequence of the fact that such a large fraction of the gas mass is highly excited. In what follows, we examine potential heating sources to generate the large luminosity. Simple arguments show that traditional heating sources for warm molecular gas – far-UV photons and cloud-cloud collisions – are unlikely to contribute substantially. In contrast, the enhanced cosmic ray flux of the starburst nucleus can easily match the observed cooling in the CO lines, and is likely responsible for the high excitation conditions inferred for the bulk of the molecular ISM.
For completeness we note that the CO lines are a good measure of the total cooling of the molecular gas. The five H2 lines observed by Rigopoulou et al. (2002) suggest that all the rotational lines combine to produce a flux of at most , less than the CO lines. Another potential coolant is C0, which can have an abundance comparable to that of CO. However, it only has two transitions each of which could be comparable to a single CO line if optically thick and thermalized; thus C0 cannot be a dominant coolant. Also, we note that though the modeling described above carries uncertainties as great as 40% in the derived parameters, the discussion below typically concerns factors of 3–30, and the general arguments hold independent of the modeling details.
| Parameter | Value |
|---|---|
| Adopted | |
| CO abundance (XCO) | |
| 12CO / 13CO abundance ratio | 50 |
| Modeled | |
| N | 3.5–7 |
| Gas density () | 3–6 |
| Temperature () | 100–140 K |
| Velocity gradient | |
| Dense gas mass | 2.5–5 |
| Derived with best model | |
| Dense gas filling factor () | |
| Cloud radius | 2.0 pc |
| Number of clouds | 330 |
4.1.1 Stellar UV Heating
In Galactic starformation regions, warm CO is typically produced by UV impinging on the surfaces of molecular clouds. As it penetrates a cloud, the UV is attenuated, producing in turn ionized, atomic, and warm molecular layers before it is extinguished (Tielens & Hollenbach, 1985). The thermal pressure implied by our model fit to the CO lines is , similar to the pressure derived with atomic PDR line ratios of (Carral et al., 1994). This is consistent with a model in which the PDR gas forms the surface of the warm molecular clouds. The penetration of UV into a cloud is determined by the dust opacity, proportional to the gas column density according to
| (1) |
Here we have assumed solar dust abundance. (This is not unreasonable—though the metallicity in the nucleus of NGC 253 may be 3 solar (Mauersberger et al., 1996), there is evidence for substantial destruction of dust grains in an unusually large gas-phase Si abundance (Carral et al., 1994)). In standard Galactic PDRs, the first 3 magnitudes from the surface of the cloud are photodissociated and cool through the atomic lines, while the warm molecular gas exists from 3–6. To first order, the masses of these two components are comparable. Yet in the nucleus of NGC 253, Carral et al. (1994) measure M⊙ of photodissociated gas traced by the 158 [CII] line in a large (45′′) beam. Scaling by the observed molecular and far-IR continuum morphology (Canzian, Mundy, & Scoville, 1988), (Telesco, Dressel, & Wolstencroft, 1993), we estimate only 56% of the photodissociated gas traced with the large beam falls within our 15′′ beam. Therefore, the photodissociated gas mass is about a factor of 20–30 smaller than the 2–5 M⊙ of warm molecular gas. There is no reasonable geometry in which two layers of comparable thickness can have volumes different an order of magnitude. It is possible that the distribution of heating between the molecular and atomic components could be made to favor the molecular gas with soft or weak UV fields relative to standard PDR templates. However, the conditions derived with the atomic lines are consistent with standard photodissociation region (PDR) models – the UV field can be understood as arising from O 7.5 stars with an effective temperature of 34,500 K (Carral et al., 1994; Engelbracht et al., 1998), so scenarios invoking soft or weak UV fields are unlikely.
As pointed out in Section 3.5, as little as 30% of the total CO could provide the line luminosities in a warm component, emitting more efficiently lower opacity in the lines. The remaining 70% of the molecular gas would then be in a cool, more diffuse component, possibly the UV-shielded cloud cores. This scenario is attractive because UV-shielded regions are required to host the HCN observed toward the nucleus (Paglione et al., 1995), which has a low dissociation energy ( 5 eV). However, a factor of 3 reduction in warm CO-containing gas mass would still leave a factor of 7–10 more warm molecular gas than atomic gas. Thus standard PDR models which invoke stellar far-UV photons to heat the surface of molecular clouds are not a good match for the heating of the bulk of the molecular gas in the nucleus of NGC 253.
4.1.2 Dynamical Heating
Another potential explanation for the large molecular luminosity is dynamical energy sources. By heating molecular gas over large velocity widths, shocks can dramatically increase the efficiency of CO radiation. One source of shocks are outflows from young stars or star associations, examples in our Galaxy include the W 51, W 49 and DR 21 regions (Jaffe, Harris, & Genzel, 1987; Jaffe et al., 1989), in which bright CO emission is observed with 20–50 linewidths. In these sources, the CO luminosity in the broad-line shock-heated outflow components dominates that of the narrow-line PDR component. Another clue is the bright SiO observed in the central 150 pc of NGC 253 (Garcia-Burillo et al., 2000); the large implied abundance of SiO is attributed to outflows from massive young stars in a manner similar to the Galactic regions W 51 and DR 21. However, the comparison cannot apply globally in the nucleus of NGC 253. First, the excitation conditions in these Galactic shock regions are much higher that what we observe for the average properties of the nucleus of NGC 253. Observations of CO , and toward W 51 IRS 2, for example, indicate that the gas temperature are 500–1000 K, unlikely for the bulk of the gas in NGC 253 given the rotational H2 observations suggesting lower temperatures. More importantly, in NGC 253, the near-IR H2 emission is characteristic of UV fluorescence, rather than the thermal spectrum produced by shock heating (Engelbracht et al., 1998) found in the Galactic outflow sources.
Shocks can also be generated with large-scale gas motions: supernova blast waves or spiral density waves. The nuclear starburst in NGC 253 is approximately bounded by an inner molecular ring with diameter 120 pc which corresponds to the inner Inner Linblad Resonance (iILR) of the galaxy’s bar. The large non-circular motions observed (as much as 40–50 ) are attributed to gas accumulation and orbit crowding (see Buta & Combes (1996)), in the deep potential of the stellar mass, and it is plausible imagine that shocks from cloud collisions would be common. However, the difficulty again is that if the majority of the CO luminosity is to come from cloud collision shocks, they must be slow ( km s-1), non-dissociative shocks in order to reproduce the observed CO line ratios, and not excite the ro-vibrational H2 lines with a thermal spectrum. At these velocities, the collision timescale and energy available for collisions between clumps becomes small. Considering the molecular gas to come from assumed r, clumps, the mean separation of clumps is around 25 pc. With a relative velocity of 10 collisions will occur on timescales of
| (2) |
with an available energy . Such collisions, then, could in principle result in a luminosity to mass ratio of
| (3) |
which is much smaller than the mass to luminosity relation implied by the model fit to the CO intensities (). Lower densities and smaller clumps sizes mean more numerous clumps and a smaller mean separation. This can increase the luminosity by a factor of only 10–20, but it is still several orders of magnitude too small. Thus it is unlikely that a substantial fraction of the CO luminosity in the central 100 pc may be due to shocks from cloud-cloud collisions. Again, while higher-velocity shocks could provide much more energy, and the 40 non-circular velocities are suggestive that such shocks could exist, the H2 ro-vibrational lines are inconsistent with any significant heating in fast shocks. Thus while some amount of shock heating is required to produce the high SiO abundance, it is not likely to be a dominant factor in heating the bulk of the molecular gas.
4.1.3 Cosmic Ray Heating
It is widely believed that low energy cosmic-ray protons dominate the heating of the quiescent, UV-shielded molecular cloud cores in the disk of the Galaxy, keeping the gas temperature above that of the CMB (Goldsmith, & Langer, 1978, and references therein). A much larger cosmic ray density generated by massive star formation has also been invoked to explain the 50–150 K measured molecular gas temperatures in the central regions of M82 (SAH). Since the H2 cosmic ray dissociation cross sections are so small (), cosmic rays easily penetrate molecular cloud cores. The heating rate for cosmic rays can be characterized by a ionization rate per H2 molecule, and an average deposited as thermal energy per ionization, that is:
| (4) |
Goldsmith, & Langer (1978) adopt values for between 17 eV and 20 eV. For the ionization rate we solve Eq. 3 of SAH which scales the cosmic ray density from that of the Galactic disk according to the supernova rate per unit area and a typical wind velocity by which cosmic rays are removed from the disk of a galaxy:
| (5) |
The Galactic ionization rate is between (Goldsmith, & Langer, 1978) and (van Dishoeck, & Black, 1986), (see also Doty et al. (2002)). For the supernova rate in NGC 253 , we take the lower limit derived for the central 36090 pc of 0.1 yr-1 (Antonucci & Ulvestad, 1988), giving . To compare with the Galaxy, we take a rate of 5.8 per century over the entire disk (van den Bergh & Tammann, 1991, and references therein), or . The diffusion velocity in the Galactic disk is 10 (SAH), and the superwind velocity in NGC 253 is 500 , (Strickland et al., 2002). The ionization rate can then be scaled from that of the Galaxy:
| (6) |
With a of 20 eV per ionization, the power deposited per H2 molecule is then 5–18 . This estimate represents a lower limit to the cosmic ray heating, yet it is very close to the measured luminosity per H2 molecule in all of the CO lines, with our assumed CO abundance.
To check that the increased CR flux does not destroy H2 and other molecular constituents, we compare our derived ionization rate with Eq. 10 of SAH. This requires that the ionization rate be less than the H2 formation rate:
| (7) |
where is the total hydrogen density. For our parameters, this requires , a factor of 50 from our lower limit of .
It is conceivable the increased CR density would dissociate the CO in the cloud core. Farquhar, Millar, & Herbst (1994) have constructed a chemical model of dark clouds to investigate the effects of cosmic rays ionization on the ion-neutral chemistry. For steady state models, with cloud density and visual extinction they find CO remains the dominant reservoir for carbon for the entire range of cosmic ray ionization rates investigated, . The neutral carbon abundance grows sharply as grows to approaching 25% of the CO abundance at the largest cosmic ray fluxes investigated. These results are consistent with the large abundance ratios observed in the nuclei of both NGC 253 (Harrison et al., 1995), and M82 (Schilke et al., 1993). Since cosmic ray heating provides the necessary molecular gas luminosity and naturally accounts for the large observed neutral carbon abundance, while other heating sources are insufficient by large factors, we favor favor the cosmic rays as the dominant heating source for the bulk of the molecular gas in the nucleus of NGC 253. Our analysis is fairly general, and we note that similar arguments could be made for other starburst nuclei where the rate of supernovae explosions approaches 0.1 per year in a 100 pc region.
4.2 Cloud Size, Relation to Atomic Gas
The total gas mass in a region compared with the derived density determines a volume filling factor of clouds. For our modeled dense component, the result is . The physical size of the clouds, however, is not constrained by our observations. The existence of HCN in dense cores (Paglione et al., 1995) indicates that many clouds must be large enough to shield their interiors from UV, approximately for the cloud radius. This puts a lower limit on the cloud size according to Eq (1). If we assume that the photodissociated gas, as traced through its [CII] and [OI] line emission forms a surface layer on the molecular cloud interiors, then we can estimate the cloud sizes. As discussed in Section 4.1.1, such a layer would have a thickness such that , and the atomic to molecular gas mass ratio requires that the atomic surface constitute of the total cloud mass. For spherical clouds, this implies a cloud radius corresponding to . Converting to physical sizes, these arguments then give , at our modeled density and solar dust abundance. In a plane-parallel geometry, appropriate for clouds illuminated from a single direction, the geometric argument would suggest a cloud thickness corresponding to , or 0.7 pc. Adopting the 2 pc spherical clouds for argument, each has a mass of M⊙, and there about 330 such clouds in the central 180 pc region. For reference, we note that increasing the CO abundance does not change the arguments above regarding the individual cloud geometry, but would correspond to a smaller molecular gas mass, lower volume filling factor, and fewer number of clouds. Table 2 summarizes the parameters for our adopted model.
5 Conclusions
We have detected bright CO emission from the nucleus of NGC 253. We combine our observations with lower-J measurements of both and and an LVG model to estimate the CO column density and physical conditions of the molecular gas in the starburst nucleus. The column density of CO we infer based on the transitions above is slightly larger than but similar to the estimates made by HHR99 for the central 23′′. However, we find that the excitation conditions of this gas must be very high to reproduce the observed and intensities. A single component with , and provides the best fit to all the observed transitions above for both 12CO and 13CO, and is consistent with the ISO molecular H2 observations. We adopt this as the favored model. While a smaller additional mass of cool gas is required to account for the 13CO intensity, and more cool gas may be present, the CO column density of warm molecular gas cannot be much less than our derived values.
The large mass of warm gas is very difficult to explain with a photodissociation region scenario. The molecular gas mass is a factor of 10–30 greater than the atomic gas mass, while the two should be comparable if heated with stellar UV as in the Galactic PDR templates. Dynamical heating of molecular gas from shocks is also unlikely based on energetic considerations, and given the lack of evidence for significant heating in fast shocks. On the other hand, the very large cosmic ray flux in the starburst nucleus of NGC 253 readily provides the necessary energy to heat the gas, and a means to deliver energy throughout the volume of large, UV-shielded clouds. It is likely the dominant heating term in the molecular ISM energy budget. While some of the warm molecular gas that we observe is likely heated by the far-UV radiation and shocks, our results strongly support the conjecture by (Suchkov, Allen, & Heckman, 1993) that the bulk of molecular gas in starburst nuclei is held at high excitation by the enhanced cosmic ray flux.
6 Acknowledgments
We are very grateful to the staff of JCMT for their support and patience during the first SPIFI observing run. We especially thank the director of the JCMT, Ian Robson for his support, and Wayne Holland for his tireless efforts in SPIFI’s setup and first observations. We are also indebted to Cornell engineer Chuck Henderson for solutions to difficult problems at the telescope on the instrument’s first observing run. We thank an anonymous referee for several helpful suggestions with this manuscript. This work was supported by NASA grants NAGW-4503 and NAGW-3925, and NSF grants OPP-8920223, and OPP-0085812.
References
- Antonucci & Ulvestad (1988) Antonucci, R.R.J., & Ulvestad, J.S. 1988, ApJ, 330, L97
- Bradford et al. (2002) Bradford, C.H., Stacey, G.J., Swain, M.R., Nikola, T., Bolatto, A.D., Jackson, J.M., Savage,M.L., Davidson, J.A., & Ade, P.A.R. 2002, Appl. Opt.41, 2561
- Buta & Combes (1996) Buta, R., & Combes, F. 1996 Fund. Cosmic. Physics 17, 95
- Canzian, Mundy, & Scoville (1988) Canzian, B., Mundy, L.G., & Scoville, N.Z. 1988, ApJ, 333, 157
- Carlstrom et al. (1990) Carlstrom, J.E., Jackson, J., Ho, P.T.P., & Turner, J.L. 1990, in The Interstellar Medium in External Galaxies: Summaries of Contributed Papers, Ed. D.J. Hollenbach, & H.A. Thronson (NASA Conf. Publ. 3084), 337
- Carral et al. (1994) Carral, P., Hollenbach, D.J., Lord, S.D., Colgan, S.W.J., Haas, M.R., Rubin, R.H., & Erickson, E.F. 1994, ApJ, 423, 223
- Das et al. (2001) Das, M., Anantharamaiah, K.R., Yun, M.S. 2001, ApJ, 549, 896
- Doty et al. (2002) Doty, S.D., van Dishoeck, E.F., van der Tak, F.F.S., Boonman, A.M.S., 2002, A&A, 389, 446
- Engelbracht et al. (1998) Engelbracht, C.W., Rieke, M.J., Rieke, G.H., Kelly, D.M., & Achtermann, J.M., 1998, ApJ, 505, 639
- Farquhar, Millar, & Herbst (1994) Farquhar, P.R.A., Millar, T.J., & Herbst, Eric, 1994, MNRAS, 269, 641
- Flower & Launay (1985) Flower, D.R., & Launay, J.M. 1985, MNRAS, 214, 271
- Flower (2001) Flower, D.R. 2001, J. Phys. B: At. Mol. Opt. Phys. 34, 2731
- Freking, Langer, & Wilson (1982) Freking, M.A. Langer, W.D., & Wilson, R.W. 1982, ApJ, 262, 590
- Garcia-Burillo et al. (2000) Garcia-Burillo, S., Martin-Pintado, J., Fuente, A., & Neri, R. 2000, A&A, 355, 499
- Goldreich, & Kwan (1974) Goldreich, P., & Kwan, J. 1974, ApJ, 189, 441
- Goldsmith, & Langer (1978) Goldsmith, P.F., & Langer, W.D. 1978, ApJ, 222, 881
- Harris et al. (1985) Harris, A.I., Jaffe, D.T., Silber, M. & Genzel, R. 1985, ApJ, 294, L93
- Harris et al. (1991) Harris, A.I., Hills, R.E., Stutzki, J., Graf, U.U., Russell, A.P.G., & Genzel, R. 1991, ApJ, 382, L75
- Harrison et al. (1995) Harrison, A., Puxley, P., Russel, A., & Brand, P. 1995, MNRAS, 277, 413
- Harrison, Henkel, & Russell (1999) Harrison, A., Henkel, C., & Russell, A. 1999, MNRAS, 303, 157 (HHR99)
- Henkel et al. (1993) Henkel, C., Mauersberger, R., Wiklind, T., Huttemeister, S., Lemme, & C. Millar, T.J. 1993, A&A, 268, L17
- Henkel & Mauersberger (1993) Henkel, C., Mauersberger, R. 1993, A&A, 274, 730
- Houghton et al. (1997) Houghton, S., Whiteoak, J.B., Koribalski, B., Booth, R., Wiklind, T., & Wielebinski, R. 1997, A&A, 325, 923
- Israel et al. (1995) Israel, F.P., White, G.J., & Baas, F. 1995, A&A, 302, 343
- Israel & Baas (2002) Israel, F.P., & Baas, F. 2002, A&A, 383, 82
- Jaffe, Harris, & Genzel (1987) Jaffe, D.T., Harris, A.I., & Genzel, 1987, ApJ, 316, 231
- Jaffe et al. (1989) Jaffe, D.T., Genzel, R., Harris, A.I., Lugten, J.B., Stacey, G.J., & Stutzki, J. 1989, ApJ, 344, 265
- Kaufman et al. (1999) Kaufman, M.J., Wolfire, M.G., Hollenbach, D.J., & Luhman, M.L. 1999, ApJ, 527, 795.
- Köster et al. (1994) Köster, B., Störzer, H., Stutzki, J., & Sternberg, A. 1994, A&A, 284, 545
- Krügel et al. (1990) Krügel, E., Chini, R., Klien, U., et al. 1990, A&A, 240, 232
- Mao et al. (2000) Mao, R.Q., Henkel, C., Achulz, A., Zielinsky, M., Mauersberger, R., Störzer, H., Wilson, T.L., & Gensheimer, P. 2000, A&A, 358, 443
- Mauersberger et al. (1996) Mauersberger, R., Henkel, C., Wielebinski, R., Wiklind, T., & Reuter, H.P. 1996, A&A, 305, 421
- O’Dell (2001) O’Dell, C.R. 2001. ARA&A39, 99
- McKee et al. (1982) McKee, C.F., Storey, J.V.W., Watson, D.M., & Green, S. 1982, ApJ, 259, 647
- Paglione et al. (1997) Paglione, T.A.D., Jackson, J.M., & Ishizuki, S. 1997, ApJ, 484, 656
- Paglione et al. (1995) Paglione, T.A., Tosaki, T., & Jackson, J.M. 1995, ApJ, 454, L117.
- Pence (1981) Pence, W.D. 1981, ApJ, 247, 473
- Peng et al. (1996) Peng, R., Zhou, S., Whiteoak, J.B., Lo, K.Y., & Sutton, E.C. 1996, ApJ, 470, 821
- Rice et al. (1988) Rice, W., Lonsdale, C.J., Soifer, B.T., Neugebauer, G., Koplan, E.L., Lloyd, L.A., de Jong, T., Habing, H.J. 1988, ApJS, 68, 91
- Rudy et al. (1987) Rudy, D.J., Muhleman, D.O., Berge, G.L., Jakosky, B.M., & Christensen, P.R. 1987, Icarus, 71, 159
- Rigopoulou et al. (2002) Rigopoulou, D., Kunze, D., Lutz, D., Genzel, R., & Moorwood, A.F.M. 2002, A&A, 389, 374
- Schilke et al. (1993) Schilke, P., Carlstrom, J.E., Keene, J, Phillips, T.G. 1993, ApJ, 417, L67
- Schinke et al. (1985) Schinke, R., Engel, V., Buck, U, Meyer, H., & Diercksen, G.H.F. 1985, ApJ, 299, 939
- Schmid-Burke et al. (1989) Schmid-Burke, J., Densing, R., Krugel, E., Nett, H., Roser, H.P., Schafer, F., Schwaab, G., van der Wal, P., & Wattenback, R. 1989, A&A, 215, 150
- Scoville et al. (1985) Scoville, N.Z., Soifer, B.T., Neugebauer, G., Young, J.S., Matthews, K., & Yerka, J. 1985, ApJ, 289, 129
- Stacey et al. (1993) Stacey, G.J., Jaffe, D.T., Geis, N. Genzel, R., Harris, A.I., Poglitsch, A. Stutzki, J. & Townes, C.H. 1993, ApJ, 404, 219
- Strickland et al. (2002) Strickland, D.K., Heckman, T.M., Weaver, K.A., Hoopes, C.G., & Dahlem, M. 2002, ApJ, 568, 689
- Suchkov, Allen, & Heckman (1993) Suchkov, A., Allen, R.J., & Heckman, T.M. 1993, ApJ, 413, 542 (SAH)
- Telesco & Harper (1980) Telesco, C.M. & Harper, D.A. 1980, ApJ, 235, 392
- Telesco, Dressel, & Wolstencroft (1993) Telesco, C.M., Dressel, L.L., & Wolstencroft, R.D. 1993, ApJ, 414, 120
- Tielens & Hollenbach (1985) Tielens, A.G.G.M., & Hollenbach, D., 1985, ApJ, 291, 722
- van den Bergh & Tammann (1991) van den Bergh, S., & Tammann G.A. 1991, ARA&A, 29, 363
- van Dishoeck, & Black (1986) van Dishoeck, E.F., & Black, J.H. 1986, ApJS, 62, 418
- Viscuso & Chernoff (1988) Viscuso, P.J., & Chernoff, D.F. 1988, ApJ, 327, 364
- Ward et al. (2002) Ward, J.S., Zmuidzinas, J., Harris, A., Issac, K. 2002,ApJ in press
- Wild et al. (1992) Wild, W., Harris, A.I., Eckart, A., Genzel, R., Graf, U.U., Jackson, J.M., Russell, A.P.G. & Stutzki, J. 1992, A&A, 265, 447
- Wolfire, Tielens, & Hollenbach (1990) Wolfire, M.G., Tielens, A.G.G.M., & Hollenbach, D. 1990, ApJ, 358, 116
- Wright (1976) Wright, E.L. 1976, ApJ, 210, 250