Lobe Advance Velocities in the Extragalactic
Compact Symmetric Object 4C 31.04
We report on the results of a two epoch study of the low power Compact Symmetric Object 4C 31.04. Observations performed with the VLBA at 5 GHz in 1995 and 2000 have yielded images of this source at milliarcsecond angular resolution. A central core is detected, with bright compact hot spots and extended lobes on both sides. Model-fitting and other analysis of the data (brightness profile, difference map) clearly indicate that the source is expanding. We estimate the velocity of this expansion to be (0.085 0.016) mas/yr, i.e. (0.33 0.06) in both hot spots. Assuming a constant expansion velocity, we estimate the kinematic age of the source at 550 yrs. We also study the spectral index using VLBA observations at 1.3 GHz and MERLIN at 22 GHz. The derived spectral age is 3000-5000 years in equipartition conditions. The two estimates are discussed and found to be in agreement, given present uncertainties.
Key Words.:
galaxies: active – galaxies: individual (4C 31.04) – galaxies: nuclei1 Introduction
In recent years, considerable efforts have been devoted to the study of Compact Symmetric Objects (CSOs). The name for this class of objects is derived from their morphology – they have sub-galactic dimensions but the same symmetric, two-sided aspect as classical large scale FR I and FR II radio galaxies. The CSOs also show other interesting properties in the radio: (1) their spectrum can peak at frequencies as high as a few GHz (hence their frequent classification as Gigahertz Peaked Spectrum – see O’Dea (ode98 (1998)), Polatidis & Conway (pc (2002)) and Polatidis et al. (pol02 (2002)) for recent reviews), (2) the rate of Hi absorption is higher than in common radio galaxies (e.g. Van Gorkom et al. jvg89 (1989); Pihlström pih01 (2001)), and (3) variability and polarization are almost non-existent (Fassnacht & Taylor fas01 (2001)). At other wavelengths a comprehensive study of the properties of CSO host galaxies is still missing, although HST observations have suggested that in at least some cases the host galaxies are not completely relaxed (Perlman et al. per01 (2001)).
Our current understanding of CSOs suggests that they are small by virtue of their youth (youth scenario) and not confined by an extremely dense medium (frustration scenario). If they are young then CSOs represent the very first stage of an evolutionary sequence (Fanti et al. fan95 (1995); Readhead et al. 1996a , 1996b ; Polatidis & Conway pc (2002)) in which a radio-quiet galaxy turns into the host of a large, kpc-scale radio loud object. It is therefore of great interest to (1) investigate evidence supporting and quantifying the age of CSOs and (2) relate their current properties to the mechanisms triggering the nuclear activity. Indeed, not only the triggering but also the fueling of this activity can be studied in these objects. Since their orientation provides continuum emission on both sides of the center of activity one can search for either Hi or free-free absorption (Peck et al. pec00b (2000)).
The radio galaxy 4C 31.04 (B2 0116+31) was observed with VLBI by Wrobel & Simon (wro86 (1986)) at 92 cm using 7 antennas. Their image showed two components separated by about 70 mas. Cotton et al. (cot95 (1995)) tentatively classified this source as a low redshift () CSO. Giovannini et al. (2001, hereafter G (01)) confirmed the CSO structure and identified the core with a weak flat spectrum central component.
On the basis of spectral line VLBI observations, Conway (1996 – hereafter C (96), con99 (1999)) has presented evidence for a circumnuclear Hi disk, viewed close to edge-on, whose axis is that of the radio jet. The presence of a circumnuclear disk is also supported by HST observations (Perlman et al. per01 (2001)), which reveal a disk-like dusty feature of somewhat larger scale but similar orientation to the one suggested by Conway. The optical nucleus is also found to have cone-like features well aligned with the radio axis.
After a five year gap following the first observation at 5 GHz presented in G (01), we re-observed this source with the VLBA in order to look for a possible expansion. After describing the observations and data reduction in Sect. 2, we present our detailed comparison of the two epochs and information on spectral index in Sect. 3. Some implications of the results are discussed in Sect. 4. Conclusions are summarized in Sect. 5.
We assume H km s-1 Mpc-1 and q throughout. At the distance of 4C 31.04 () 1 mas corresponds to 1.2 pc and 1 mas/yr = 3.9 .
2 Observations
2.1 5 GHz Observations
The first epoch observations at 5 GHz were obtained on July 22, 1995 (1995.554), with the Very Long Baseline Array111The National Radio Astronomy Observatory is operated by Associated Universities, Inc., under cooperative agreement with the National Science Foundation. plus a single VLA antenna (Y1) for 5 hours. Details about these observations are discussed in Appendix A of G (01).
In the second epoch we obtained 10 hrs of observing time with the full VLBA + Y1 in full polarization mode on July 3, 2000 (2000.504). The observing frequency was centered at 4.971 GHz with 4 IFs and both polarizations recorded. Correlation was performed in Socorro. All calibration and fringe fitting were done within NRAO Astronomical Image Processing System (AIPS): J0136+4751 was used as an amplitude and leakage term calibrator, while J1751+0939, 3C395 and J04231020 were used as calibrators for the polarization angle.
For the purposes of this work it was important to have both datasets reduced in the same way. Thus we reanalyzed first epoch data, in order to have the same calibration procedure for both observations. We then exported the two datasets to DIFMAP222DIFMAP was written by Martin Shepherd at Caltech and is part of the VLBI Caltech Software package, which we used to perform the editing, self calibration and model-fitting. To properly register the two images, we used the 1995.554 image as a starting model for the self calibration of the 2000.504 data. We chose a restoring beam of 3 mas FWHM for both epochs.
2.2 1.3 GHz and 22 GHz Observations
It is of great interest to compare the dynamic age – derived from the study of hot spot velocities, to the radiative age – which can be estimated from synchrotron losses. In order to make this comparison, observations at multiple wavelengths are needed.
Data at 1340 MHz were obtained with the VLBA + Y1 on July 7, 1995 in a project aimed to study the nature of Hi absorption in CSOs. Spectral line results and a continuum map with angular resolution of 3 mas (FWHM) were reported in C (96). Details on data calibration and reduction will be presented in a forthcoming paper (Conway et al., in prep.). Here we point out only that the same strategy used for the 5 GHz data was adopted.
We also investigated the high energy end of the spectrum by considering a MERLIN observation at 22 GHz. Observations were made on 29th January 1998 in continuum mode with a bandwidth of 14 MHz, using all 5 of the MERLIN telescopes available at this frequency. The observations lasted 12 hrs. Observations were made using phase-referencing, but only low dynamic range images were obtained using phase-referencing so final images were made using self-calibration. Good fits to the phase and amplitude data were obtained. Final restoring beam was 10 mas (FWHM).
We used the 1.3 GHz data and the second epoch 5 GHz observation to map the spectral index. For a proper comparison we tried to achieve a similar coverage at the two observing frequencies by cutting the shortest baselines in the 20 cm data and the longest ones in the 6 cm data. Final images were then produced with the same angular resolution and cell–size. The source position in the two images was registered using the isolated, unresolved core.
The resulting coverages at 5 and 22 GHz are quite different, so it was not practical to produce a spectral index image between these frequencies. However, comparable short baselines are present, so that we do not expect missing flux in either image. This allowed us to derive an integrated spectrum for different regions of the source.
3 Results
3.1 Morphology
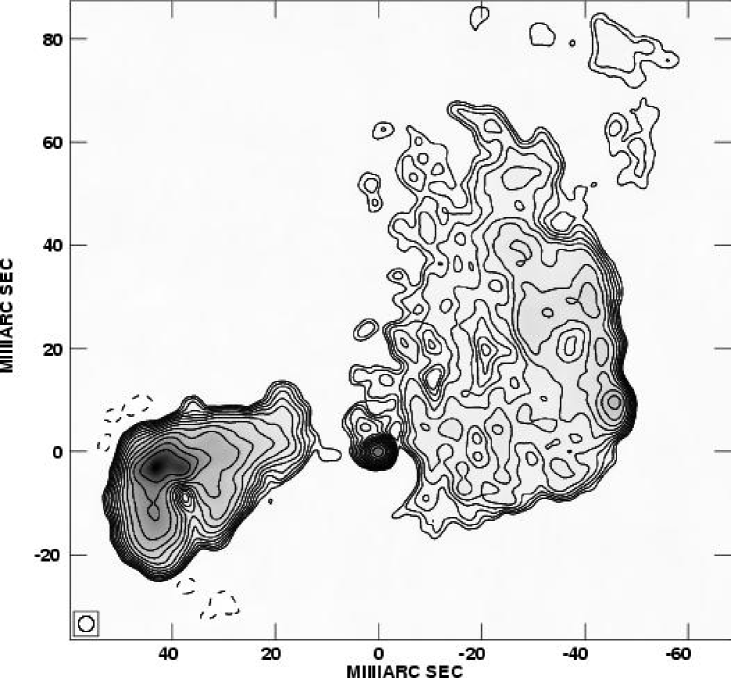
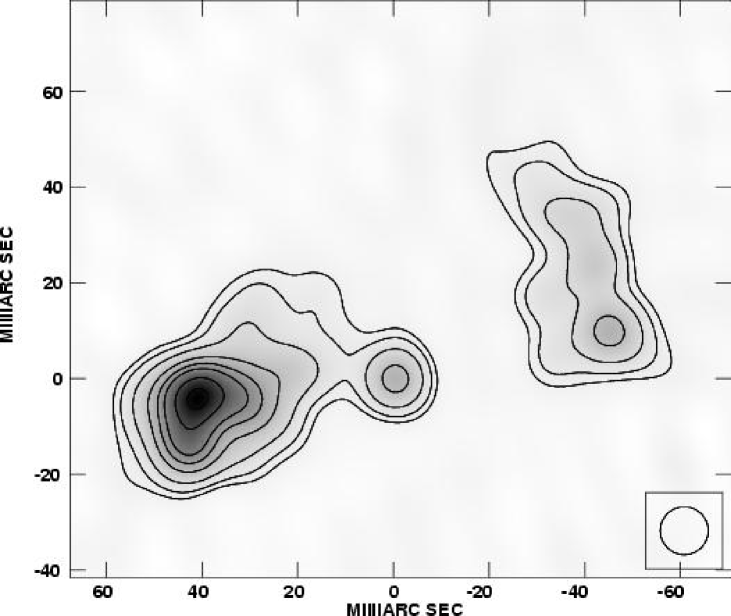
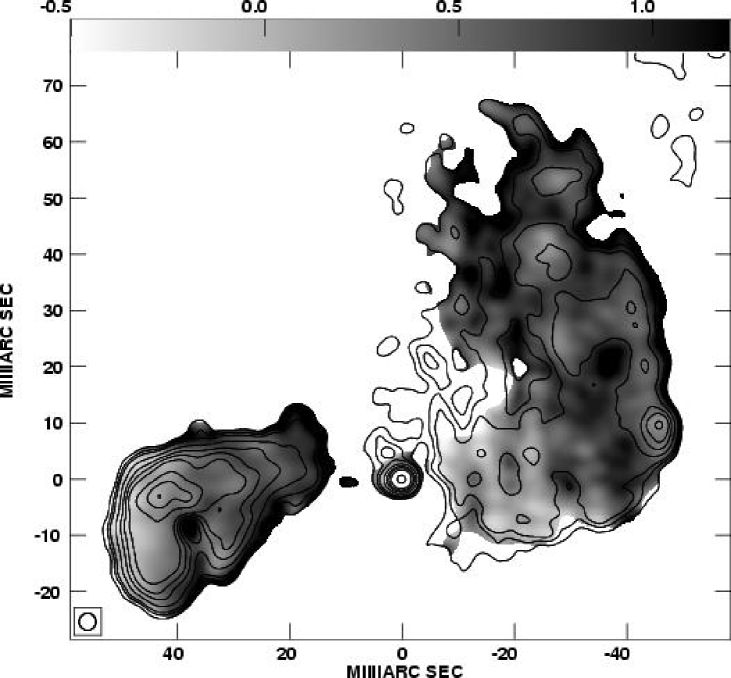
In Figure 1 we show the final image of 4C 31.04 at 5 GHz for the July 2000 epoch, convolved with a circular restoring beam of 3 mas (FWHM). The overall structure of the source is the same as was observed in 1995 (both at 5 and 1.3 GHz), consisting of a compact core component with hot spots and lobes on either side. The lower resolution (10 mas FWHM) 22 GHz MERLIN image shown in Fig. 2 shows the same features, except that the lobes look much fainter and are barely detected.
At all frequencies the total source extent is 100 mas, which corresponds to 120 pc. Total flux density in the 5 GHz maps is Jy, i.e. about 90% of values measured with single dish telescopes (Becker et al. bec91 (1991); Gregory & Condon gre91 (1991)). This yields a total power of W/Hz at 5 GHz, which makes 4C 31.04 one of the weakest known CSOs (Polatidis et al. pol02 (2002)).
Within Difmap, we model-fit the visibility data of the two 5 GHz observations with a set of 10 elliptical Gaussian components. We used large, extended components in order to pick up the lobes’ flux density as well as compact components to describe the core and hot spots. We fixed the parameters of the largest components (size 10 mas) and let the most compact ones vary; results of the fits are listed in Table 1. Uncertainties for each component are computed from the ratio between its FWHM and SNR and are all within 0.1 mas. The most compact components, except for the core, are all located in the hot spots regions. The western hot spot is labeled W1, while the best fit to the eastern end is obtained using three different components – E1, E2 (also the image peak of 40.2 mJy/beam) and E3. Given their high brightness, position close to the edge of the lobe and compactness, we will consider W1 and E2 as the two primary hot spots of this source. It is less likely that either E1 or E3 – both quite fainter than E2 – may be a primary hot spot; it is however possible that they are secondary hot spots similar to those found in many extended FR II sources. The innermost E3 could also be related to the presence of a knot component in an underlying jet.
Indeed, even if a classical jet of plasma is not detected, hints of a jet-like feature are clearly present in the enhanced brightness visible all along the line connecting the core, and in the east hot spot which has an elongated structure on the west side in the full resolution image published in G (01). Giovaninni et al. suggest that the source is oriented close to the plane of sky (), with the west lobe the one nearest to us, in agreement with C (96).
With the increased image fidelity obtained in this second epoch we can also confirm the presence of a ‘hole’ in the east lobe. This large region of lesser brightness lies close to the east hot spot, in a direction perpendicular to the jet. While visible in the first observation, it looks even dimmer and more defined in this second epoch. In contrast, the west lobe does not present very clear features. Being very extended and of low brightness, it cannot be mapped with high fidelity by VLBI technique; however, we are confident that this does not affect the compact hot spot region, which is well detected on most baselines. Fig. 2 and the 1.3 GHz data (C (96)) also confirm that it is indeed a compact, flat-spectrum component.
At their outermost extents, both lobes have a very sharp edge, running along a very wide front ( mas in the eastern lobe but even mas in the western one). The sharpness of this border is again in agreement with this region being the place where the plasma is advancing into the external medium as the source grows.
3.2 Component Motions and Kinematic Age
| Component | Epoch | p.a. | ||||||||
| (Jy) | (mas) | (∘) | (mas) | (∘) | (mas) | ( c) | (∘) | |||
| C… | 1995.554 | 0.020 | 0.0 | 0.0 | 0.81 | 1.00 | 8.0 | |||
| 2000.504 | 0.024 | 0.0 | 0.0 | 0.81 | 1.00 | 8.0 | reference | |||
| E1… | 1995.554 | 0.013 | 46.74 | 93.7 | 1.60 | 1.00 | 32.5 | |||
| 2000.504 | 0.013 | 46.82 | 93.9 | 1.60 | 1.00 | 32.5 | 0.18 0.01 | 0.14 0.01 | 157.6 | |
| E2… | 1995.554 | 0.137 | 42.52 | 93.6 | 7.20 | 0.60 | 28.3 | |||
| 2000.504 | 0.135 | 42.82 | 93.5 | 7.20 | 0.60 | 28.3 | 0.31 0.04 | 0.25 0.04 | 79.6 | |
| E3… | 1995.554 | 0.038 | 37.30 | 94.6 | 2.95 | 1.00 | 6.0 | |||
| 2000.504 | 0.040 | 38.01 | 94.9 | 2.95 | 1.00 | 6.0 | 0.74 0.02 | 0.58 0.02 | 110.2 | |
| W1… | 1995.554 | 0.030 | 46.08 | 78.3 | 5.54 | 0.53 | 7.0 | |||
| 2000.504 | 0.027 | 46.62 | 78.3 | 5.54 | 0.53 | 7.0 | 0.54 0.07 | 0.43 0.07 | -78.2 | |
| E4… | 1995.554 | 0.213 | 45.67 | 106.0 | 11.53 | 0.69 | 11.7 | |||
| 2000.504 | 0.216 | 45.67 | 106.0 | 11.53 | 0.69 | 11.7 | fixed | |||
| E5… | 1995.554 | 0.074 | 32.59 | 105.4 | 10.20 | 0.58 | 0.9 | |||
| 2000.504 | 0.071 | 32.59 | 105.4 | 10.20 | 0.58 | 0.9 | fixed | |||
| E6… | 1995.554 | 0.209 | 33.89 | 89.4 | 20.32 | 0.40 | 83.2 | |||
| 2000.504 | 0.229 | 33.89 | 89.4 | 20.32 | 0.40 | 83.2 | fixed | |||
| W2… | 1995.554 | 0.333 | 45.07 | 50.1 | 41.63 | 0.42 | 22.8 | |||
| 2000.504 | 0.323 | 45.07 | 50.1 | 41.63 | 0.42 | 22.8 | fixed | |||
| W3… | 1995.554 | 0.143 | 21.91 | 77.0 | 35.69 | 0.63 | 86.2 | |||
| 2000.504 | 0.162 | 21.91 | 77.0 | 35.69 | 0.63 | 86.2 | fixed |
NOTE – Parameters of each Gaussian component of the model brightness distribution: , flux density; , polar coordinates of the center of the component relative to an arbitrary origin, with polar angle measured from north through east; , major and minor axes of the FWHM contour; , position angle of the major axis measured from north through east; , relative proper motion of the component; , relative projected velocity in units of ( = H0/65 km s-1 Mpc-1), along the given position angle (p.a.).
The first hot spot velocities in CSOs by Owsianik & Conway (ows98 (1998)) required time baselines of years, with VLBI observations at 5 GHz. By going to higher frequencies (15 and 43 GHz), Taylor et al. (tay00 (2000)) reduced this to years for a few strong CSOs. Currently 10 sources have been measured (Polatidis et al. pol02 (2002)). Typical velocities are 0.2 (i.e. 0.31), which due to the large distance of the sources, translates into angular motions of typically only a small fraction of mas/yr (32 as/yr at ), thus requiring long time intervals and high angular resolutions. We consider observations at 5 GHz separated by 5 years. More observations in the future are planned to extend the time baseline and to better constrain the results.

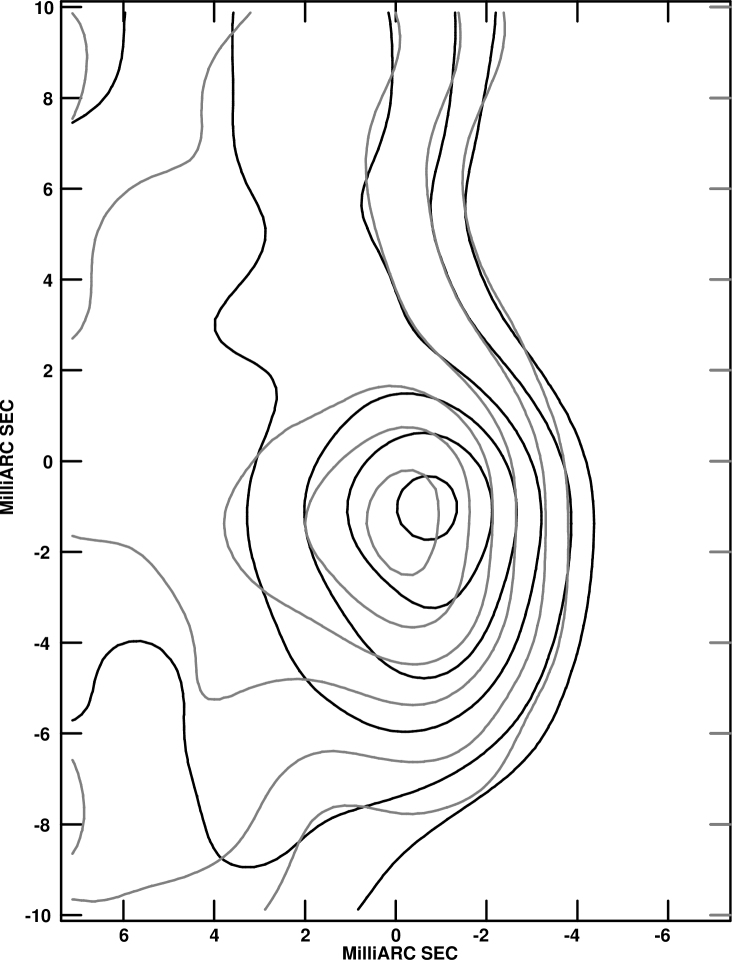
To measure the advance velocity in 4C 31.04, we compare the model-fit of the dataset in our two epochs. Fig. 3 illustrates the motion of all the compact components with arrows of length proportional to the magnitude of their motion. It is apparent that all the components have moved away from the core. In particular, the two hot spots W1 and E2 show motions almost in the same direction as their position angles. Furthermore, the increase in hot spots separation becomes even more clearly visible when E2 and W1 are directly compared. In Fig. 4 we show a magnified inset around the west hot spot region with contours drawn for both epochs. In this image the 2000.504 profile has been shifted by 0.3 mas westward, so that the position of component E2 is the same in both maps (the displacement needed in declination is smaller than the measurement errors). The motion of the peak of W1 is clear, confirming the results of model-fitting.
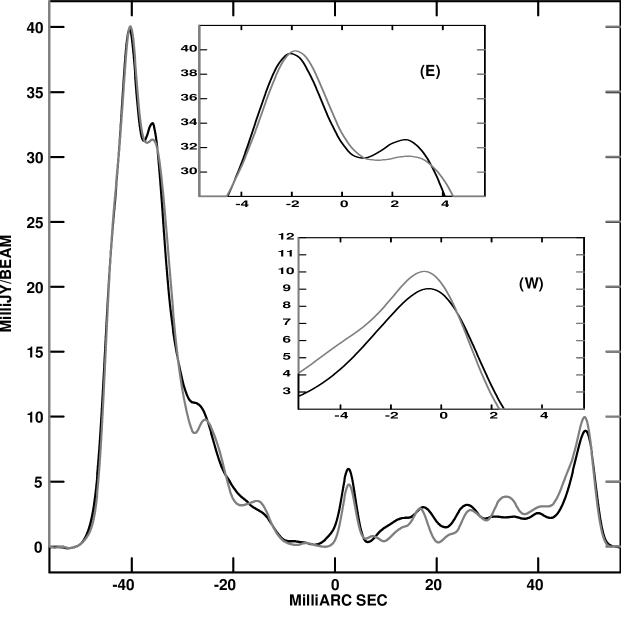
In Fig. 5 we show a brightness profile made in AIPS with the task SLICE. The two profiles are derived from the two epochs along the same slice. This slice cuts the two hot spots at a position angle of (measured north to east), passing close to the core (but not across the core itself because of a small bend in the jet). In the global profile one can easily see the two lobes on the opposite sides (the east one being the brightest) and the core region in the middle (see Sect. 3.5 about core variability). The hot spot regions are magnified in the two insets, showing that both in the eastern and the western hot spot the 2000.504 profile is shifted outward. This displacement, though small, is clear both in the rising and in the falling part of the profile. We remind the reader that the region between the core and the west hot spot is poorly imaged, so that the features present in the slices in this region are not completely reliable. It is also possible that some of the changes are due to turbulence present in this back-flow region.
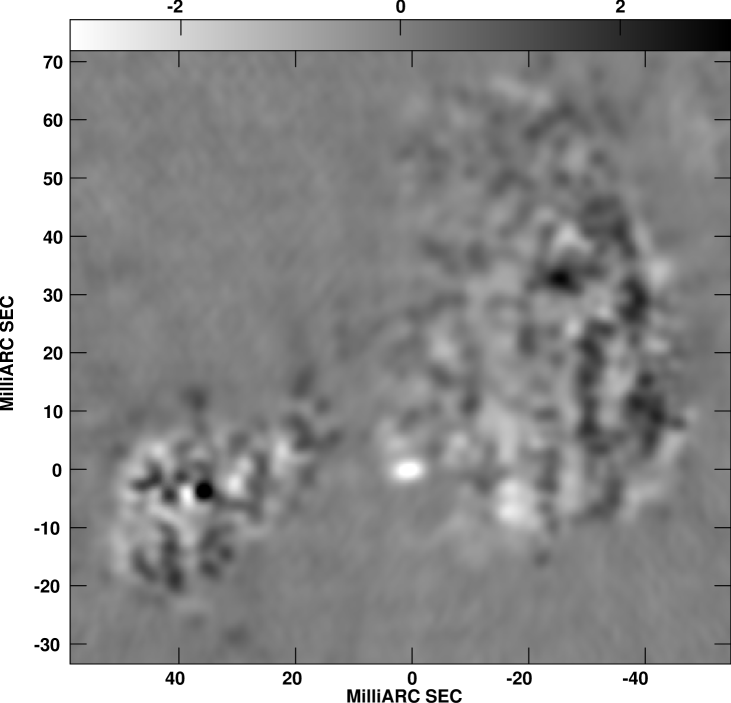
The increase in the hot spot separation implies an expansion of the whole source. Since the lobes are too extended and faint to measure their expansion by model-fitting, we tried to directly compare the two images. The difference map shown in Fig. 6 was done with the AIPS task COMB. The features that appear in this image, in particular in the eastern lobe, are clearly related to the expansion of the source. The two close white and black spots are due to the outward shift of the peak of component E3. Moreover, the presence of a white stripe all around the outer edge of the lobe, though faint, is suggestive of an expansion of the whole eastern lobe in this direction. Note that a similar white stripe, even if less evident, is present all around the edge of the west lobe.
As these last results (shown by Fig. 4, 5, 6) are drawn from the images and not from the model, we feel that they lend support to the detection of motion and to the estimate of its velocity derived from the model-fits. With just two epochs available, and a moderately short time baseline, it is difficult to better quantify the accuracy of our measurements of component motions. We hope to address this difficulty with future observations.
Model-fitting of the present data (see Table 1) provides the most reliable information on the velocity. The east and west hot spots present quite different displacements, W1 = (0.54 0.07) mas and E2 = (0.31 0.04) mas. It is possible that such differences may be due to a velocity asymmetry related to an inhomogeneous ISM, but it is not possible to discuss it more deeply with only a two epoch measurement. Since the two arms are about the same length and the source is near to the plane of sky, we will assume that the average velocity over the long term is the same in both directions.
We therefore try to estimate the advance speed by averaging up the results for the two hot spots W1 and E2. This yields an average motion of (0.42 0.08) mas in 5 years. This indicates that each hot spot is advancing at (0.085 0.016) mas/yr, i.e. (0.33 0.06) . The most distant component (W1) is located 46.62 mas from the core, so it would have taken 548 100 years to cover this distance at such speed. Therefore, based on kinematics, we can estimate the source age at 550 years.
3.3 Spectral Index Distribution and Spectral Age
From the measured energy distribution of a population of electrons it is possible – under a few basic assumptions – to determine how long these electrons have been radiating. This has proved to be a useful tool in estimating ages of compact radio sources (e.g. Murgia et al. mur99 (1999); Readhead et al. 1996a ). In order to perform such a study, one needs to know the spectral index distribution and the magnetic field in the source.
The image in Fig. 7 shows the spectral index for 4C 31.04 between 1.3 and 4.8 GHz at a resolution of 3.0 mas (FWHM). The core spectrum is inverted333Spectral index is defined according to . (). This is probably due to self-absorption, even after accounting for possible flux density variability (see Sect. 3.5). In the east lobe, the hot spot region shows a flat spectrum ( 0.1 0.01) with a constant and uniform steepening toward the core direction, up to 1.0 ( 0.02) at 20 mas from the core, just before the ‘gap’ between the core and lobe. The spectral index distribution is more complicated in the west lobe perhaps on account of a stronger interaction of the radio plasma with the ISM, as suggested also by the lobe morphology (see Sect. 4.2). The region of the faint hot spot is still flat () but the spectral index steepening is more irregular moving toward the core and to the north. The steepest values in the more external northern regions are as high as 1.0-1.2. In the core-hot spot direction the region from 10 to 30 mas shows again a flat spectrum (0.1-0.4) suggesting a local interaction between radio plasma and the dense ISM. Imaging problems in this low brightness region could also play a role.
In this high resolution image, one can see the region of the hole close to the east hot spot. The spectral index is very steep here, not only in the deep hole itself – where it is as steep as 1.7 0.04 – but also in external lobe region, where we find = 1.0 0.04.
In a population of electrons with an initial power-law energy distribution, synchrotron losses produce a curvature in the original straight power-law radio spectrum. The curvature manifests itself at a critical frequency related to the electron age. The shape of the spectrum and the critical frequency crucially depend on the evolution of the electron pitch angle distribution with time (Pacholczyk pac70 (1970)). We used the Jaffe-Perola model which assumes a redistribution of electron pitch angles on time scales short compared with their radiative lifetimes (Jaffe & Perola, jaf73 (1973)). To derive the critical frequency from the spectral index information, we used the Synage program (Murgia & Fanti mur96 (1996)). Since a spectral age measurement can give only the time since electrons were accelerated, we avoided the core and hot spot regions where local turbulence and electron re-acceleration is likely to be present, and investigated the steep-spectrum, relaxed regions where the ‘oldest’ electrons are present. The break frequency was found to be 7.4 GHz in the east lobe at 20 mas from the core, and between 6.1 and 7.2 GHz in the northern region of the west lobe.
The MERLIN image in Fig. 2 lends strong support to this estimate, showing that very little of the lobe emission is detected at 22 GHz. This cannot be due to a lack of short spacings since the MERLIN has baselines down to 6 km. It follows that the lobes are undetectable because of spectral steepening. Fig. 8 shows the spectrum for the two hot spots, the lobes and the core. The steepening between 5 and 22 GHz in the lobes supports the presence of a spectral break around 5-7 GHz.

The local magnetic field, which is also needed to derive the lifetime of radiating electrons, was calculated assuming equipartition. We note that a recent X-ray study of a relatively compact FR II radio source (Brunetti et al. bru01 (2001)) indicates that the magnetic field in the radio lobes is very near equipartition; equipartition conditions in GPS are also preferred by Snellen & Schilizzi (sne02 (2002)). Standard formulae (Pacholczyk pac70 (1970)) were used under the assumption that relativistic particles and magnetic fields occupy the same volume (), and that the amount of energy in heavy particles is the same as that in electrons (). We assumed cutoffs in the relativistic particle energies at 10 MHz and 100 GHz. The major uncertainty in the estimation of the equipartition field strength comes from the assumption of the source depth which we assumed to be equal to the smaller transverse dimension of the lobe regions where we estimated the magnetic field.
With these assumptions the derived equipartition magnetic field is 4.1 milligauss in the east hot spot region, decreasing to 3.3 milligauss in the direction of the core. In the less bright west hot spot we find 3.5 milligauss and even smaller values (2.2-2.7 milligauss) in the extended W lobe regions. The uncertainties are mainly due to the non-uniform spectrum present in this region. With these results the estimated radiative age of older emitting electrons is 3.0 103 yrs in the east lobe (near the core) and 4.5-4.9 103 yrs in the northern region of the west lobe. An estimate of the uncertainty of these values is not obvious since errors are mainly model dependent.
3.4 Polarization
After removing the instrumental polarization we did not detect any polarized signal from the source. The upper limit on the polarized flux density is mJy/beam at 5 GHz. This limit corresponds to % polarization at the brighter, eastern hot spot, to % polarization at the core, and % at typical locations in the lobes.
3.5 Variability
The sum of model-fit components in the two epochs is 1.21 and 1.24 Jy respectively, which gives an insignificant difference of just 2%. Given that many of the components are extended, such a small variation in the total flux density over 5 years seems reasonable. The core component is compact (size mas) and could be more variable. In fact from the model-fit results (Table 1) the core varies from 20 1 mJy in 1995 to 24 1 mJy in 2000. Although this variation is only significant at the 3 level, if it is real then it indicates a change by 20%. This variation is consistent with the limits on core variability implied by the integrated intensity observations of Fassnacht & Taylor (fas01 (2001)) from a small sample of CSOs studied over the course of eight months. Fassnacht & Taylor found the rms variation in the integrated flux density to be 0.7%. Assuming all that variation was due to the core component, and given an average core fraction of 0.03 (Taylor et al tay96 (1996)), leads to an estimate for the core variability in CSOs of less than 23%. Better limits on the variability of core components in CSOs will require VLBI monitoring campaigns, rather than low resolution studies only sensitive to the integrated flux density. The radio galaxy 4C 31.04 is an excellent candidate for such a study since the core is comparatively strong and isolated from nearby jet components.
4 Discussion
4.1 Ages of Compact Symmetric Objects
We derive the kinematic age of 4C 31.04 to be 550 years. This estimate is within the 300 to 1200 year range of ages found in the literature (Polatidis & Conway pol02 (2002); Owsianik & Conway ows98 (1998); Taylor et al. tay00 (2000)). It is interesting to ponder the narrowness of this range. Even younger sources would need to be smaller, and/or have faster hot spot advance speeds. Currently there is a lower limit on the size of a source of a few mas ( pc) that we can readily classify as a CSO by identifying a core component between two hot spots. Assuming that the hot spot advance speed through the AGN environment is similar () for an ultra-compact CSO (the denser environment on such small scales should make this a conservative assumption) then we can derive a lower limit to the age of observed CSOs of 100 years. There is also an observational upper limit on the size of CSOs. This is the size beyond which the CSO becomes difficult to observe with VLBI arrays since an interferometer is only sensitive to certain spatial frequencies. VLBI arrays have difficulty imaging components larger than about 40 beams, or sources lacking a strong compact component. By the time CSOs reach 1 kpc in size the lobes will be largely resolved out and the hot spots will be resolved to the extent that a direct detection is impossible without phase referencing. Velocity measurements of heavily resolved components are also much more difficult. These parameters give a conservative upper limit on the source age of 10000 years. Future advances in Space VLBI may discover radio sources younger than 100 years, and the E-MERLIN and EVLA projects may provide sufficient resolution and sensitivity to extend the upper boundary of sources for which we can determine a kinematic age. We also note that the advance speed of both east and west hot spots in 4C 31.04 at 0.33 are at the high end of those measured in CSOs to date, corresponding to a hot spot separation velocity of 0.39 . This should be confirmed with future epochs.
It is of interest to compare the dynamic age of 550 years – derived from the study of hot spot velocities, to the radiative age – which we estimate from synchrotron losses in 4C 31.04 to be years. The radiative age is nearly an order of magnitude larger than the dynamic age estimate, indicating that some of our assumptions are in error.
First, we note that the kinematic age estimate rests on the assumption that the velocity has been constant over the lifetime of the source. Although Readhead et al (1996b ) argue that only mild evolution in velocity is likely, this assumption may not hold in 4C 31.04. As discussed in Sect. 4.2, there is evidence from the radio morphology of a strong interaction between the jet and the ISM. This could be making the jet wander around within the lobe, forming new hot spots which drill quickly out for some brief time before being shut off. Further suggestion that the kinematic age may be an underestimate comes from the west lobe dimension: the weakest detectable emission northward is about 60 mas which would require a lobe expanding at .
On the other hand, it is possible that the radiative age is overestimated by the equipartition field strength or the value of the critical frequency. While the 22 GHz data suggest that the value of the critical frequency is quite accurate, we note that the equipartition field could easily be higher if either or . In this case the radiative age would be much more similar to the kinematic estimate; for instance milligauss (given by and ) would yield years. Furthermore, this result was obtained assuming no energy losses due to Inverse Compton interactions. Even if scattering with the microwave background can be neglected with no harm, it is possible that in such a small source some interaction is present between relativistic electrons in the lobes and photons from the active core. The radiative age would then be smaller than calculated.
It is not easy to infer from the present data which estimate is the most reliable. We hope to address the question of the dynamic age with additional observations in the next years. Other studies of magnetic fields in CSOs would help to understand how correct are the assumptions going into the radiative age estimate. Also, high resolution low frequency data could help to estimate from self-absorption analysis, while high frequency data will allow a better estimate of the critical frequency.
4.2 Morphology and interaction with ISM
The radio morphology of the two lobes is quite different. It is likely that their asymmetry is related to a slightly different ambient medium. In particular, the interaction between the relativistic jet and the ISM can lead to the formation of lobes of various morphologies.
According to computer simulations presented by Bicknell et al. (bic02 (2002)), the extended, low brightness morphology of the western lobe could be produced by a jet interacting with many ISM clouds. This interaction is not so strong as to destroy the jet but would cause: (1) the presence of a hot spot fainter than usual and (2) the spread of a large fraction of relativistic plasma carried by the jet and therefore the formation of a diffuse, faint lobe.
In the same scenario, the more compact and regular morphology of the eastern lobe suggests that it is undergoing less interaction with the ISM. The deep hole close to the hot spot becomes an even more interesting feature. Could it be due to foreground absorption or is it truly a large region in the lobe devoid of any radio emitting plasma? The steep spectral index of 1.7 0.04 found from the spectral index image (Fig. 7), argues against foreground absorption by thermal electrons which would produce an inverted spectrum. This leaves us with a remarkable hole in the lobe. It would be interesting to search for the presence of dense molecular gas that might be impenetrable by the radio plasma.
4.3 Evolution of CSOs
Despite uncertainties and some discrepancy between kinematic and spectral age for 4C 31.04, our results clearly indicate that it is indeed a very young source. Most of the known Compact Symmetric Objects have been selected from flux limited samples, so that they are usually quite bright and they will likely evolve into FR II radio galaxies. It is interesting to ask what will be the fate of the weaker 4C 31.04, and try to learn more on the relation between ‘child’ and ‘adult’ stages of radio sources.
One of the problems with the youth scenario is given by the relative numbers of small sources (CSOs, CSS) and large classical double radio galaxies. This has been explained by models (e.g. Fanti et al. fan95 (1995)) in which the total power of the source decreases as a power law function of linear size : . As a consequence of variations of external density and pressure, the index is not very strictly constrained and it may actually change on different scales and for different sources.
If we roughly use as a law for radio power evolution (O’Dea ode98 (1998)), we find that 4C 31.04 will drop below the power of W/Hz as soon as it will be 40 times larger than its actual size. In other words, by the time 4C 31.04 will be 5 kpc large, its power will be similar to that of edge darkened FR I radio galaxies. Even if this threshold is actually not so sharp and the numbers vary, it is interesting to speculate that 4C 31.04 may have an FR I morphology in the future. In fact, based on pc-scale jet velocities and properties, G (01) argued that there are no significant differences between FR I and FR II radiogalaxies on pc-scales. It is then interesting to note that a possible future FR I radio galaxy now has the same edge brightened look of CSOs evolving into FR IIs. Thus, even in a completely different evolutionary stage, there would seem to be no difference on the small scale between FR Is and FR IIs. The discovery of other CSOs among samples of low-power sources is needed to better understand the evolution of low-power radio galaxies.
4.4 Lack of Polarization
Synchrotron emission is intrinsically polarized up to 70%, depending on the amount of order in the source magnetic fields (Burn bur66 (1966)). Why is there so little polarized emission from 4C 31.04 and other CSOs (Peck & Taylor pec00a (2000))? From the Hi observations we know that 4C 31.04 is viewed through a moderate density of atomic gas. If there is ionized gas present as well along with a magnetic field, then the radiation from 4C 31.04 that we observe could have been depolarized by a change in polarization angle within each 8 MHz IF, or by a gradient in the foreground Faraday screen. For bandwidth depolarization to be effective at 5 GHz requires RMs of 105 rad m-2, while beam-width depolarization requires gradients in the RM of 300 rad m-2 mas-1 or more.
5 Conclusions
From the comparison of the two VLBI images at 5 GHz, a small but significant expansion appears to be present in the Compact Symmetric Object 4C 31.04. From the derived expansion rate and the current size of the source we calculate an age of 550 years. A somehow larger value of the age (3000 – 5000 yrs) is derived from spectral index analysis. Despite a significant difference, both results agree that the source is very young, as already demonstrated for other CSOs in the literature. However, the relatively high hot spots velocity and its low power make of 4C 31.04 a peculiar case among CSOs.
The discrepancy and uncertainty in the age estimates, the uncommon presence of a deep ‘hole’ in the East lobe, the detection and the variability of the compact core suggest that it may be worth observing this source again in the future. New VLBI observations will be of interest to look for free–free absorption at low frequency, to confirm the expansion, and to look for spectral aging at high frequency.
Acknowledgements.
We thank the referee, Dr. M. S. Brotherton, for useful comments which improved the clarity of the paper. This research has made use of the NASA/IPAC Extragalactic Database (NED) which is operated by the Jet Propulsion Laboratory, Caltech, under contract with NASA. This research has also made use of NASA’s Astrophysics Data System Abstract Service. GBT thanks the CNR for hospitality during his visit when much of this work was accomplished. This work was partly supported by the Italian Ministry for University and Research (MIUR) under grant COFIN 2001-02-8773.References
- (1) Becker, R. H., White, R. L., & Edwards, A. L. 1991, ApJS, 75, 1-229
- (2) Bicknell, G. V. 2002 in The Physics of Relativistic Jets in the CHANDRA and XMM Era ed. G. Brunetti, D. E. Harris, R. M. Sambruna and G. Setti, NewAR, in press
- (3) Brunetti, G., Cappi, M., Setti, G., Feretti, L., & Harris, D. E. 2001, A&A, 372, 755
- (4) Burn, B. F. 1966, MNRAS, 133, 67
- C (96) Conway, J. E. 1996 in The Second Workshop on Gigahertz Peaked Spectrum and Compact Steep Spectrum Radio Sources, ed. I. A. G. Snellen, R. T. Schilizzi, H. J. A. Rottgering and M. N. Bremer [Leiden Observatory], 198
- (6) Conway, J. E. 1999, NewAR., 43, 509
- (7) Cotton, W. D., Feretti, L., Giovannini, G., et al. 1995, ApJ, 452, 605
- (8) Fanti, C., Fanti, R., Dallacasa, et al. 1995, A&A, 302, 317
- (9) Fassnacht, C. D., & Taylor, G. B. 2001, AJ, 122, 1661
- G (01) Giovannini, G., Cotton, W. D., Feretti, Lara, L., & Venturi, T. 2001, ApJ, 552, 508
- (11) van Gorkom, J. H., Knapp, G. R., Ekers, R. D., et al. 1989, AJ, 97, 708
- (12) Gregory, P. C., & Condon, J. J. 1991, ApJS, 75, 1011-1291
- (13) Jaffe, W. J., & Perola, G. C. 1973, A&A, 26, 423
- (14) Murgia, M., & Fanti, R. 1996, Rapporto Interno IRA, 228/96
- (15) Murgia, M., Fanti C., Fanti R., et al. 1999, A&A, 345, 769
- (16) O’Dea, C. P. 1998, PASP, 110, 493
- (17) Owsianik, I., & Conway, J. E. 1998, A&A, 337, 69
- (18) Pacholczyk, A. G., 1970, Radio Astrophysics. Freeman & Co., San Francisco
- (19) Peck, A. B., & Taylor, G. B. 2000, ApJ, 534, 90
- (20) Peck, A. B., Taylor, G. B., Fassnacht, C. D., Readhead, A. C. S., & Vermeulen, R. C. 2000, ApJ, 534, 104
- (21) Perlman, E. S., Stocke, J. T., Conway, J., & Reynolds, C. 2001, ApJ, 122, 536
- (22) Pihlström, Y. M. 2001, Radio Studies of Circumnuclear Gas in Active Galaxies, Ph.D. Thesis, Chalmers University of Technology, Göteborg
- (23) Polatidis, A., & Conway, J. E. 2002, in The Third Workshop on Compact Steep Spectrum and GHz-Peaked Spectrum Radio Sources, PASA
- (24) Polatidis, A., Conway, J. E., & Owsianik, I. 2002, in Proceedings of 6th EVN Symposium, edited by E. Ros, E.W. Porcas, A.P. Lobanov and J.A. Zensus, p. 139
- (25) Readhead, A. C. S., Taylor, G. B., Xu, W., et al. 1996a, ApJ, 460, 612
- (26) Readhead, A. C. S., Taylor, G. B., Pearson, T. J., & Wilkinson, P. N. 1996b, ApJ, 460, 634
- (27) Snellen, I. & Schilizzi, R. 2002, NewAR, 46, 61
- (28) Taylor, G. B., Readhead, A. C. S., & Pearson, T. J. 1996, ApJ, 463, 95
- (29) Taylor, G. B., Marr, J. M., Pearson, T. J. 2000, ApJ, 541, 112
- (30) Wrobel, J. M. & Simon, R. S 1986, ApJ, 309, 593