Chemistry and Dynamics in Pre-Protostellar Cores
Abstract
We have compared the intensity distribution of molecular line emission with that of dust continuum emission, and modeled molecular line profiles in three different preprotostellar cores in order to test how dynamical evolution is related to chemical evolution, and whether we can use different chemical tracers to identify specific dynamical evolutionary stages. We used dust continuum emission to obtain the input density and temperature structures by calculating radiative transfer of dust emission. Our results show that chemical evolution is dependent on dynamical processes, which can give different evolutionary timescales, as well as the density structure of the core.
keywords:
ISM: molecules – Stars: formation1 Introduction and Observations
Low mass star formation has received more detailed study, both in theory and observation, compared to massive star formation. An evolutionary seqence of low mass star formation based on the spectral energy distribution (SED) has been developed (Adams et al. 1987). However, the initial conditions of collapse are still poorly understood. Preprotostellar cores (PPCs) are believed to be gravitational bound, but they have no central hydrostatic protostar (Ward-Thompson et al. 1994). Therefore, PPCs can be considered as the potential sites of future star formation and give us chances to probe the initial conditions of star formation. Evans et al. (2001) modeled dust continuum in three PPCs using Bonnor-Ebert spheres and showed that the dust temperature decreases toward the center because PPCs are heated only by the interstellar radiation field, and the radiation from the cores is optically thin. Therefore, they argued that the actual density structure of a preprotostellar core is more centrally condensed compared to the intensity distribution of the dust continuum emission.
Several studies on chemical evolution in PPCs have been done by Bergin & Langer (1997), Aikawa et al. (2001), Caselli et al. (2002), and Li et al. (2002). They tested different dynamical scenarios, but all included the interaction of gas phase molecules with the surfaces of dust grains as well as gas phase chemistry and showed that some molecules such as CS and CO are depleted substantially from the gas phase as the density increases. Those molecules have high binding energy onto the surfaces of dust grains, so their timescales for evaporation by thermal energy or cosmic rays are much longer than those of molecules that have lower binding energy. For instance, nitrogen bearing molecules such as N2H+ and NH3, which become abundant in later stages of dynamical evolution and have low binding energy, do not show as significant depletion as CO and CS. Comparison of the abundance change of a molecule with time and the differential distributions of molecules in a given time seems to be able to trace the dynamical evolutionary stages. We tested this idea by comparing the line emission from several molecules that have different chemical evolution timescales with dust emission, which can trace physical conditions, in three PPCs: L1512, L1544, and L1689B.
We observed the three PPCs in C18O ( and ), C17O (), DCO+ (), (), and () with the 10.4 m telescope of the Caltech Submillimeter Observatory (CSO) at Mauna Kea, Hawaii from 1995 to 2002. We also observed these cores in (), (), and CCS () with the 45 m telescope of the Nobeyama Radio Observatory in Japan on January 2002. See Lee et al. (2003) for details about observations.
2 Simple Analysis
We compare, first, the H2 column densities calculated from molecular lines (C18O and C17O ) and dust continuum, which can be used as the tracer of column density least affected by chemistry (Figure 1.a). We assume that temperature and abundance are constant along the line of sight, that gas and dust have the same temperature, that all levels are in LTE, and that lines are optically thin. The H2 column densities calculated from C18O are smaller than those calculated from 850 m dust emission by a factor of 10 to 25. Also, the C18O emission shows no peak at the position of the peak of dust continuum emission. If this line is optically thin, so that it traces all material along the line of sight, the difference would be caused by the depletion of CO. The optical depth of C17O can be calculated by fitting the relative strength of its hyperfine components, and the calculated optical depths in three PPCs show that the optical depth of C17O is negligible in all three cores, but C18O is optically thick in L1544 and L1689B (see §4.2.1 of Lee et al. 2003). Therefore, if we use an optically thick line, the depletion factor can be overestimated. The comparison between the H2 column densities calculated from C17O and 850 m dust emission shows that the CO molecule is significantly depleted in L1512 and L1544 but not in L1689B.
We also compare the distributions of the intensity of molecular emission and dust continuum emission (Figure 1.b). L1512 is the weakest, and L1544 and L1689B are similar in dust continuum. However, the CCS intensity of L1689B is more similar to that of L1512. Even though the distribution of CCS is very different from that of the dust continuum, it does not show the central dip expected if the molecule is depleted significantly as some chemical modelings show. We suggest that this trend would be caused by the significant depletion of CO, helping C+ to react more with molecules that are not oxygen-bearing species (Li et al. 2002). The intensity of N2H+ follows dust emission well in L1544 and L1689B, but it is weaker in L1689B than in L1544. The difference is possible because CO, which is a destroyer of N2H+, is much more depleted in L1544. On the other hand, in the central region of L1512, the N2H+ distribution is flatter than the dust emission indicating the possible depletion of N2H+.

3 Detailed Models
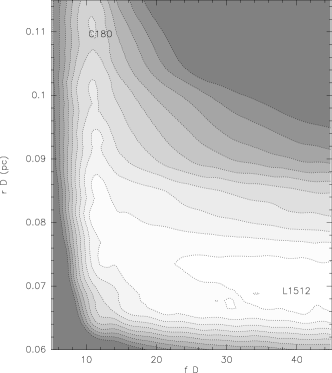
The simple method used in the previous section has limitations for quantitative analysis because it cannot include the variation of the excitation temperature and the abundance of a molecule along the line of sight. Therefore, we used the Monte Carlo (MC) code and the virtual telescope simulation code developed by Choi et al. (1995) to calculate radiative transfer of molecular lines and to simulate specific molecular line profiles, respectively. For the simulation, we adopted two physical models: Bonnor-Ebert spheres (Bonnor 1956, Ebert 1955), which give only density structure; and Plummer-like spheres (Whitworth & Ward-Thompson 2001), which give density and velocity structures and can be used for optically thick lines to simulate their self-absorbed line profiles (see §5.2 of Lee et al. (2003) for details). We calculated the radiative transfer of dust emission to obtain the temperature structure (Evans et al. 2001). For the structure of molecular abundances, we tested several functional forms; the step function, which defines a depletion factor () and a depletion radius (), was the best to fit line profiles from the center to the outer regions in the three PPCs (Fig. 5 in Lee et al. 2003). We modeled C18O, , DCO+, and HCO+ lines using a step function of each abundance in order to test how much those molecules are depleted within what radii. Figure 2 shows that the depletion radius is well constrained around 0.075 pc, but the fractional depletion is constrained only to be greater than about 25 in the C18O lines of L1512. This trend occurs in every molecule that is significantly depleted, so we consider to be the lower limit of the depletion factor. In other words, the data are consistent with complete depletion inside some . Figure 3 shows the best-fit model of C18O in L1512. The results of modeling in the three cores are summarized in Table 1.
| C18O | H13CO+ | DCO+ | ||
|---|---|---|---|---|
| L1512 | 0.075 pc | 0.021 pc | a | |
| 25 | 25 | a | ||
| L1544 | 0.045 pc | 0.026 pc | 0.022 pc | |
| 25 | 20 | 3 | ||
| L1689B | 0.030 pc | 0.012 pc | 0.011 pc | |
| 3 | 5 | 4 |
a We could not calculate and of DCO+ in L1512 because we have only one spectrum toward the center.
According to our results, CO is substantially depleted in L1512 and L1544 but not in L1689B. In addition, the depletion radius of CO in L1512 is greater than that in L1544. The C18O lines in L1689B might be affected by surrounding warm gas (see §5.3.2 of Lee et al. 2003). HCO+ is also depleted significantly in L1512 and L1544, but the depletion radii are smaller than those of CO. On the other hand, DCO+ does not show significant depletion in any of these three cores. We might not detect the depletion of DCO+ because our observational resolution was poor.

4 Discussion
Our simple analysis and detailed modeling of molecular line profiles combined with dust continuum emission show that L1512 is least centrally condensed, but CCS, CO, and HCO+ are significantly depleted. Even N2H+ is possibly depleted in L1512. On the other hand, L1689B has a similar density structure to L1544, which is quite centrally condensed and has substantial depletion of CCS, CO, and HCO+, but no molecules except for CCS show significant depletion. This result may indicate that L1689B has evolved too fast to have time to evolve chemically. Therefore, we suggest that the stage of dynamical evolution of a core cannot be simply probed by its chemical status because chemical evolution depends on the size of dust grains (Caselli et al. 2002, in preparation) or the absolute dynamical timescale, which is different for each dynamical process, as well as its density structure that shows the relative dynamical evolutionary stages (Table 2).
| L1512 | L1544 | L1689B | |
| Density structure | Young | Evolved | Evolved |
| Chemical evolution | Evolved | Evolved | Young |
| Timescale | |||
| Dynamical state | Stable (?) | AD (?) | Free-fall (?) |
References
- [\astronciteAikawa et al.2001] Aikawa, Y., Ohashi, N., Inutsuka, S.-I., Herbst, E. & Takakuwa,S. 2001, ApJ, 552, 639
- [\astronciteAdams et al.1987] Adams, F.C., Lada, C.J., & Shu, F.H. 1987, ApJ, 312, 788
- [\astronciteBergin & Langer1997] Bergin, E.A. & Langer, W.D., 1997, ApJ, 486, 316
- [\astronciteBonnor1956] Bonnor, W.B. 1956, MNRAS, 116, 351
- [\astronciteCaselli et al.2002] Caselli, P., Walmsley, D.M., Zucconi, A., Tafalla, M., Dore, L., & Myers, P.C., 2002, ApJ, 565, 344
- [\astronciteChoi et al.1995] Choi, M., Evans, N.J.II, Gregersen, E.M., & Wang, Y., 1995, ApJ, 448, 742
- [\astronciteEbert1955] Ebert, R. 1955, Z. Astrophys., 37, 217
- [\astronciteEvans et al.2001] Evans, N.J.II, Rawlings, J.M.C., Shirley, Y., & Mundy, L.G., 2001, ApJ, 557, 193
- [\astronciteLee et al.2003] Lee, J.-E., Evans, N.J.II, Shirley, Y.L., & Tatematsu, K., 2003, ApJ, 583, in press
- [\astronciteLi et al.2002] Li, Z.-Y., Shematovich, V.I., Wiebe, D.S., & Shustov, B.M., 2002, ApJ, ApJ, 569, 792
- [\astronciteWard-Thompson et al.1994] Ward-Thompson, D., Scott, P.E., & André, P., 1994, MNRAS, 268, 276
- [\astronciteWhitworth et al.2002] Whitworth, A.P. & Ward-Thompson, D., 2001, ApJ, 547, 317